
1 Graphs
Overview
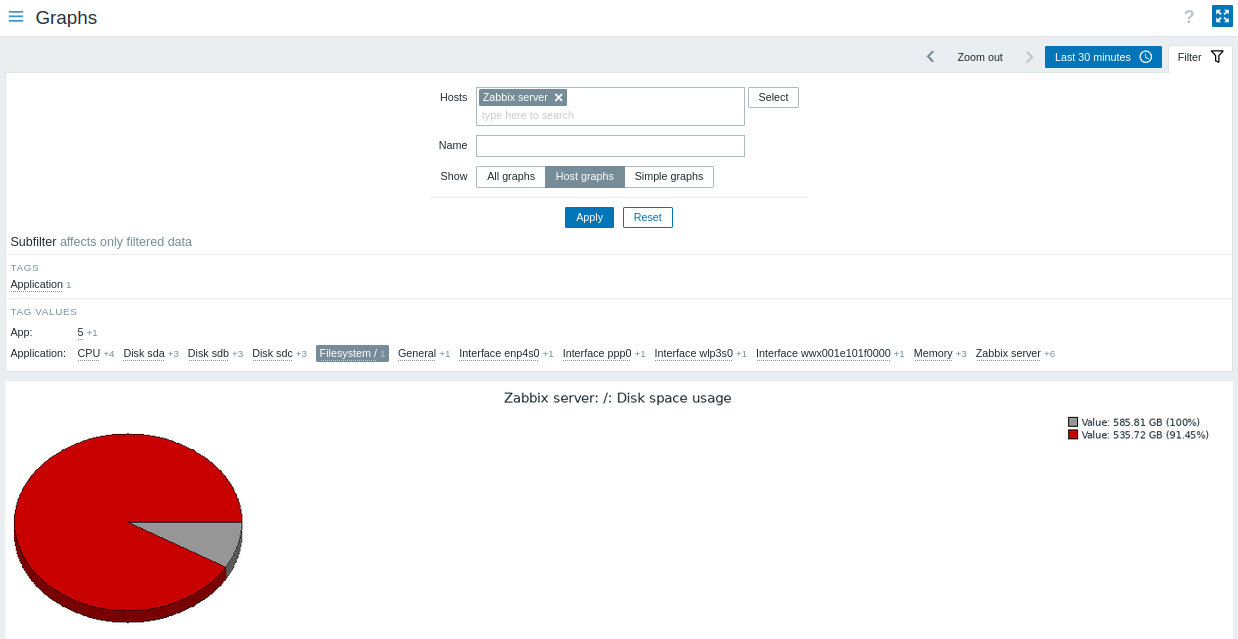
Host graphs can be accessed from Monitoring → Hosts by clicking on Graphs for the respective host.
Any custom graph that has been configured for the host can be displayed, as well as any simple graph.
Graphs are sorted by:
- graph name (custom graphs)
- item name (simple graphs)
Graphs for disabled hosts are also accessible.
Time period selector
Take note of the time period selector above the graph. It allows selecting often required periods with one mouse click.
See also: Time period selector
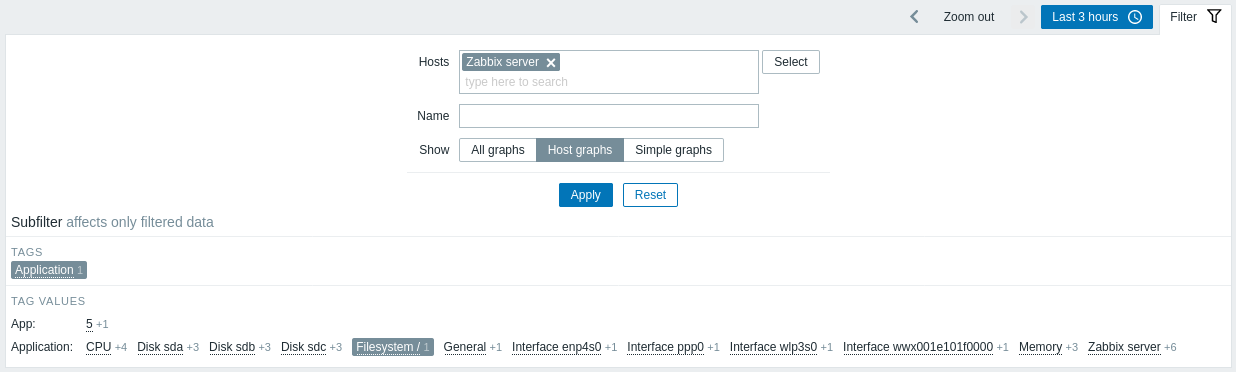
Using filter
To view a specific graph, select it in the filter. The filter allows to specify the host, the graph name and the Show option (all/host graphs/simple graphs).
If no host is selected in the filter, no graphs are displayed.
Using subfilter
The subfilter allows to further modify the filtering from the main filter.
It contains clickable links for a quick access to related graphs. Graphs are related by common entity - tag name or value. When a tag name/value is clicked, it is highlighted with a gray background, and graphs are immediately filtered (no need to click Apply in the main filter). Clicking another tag name/value adds it to the filtered results. Clicking the tag name/value again removes the filtering.
Subfilters are generated based on the filtered data, which is limited to 1000 records. If you want to see more records in the subfilter, you need to increase the value of Limit for search and filter results parameter (in Administration -> General -> GUI).
Unlike the main filter, the subfilter is updated together with each table refresh request to always get up-to-date information of available filtering options and their counter numbers.
The number of entities displayed is limited to 100 horizontally. If there are more, a three-dot icon is displayed at the end; it is not clickable. Vertical lists (such as tags with their values) are limited to 20 entries. If there are more, a three-dot icon is displayed; it is not clickable.
A number next to each clickable entity indicates the number of graphs it has in the results of the main filter.
Once one entity is selected, the numbers with other available entities are displayed with a plus sign indicating how many graphs may be added to the current selection.
Buttons
View mode buttons, being common for all sections, are described on the Monitoring page.