
1 Dashboard
Overview
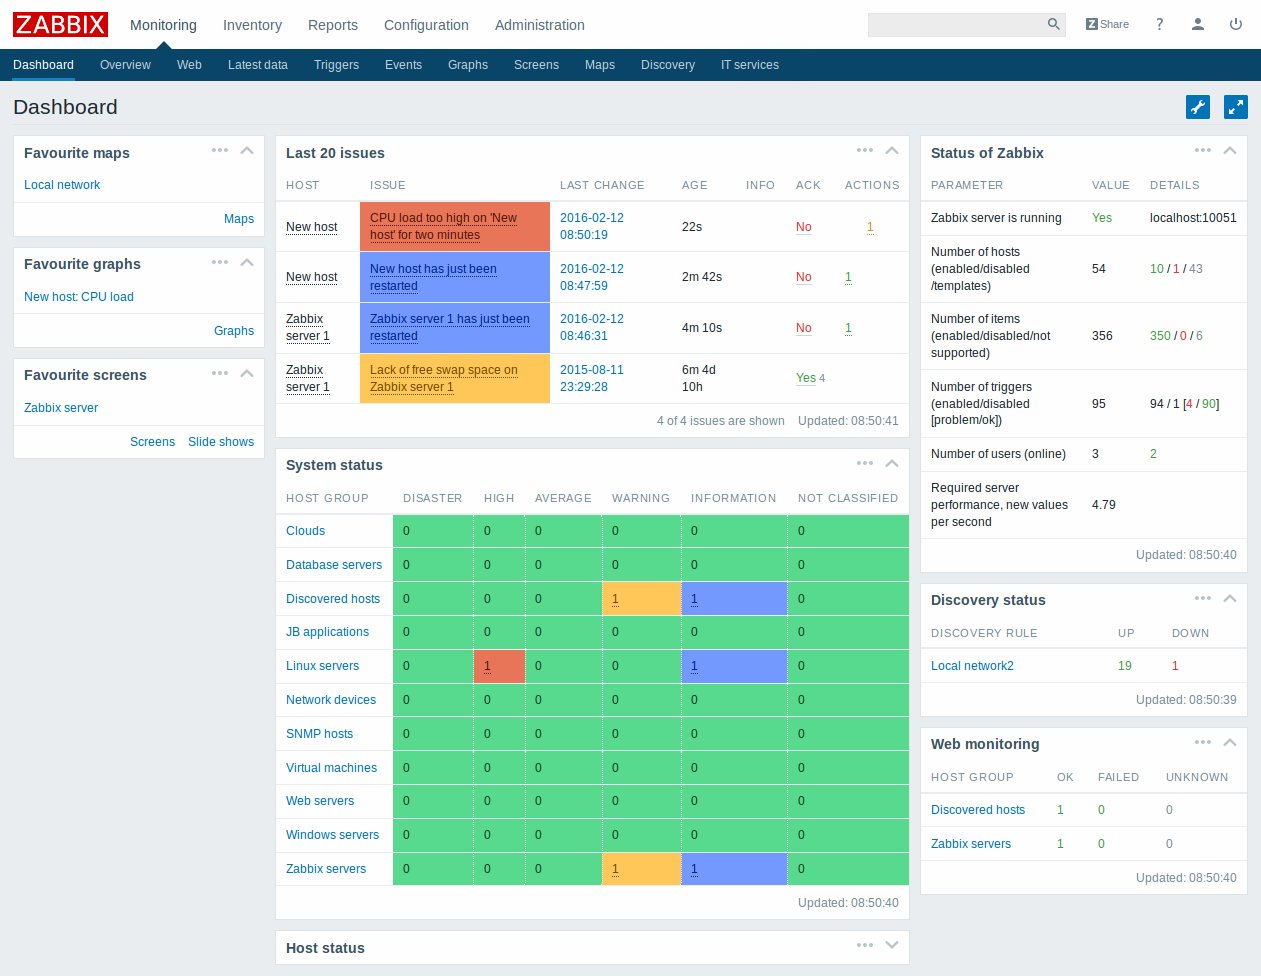
The Monitoring → Dashboard section, similar to the dashboard on your car, displays a summary of all the important information.
Favourites
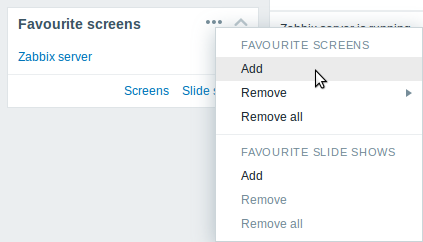
There are some widgets for favourites where you can create quick shortcuts to the most needed graphs, custom graphs, screens, slide shows and maps.
Just click on the Menu button in the widget, select to add, for example, some screen and then select from the configured screens. The selected screens will be displayed as shortcuts in the favourites widget.
Status widgets
A number of status widgets - Status of Zabbix, System status, Host status, Last 20 issues, Web monitoring, Discovery status each display a summary of the respective data.
As you may have noticed from the screenshot, the widgets can be arranged in up to three columns. Additionally, all widgets can be freely moved around. Just grab a widget by its title bar, drag and drop wherever you would like it.
Dashboard filter
Clicking on
![]() in the title bar allows you to access the dashboard filter.
in the title bar allows you to access the dashboard filter.
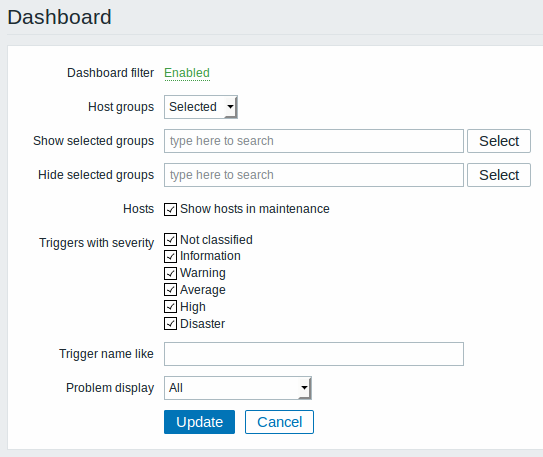
By enabling the filter you can limit what hosts and triggers are displayed in the dashboard and define how the problem count is displayed.
| Parameter | Description |
|---|---|
| Dashboard filter | Click the link to enable/disable the dashboard filter. |
| Host groups | Select to display host data from: All - all host groups Selected - selected host groups. |
| Show selected groups | This field is available if Selected is chosen in the Host groups field. Enter host groups to display. This field is auto-complete so starting to type the name of a group will offer a dropdown of matching groups. Host data from these host groups will be displayed in the Dashboard. If no host groups are entered, all host groups will be displayed. |
| Hide selected groups | This field is available if Selected is chosen in the Host groups field. Enter host groups to hide. This field is auto-complete so starting to type the name of a group will offer a dropdown of matching groups. Host data from these host groups will not be displayed in the Dashboard. For example, hosts 001, 002, 003 may be in Group A and hosts 002, 003 in Group B as well. If we select to show Group A and hide Group B at the same time, only data from host 001 will be displayed in the Dashboard. |
| Hosts | Mark the Show hosts in maintenance option to display data from hosts in maintenance in the Dashboard. |
| Triggers with severity | Mark the trigger severities to be displayed in the Dashboard. |
| Trigger name like | Limit the number of triggers displayed in the System status, Host status and Last 20 issues widgets with this string. |
| Problem display | Display problem count as: All - full problem count will be displayed Separated - unacknowledged problem count will be displayed separated as a number of the total problem count Unacknowledged only - only the unacknowledged problem count will be displayed. |
If dashboard filtering is applied, it is indicated by a green indicator
with the filter icon:
 .
.
Host menu
Clicking on a host in the Last 20 issues widget brings up the host menu. It includes links to custom scripts, latest data, triggers, inventory, graphs and screens for the host.
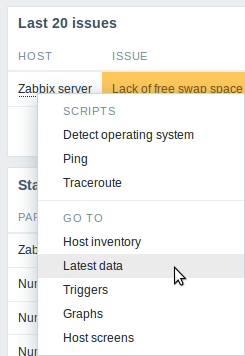
The host menu is accessible by clicking on a host in several other frontend sections:
- Monitoring → Overview (on Hosts: left)
- Monitoring → Latest data
- Monitoring → Triggers
- Monitoring → Events
- Monitoring → Events → Event details
- Monitoring → Screens (in Host issues and Host group issues widgets)
- Monitoring → Maps
- Reports → Triggers top 100
Trigger event popup
Clicking on Issue in the Last 20 issues widget brings up the trigger event popup. It includes a list of events and, if defined, the trigger description and a clickable URL.
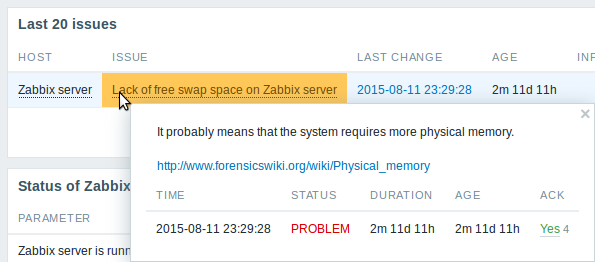
Resolved values of {ITEM.VALUE} and {ITEM.LASTVALUE} macros in the trigger description will be truncated to 20 characters.