
1 Dashboard
Overview
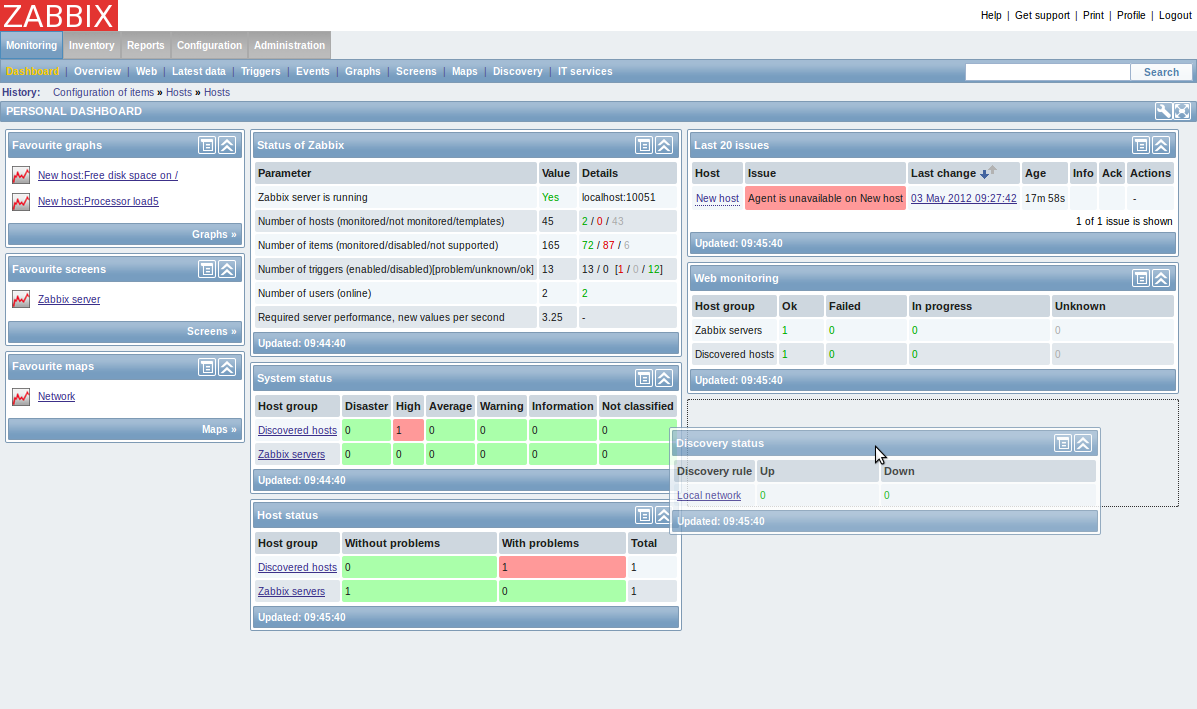
The Monitoring → Dashboard section, similar to the dashboard on your car, displays a summary of all the important information.
Favourites
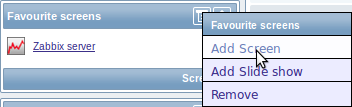
There are some widgets for favourites where you can create quick shortcuts to the most needed graphs, custom graphs, screens, slide shows and maps.
Just click on the Menu button in the widget, select to add, for example, some screen and then select from the configured screens. The selected screens will be displayed as shortcuts in the favourites widget.
Status widgets
A number of status widgets - Status of Zabbix, System status, Host status, Last 20 issues, Web monitoring, Discovery status each display a summary of the respective data.
As you may have noticed from the screenshot, in Zabbix 2.0 the widgets can be arranged in up to three columns. Additionally, all widgets can be freely moved around. Just grab a widget by its title bar, drag and drop wherever you would like it.
Dashboard filter
Clicking on the first icon on the right of the Personal dashboard title bar allows you to access the dashboard filter.
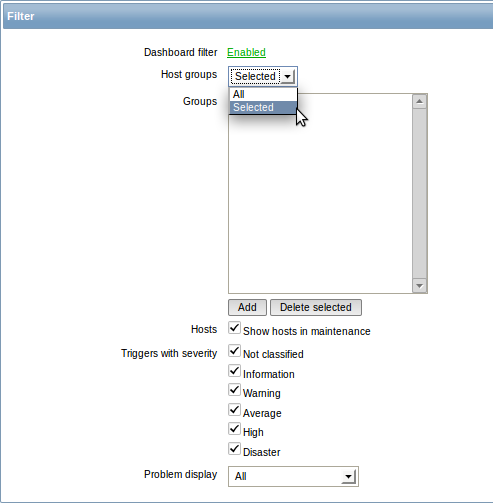
If you enable the filter by clicking on the very first link there, you can then limit what hosts, triggers and problems are displayed in the dashboard.