
1 仪表板
简介
访问方式 监测 → 仪表板 这里是监控信息的一个汇总。方便你快速总览当前全局监控状态。
仪表板是由多个小模块组成,可以有服务器信息、拓扑图、摘要、告警项、局和图形、时钟等模块进行组合展示。
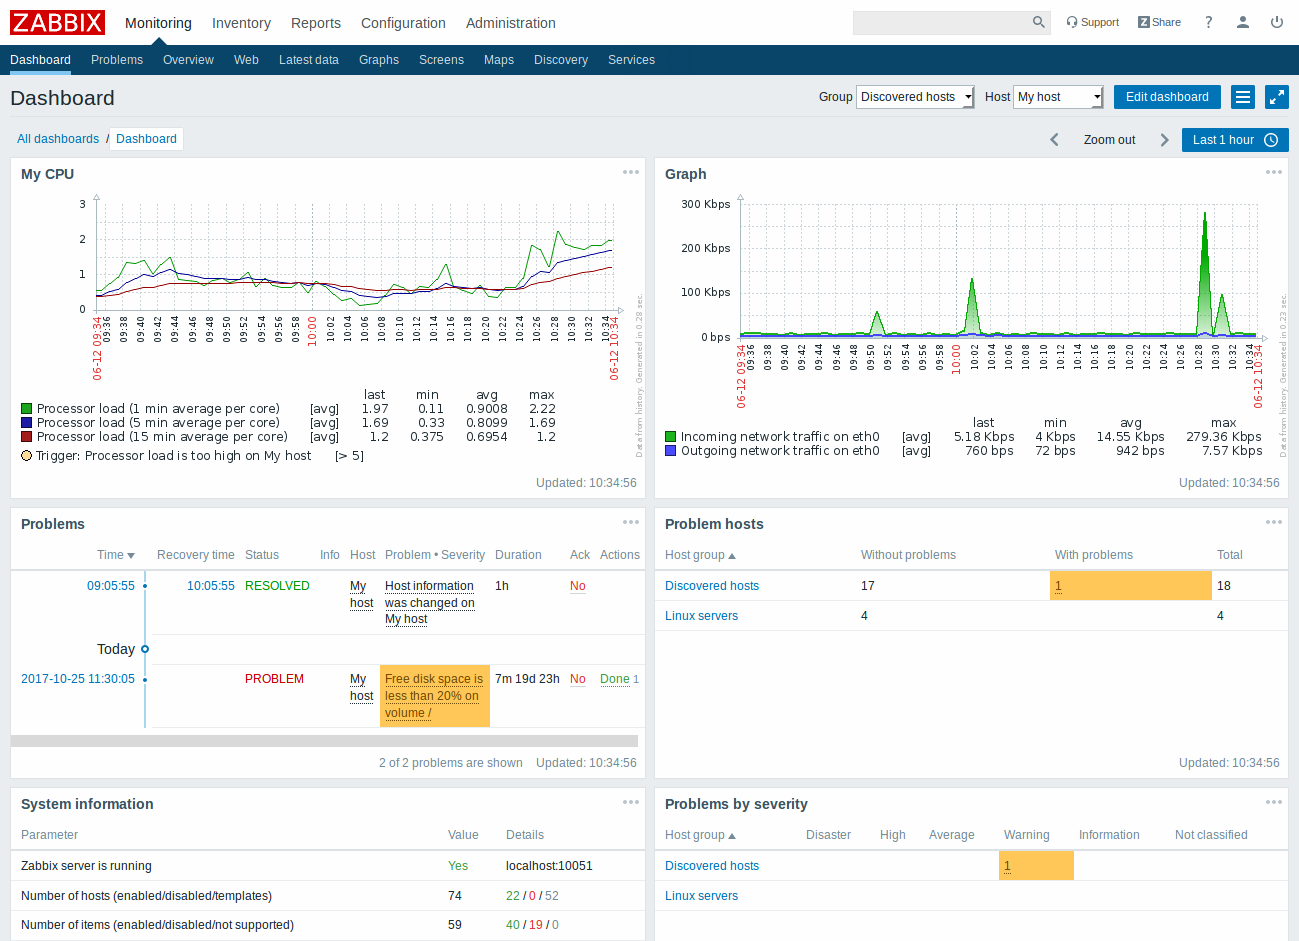
在仪表板编辑模式下可以添加和编辑窗口模块。 在仪表板查看模式下展示窗口模块。
在定义单个仪表板中,您可以对来自各种来源的模块进行分组以便快速浏览,同时你还可以创建包含不同模块、内容的多个仪表板并在它们之间切换。
仪表板展示的时间范围你可以通过右上角的时间控制器来进行选择 time period selector 单机时间控制器,来选择要查询的历史时间或者最近一段时间的数据。
提示:当使用仪表板的图形、局和图形等图形模块的时候,你可以通过双击、拉取等方式选取图形的时间展示周期,当你双击的时候会缩小显示时间范围,如果你需要选择摸个周期则可以直接拉取选取对应的时间段。
查看仪表板
要在访问或者管理已配置的所有仪表板时你需要这么操作 添加仪表板
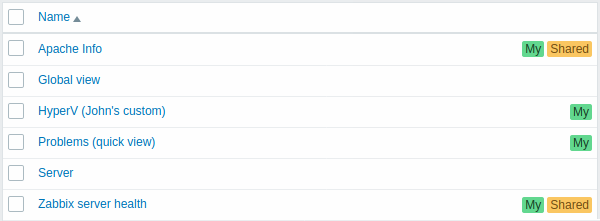
在仪表板列表中选择对应的仪表板连接。
如果你不在需要某个仪表板你同样可以在此界面单机左侧复选框选择 删除 按钮后进行删除。
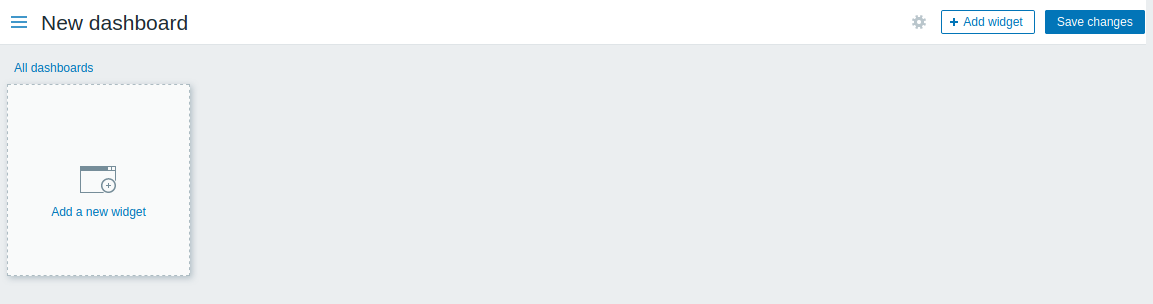
创建仪表板
如果想查看所有仪表板或者创建新的仪表板可以选择 添加仪表板 这个链接来创建或者管理新的仪表板:
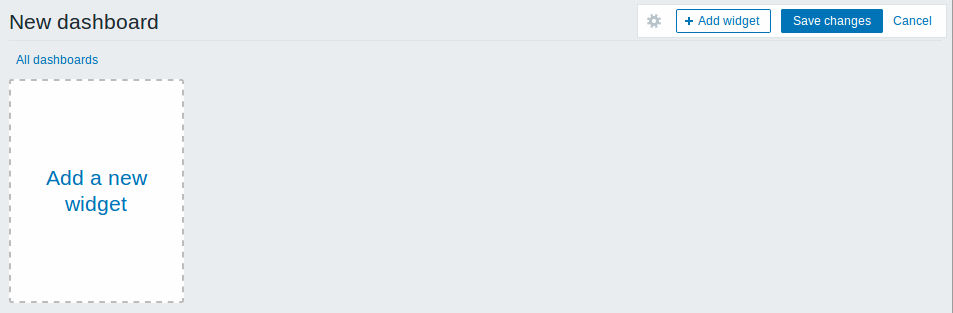
第一次访问的时候,仪表板为空,你可以通过以下两种方式创建新的仪表板:
- 单击右上角 添加新构件 按钮
- 单击页面左边 添加新构件 的连接
在弹出的选项框中单击 添加 即可创建新的仪表板. 如果你想取消创建可以选择 取消按钮来结束创建新的仪表板。
添加小构件
你可以通过以下方式添加小构件到仪表板:
- 单击选择 小构件 按钮或者链接并且选择小构件的类型
- 选择 类型
- 根据自己的需要填写小构件的相关参数
- 单击 添加
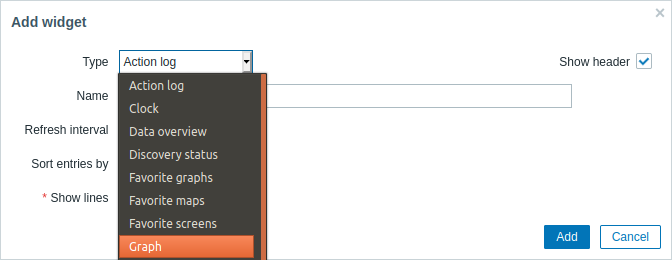
可以添加到仪表板的小构件类型有以下内容:
- Action log
- Clock
- Data overview
- Discovery status
- Favourite graphs
- Favourite maps
- Favourite screens
- Graph
- Problem hosts
- Map
- Map navigation tree
- Plain text
- Problems
- System information
- Problems by severity
- Trigger overview
- URL
- Web monitoring
在仪表板编辑模式中,可以通过单击小构件标题栏并将其拖动到新位置。 此外,您可以单击窗口小构件中的以下按钮:
 -
编辑构件;
-
编辑构件; -
删除构件;
-
删除构件;
单击 添加 来保存你刚刚在仪表板对小部件进行任何更改。
动态小构件
在 配置 一些小部件的时:
- 图形 (或者简单图形)
- 纯文本
- URL
还有一个特别的选项 动态监控项。 如果你勾选此项,便可以根据选择不同的主机展示不同的内容,或者持续展示更新最新的数据信息。
当你勾选动态监控后,在保存仪表板时,您会注意到仪表板上方出现了两个新的下拉列表,用于选择主机组/主机:

因此,您有一个窗口小构件,它可以显示基于下拉列表中所选主机的数据的内容。 这样做的好处是您不需要创建额外的小构件,例如,您希望看到包含来自不同主机的数据的相同图形。
查看或编辑仪表板
你可以通过以下选项查看单个仪表板:
 |
切换到编辑模式。 | |
 |
打开操作菜单。 | |
| Sharing | 编辑仪表板可以被哪些用户访问。\\默认的情况下所有用户都可以看到该仪表板。 私有仪表板默认仅能自己查看,当然你可以选择分享给其他用户或者组查看 如果你想了解更多分享的配置信息可以参考 配置 连接。 |
|
| Create new | 创建一个新的仪表板。 首先,系统会提示您输入新仪表板的常规属性 - 所有者和名称。 然后,新仪表板将以编辑模式打开,您可以添加小部件。 |
|
| Clone | 克隆并且创建一个新的仪表板 首先,系统会提示您输入新仪表板的常规属性 - 所有者和名称。 然后,新仪表板将以编辑模式打开,其中包含原始仪表板的所有小构件。 |
|
| Delete | 删除当前仪表板 | |
 |
全屏展示仪表板 | |
 |
在自助终端下显示仪表板. 这个模式仅展示小构件。 | |
编辑仪表板模式:
- 选择你要编辑的仪表板
- 选择按钮 编辑仪表板
在仪表板编辑模式中,可以使用以下选项:
 |
编辑常规仪表板属性 - 名称和所有者。 |
 |
添加新的小构件。 |
 |
保存更改。 |
 |
取消更改。 |
仪表板权限
从Zabbix 3.4.2以后,普通和Zabbix Admin用户的仪表板权限受到以下限制::
- 如果他们拥有READ权限,他们可以查看和克隆仪表板;
- 如果要编辑和删除仪表板需要READ以及WRITE的权限;
- 他们无法更改仪表板的所属用户.
在 Zabbix 3.4.2 之前管理员权限的用户不受到此规则限制。
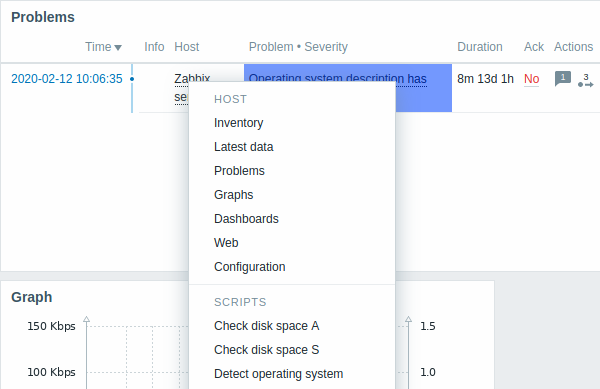
主机菜单
单击// 问题 //小构件中的主机将显示主机菜单。 它包含指向主机的自定义脚本,最新数据,触发器,库存,图形和屏幕的链接。
单击WEB前端中其他位置中的主机名,也可以访问此主机菜单。
- Monitoring → 问题(Problems)
- Monitoring → 问题(Problems) → 事件详情(Event details)
- Monitoring → 概述(Overview) (主机位置选择为左侧)
- Monitoring → 最新数据(Latest data)
- Monitoring → 聚合图形(Screens) (在 主机问题以及主机组问题 小构件)
- Monitoring → 拓扑图(Maps)
- Reports → 触发器TOP 100 (Triggers top 100)
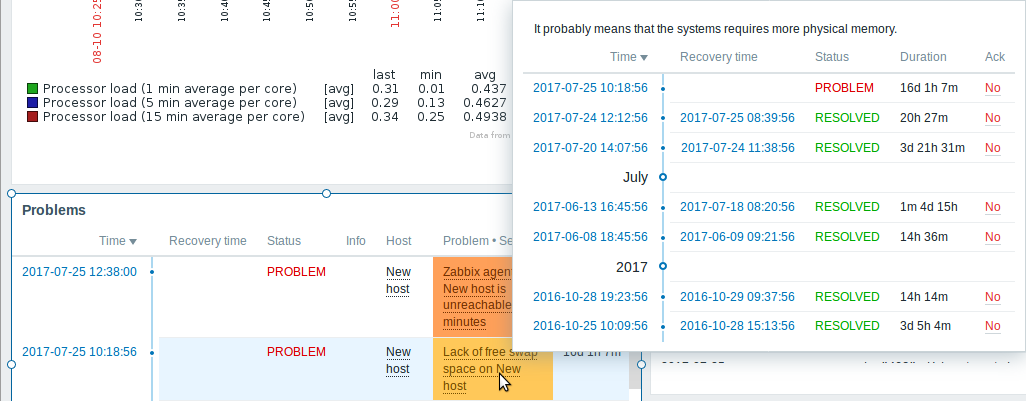
触发器弹出窗口
点击 近20个问题窗口中的问题(issue),会调出触发器事件弹出式菜单。它包括该事件的列表,事先定义好的触发器描述和可点击的URL。
Page menu
The page menu can be opened by clicking on the three dots
 next to the page name:
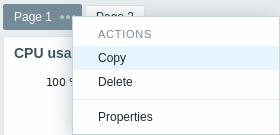
It contains the following options:
- Copy - copy the page
- Delete - delete the page (pages can only be deleted in the dashboard editing mode)
- Properties - customize the page parameters (the name and the page display period in a slideshow)
Widget menu
The widget menu contains different options based on whether the dashboard is in the edit or view mode:
| Widget menu | Options |
|---|---|
In dashboard edit mode: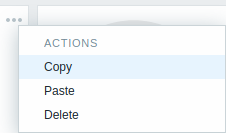 |
Copy - copy the widget Paste - paste a copied widget over this widget This option is grayed out if no widget has been copied. Delete - delete the widget |
In dashboard view mode: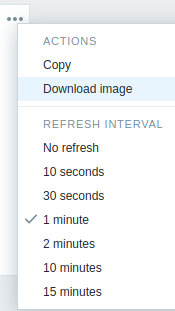 |
Copy - copy the widget Download image - download the widget as a PNG image (only available for graph/classic graph widgets) Refresh interval - select the frequency of refreshing the widget contents |
Dynamic widgets
When configuring some of the widgets:
- Graphs (simple and custom)
- Plain text
- URL
there is an extra option called Dynamic item. You can check this box to make the widget dynamic - i.e. capable of displaying different content based on the selected host.
Now, when saving the dashboard, you will notice that a new host selection field has appeared atop the dashboard for selecting the host (while the Select button allows selecting the host group in a popup):

Thus you have a widget, which can display content that is based on the data from the host that is selected. The benefit of this is that you do not need to create extra widgets just because, for example, you want to see the same graphs containing data from various hosts.
Permissions to dashboards
Permissions to dashboards for regular users and users of 'Admin' type are limited in the following way:
- They can see and clone a dashboard if they have at least READ rights to it;
- They can edit and delete dashboard only if they have READ/WRITE rights to it;
- They cannot change the dashboard owner.
Host menu
Clicking on a host in the Problems widget brings up the host menu. It includes links to host inventory, latest data, problems, graphs, dashboards, web scenarios and configuration. Note that host configuration is available for Admin and Superadmin users only.
Global scripts can also be run from the host menu. These scripts need to have their scope defined as 'Manual host action' to be available in the host menu.
The host menu is accessible by clicking on a host in several other frontend sections:
- Monitoring → Problems
- Monitoring → Problems → Event details
- Monitoring → Hosts
- Monitoring → Hosts → Web Monitoring
- Monitoring → Overview (on Hosts: left)
- Monitoring → Latest data
- Monitoring → Maps
- Reports → Triggers top 100
Problem event popup
The problem event popup includes the list of problem events for this trigger and, if defined, the trigger description and a clickable URL.
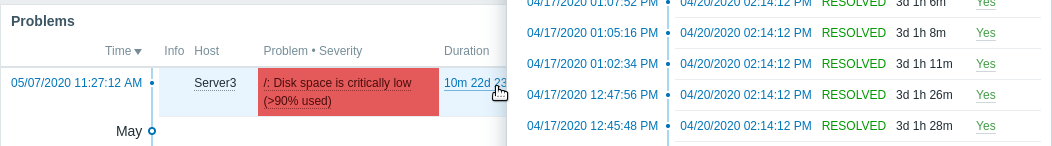
To bring up the problem event popup:
- roll a mouse over the problem duration in the Duration column of the Problems widget. The popup disappears once you remove the mouse from the duration.
- click on the duration in the Duration column of the Problems widget. The popup disappears only if you click on the duration again.
Resolved values of {ITEM.VALUE} and
{ITEM.LASTVALUE} macros in trigger descriptions are truncated to 20
characters. To see the entire values you may use macro
functions with these macros,
e.g. {{ITEM.VALUE}.regsub("(.*)", \1)},
{{ITEM.LASTVALUE}.regsub("(.*)", \1)} as a workaround.