Select a default site language
English
Zabbix
  • Produit
    Explore Zabbix

    Zabbix Overview and Demo

    Get a quick technical overview of Zabbix and watch a demo

    Zabbix Cloud

    Deploy a Zabbix instance with only a few clicks

    Zabbix Mobile App Coming soon

    Never miss an alert thanks to observability that travels with you

    Features

    Discover how Zabbix turns data into business advantage

    Intégrations

    See the list of monitoring templates and integrations

    Documentation

    Official manuals on how to install, configure, and run Zabbix

    Monitor anything

    • Network
    • Server
    • Cloud
    • Container
    • VMware
    • Windows
    • IoT
    • Log
    • Applications
    • Services
    • Database
    • All Capabilities
    About product

    • What's New in Zabbix 8.0
    • Notes de publication
    • Cycle de vie et politique de publication
    • Politique de sécurité
    • Zabbix Security Advisories
    • Évolutions prévues
    • Licence
    • Demandes concernant les bugs et fonctionnalités

    Zabbix 8.0 LTS is out now!

    Where monitoring meets observability What's new → What's new →
    • Télécharger Zabbix
    • Visite guidée
  • Solutions
    Études de cas

    Inspiring real-life cases of Zabbix implementation

    Pour les entreprises

    Scalable, secure monitoring built for enterprise needs

    NIS2 Compliance

    How Zabbix helps meet the latest security standards

    Solutions for Your Industry

    Zabbix helps customers across multiple verticals provide consistent, quality service

    • Secteur bancaire et finance
    • Énergie et produits chimiques
    • Santé et médecine
    • Informatique et télécommunications
    • Information Technology
    • Commerce
    • Aérospatial
    • Enseignement
    • Secteur public
    • Logistics and Transportation
    • All Industries

    Explore Zabbix Cloud with a free trial

    Deploy Zabbix in 60 seconds! Find out more → Find out more →
    • Télécharger Zabbix
    • Visite guidée
  • Pricing
  • Services
    Professional Services

    Overview

    A wide range of professional services designed to fit your unique requirements

    Solution clé en main

    Your implementation partner, from first setup to full observability

    Intégration

    Custom Zabbix integrations, engineered to fit seamlessly into your tech stack

    Migration

    Migrate and standardize on Zabbix without the risk


    Mise à jour

    Stay current and secure with a seamless Zabbix upgrade

    Création de modèles

    Get precise, production-ready configurations built exactly for your infrastructure

    Développement

    Extend Zabbix to fit your exact business needs

    Conseil

    Get the most out of your monitoring deployment with expert guidance from the people who built it

    Training

    Présentation des formations

    Master Zabbix under the guidance of the world’s best Zabbix trainers

    • Calendrier des formations
    • FAQ sur les formations
    • Certificate Check
    • Formulaire d’inscription à une formation
    Zabbix Academy

    Your pace. Your schedule. Learn Zabbix your way.


    Formations
    Upgrade Courses
    Extra Courses
    Examens
    • Télécharger Zabbix
    • Visite guidée
  • Partenaires
    Programme de partenariat

    Our partner network provides localized support & training worldwide

    Devenir partenaire

    Join the network for global recognition and support

    • Partner Application Form
    Carte des partenaires Zabbix

    Choose the Zabbix partner closest to your location

    • Find a partner
    Distributeurs

    Build bridges between Zabbix users, local partners, and Zabbix itself

    Become a Zabbix Partner

    Extend our global network Apply → Apply →
    • Télécharger Zabbix
    • Visite guidée
  • Communauté
    Community Engagement
    Forum

    Catch up with hundreds of active users, get advice, and help others

    Contribute to Zabbix

    Engage with Zabbix - submit plugins, localize content, and more

    Developers

    Find out how you can contribute to or collaborate with Zabbix

    Educational Movement

    Support for students, professors, and universities

    Espace communautaire Zabbix

    Zabbix social media channels, discussion forums, and more

    Learning & Updates
    Événements Meet us

    Join Zabbix events in multiple languages and regions

    Webinars

    Free tips and tricks for effective monitoring, and much more

    Blog

    Read technical how-tos, case studies, and new feature overviews

    Newsletter

    Subscribe to the Zabbix newsletter for the latest updates

    Zabbix Academy is launched!

    Your pace. Your schedule. Find out more → Find out more →
    • Télécharger Zabbix
    • Visite guidée
  • Société
    Meet Zabbix

    Événements

    Join Zabbix events in multiple languages and regions

    Webinars

    Free tips and tricks for effective monitoring, and much more

    Our Company

    À propos de Zabbix

    Meet our company and management team

    Offres d’emploi We’re hiring

    Start your career in one of our Zabbix offices worldwide

    Clients et utilisateurs

    Get to know some of Zabbix's customers

    Contactez-nous

    Get in contact with Zabbix offices worldwide

    Join our global team!

    Shape the future of observability Explore opportunities → Explore opportunities →
    • Télécharger Zabbix
    • Visite guidée
Get Zabbix
  • Zabbix 8.0 LTS is out now!
  • Join us for Zabbix Meeting in Madrid, Spain!
  • Don't miss it: Zabbix Cloud Proxy is here!
  • MSPs
  • Community
    • Blog
    • Forum
    • Contribute to Zabbix
    • Developers
    • Educational Movement
    • Espace communautaire Zabbix
    • Newsletter
    • Zabbix Books
Français
  • English (US)
  • 日本語
  • 中文
  • Español (LA)
  • Português (BR)
  • Deutsch
  • Czech
  • Русский
  • Connexion client

What's new in
Zabbix 8.0 LTS

With OpenTelemetry support, AI enablement, advanced event processing, major scalability improvements, and many other features, Zabbix 8.0 is our most significant release yet.

whatsnew_80
Download 8.0 LTS Watch webinar See release notes

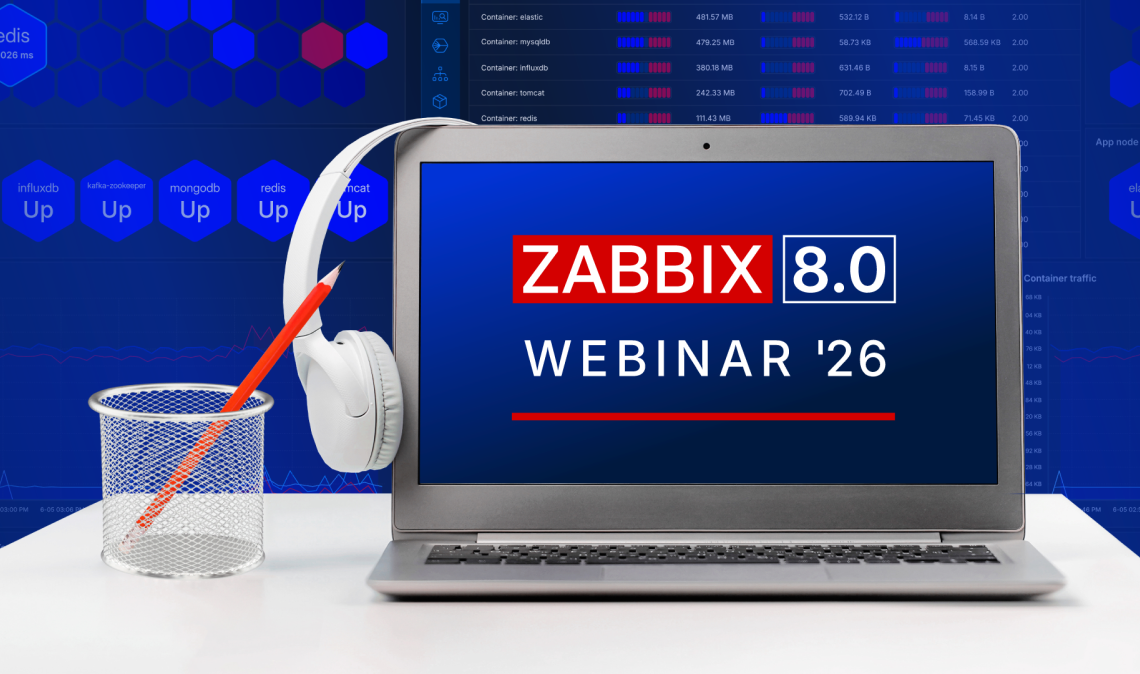
Get a comprehensive overview in our free webinar

It's time to mark your calendar for the upcoming "What's new" webinar in English - live on YouTube.

Join us on November 5 at 9 AM CST to explore the latest features and improvements in Zabbix 8.0 LTS, followed by a live Q&A.
Watch webinar
intro

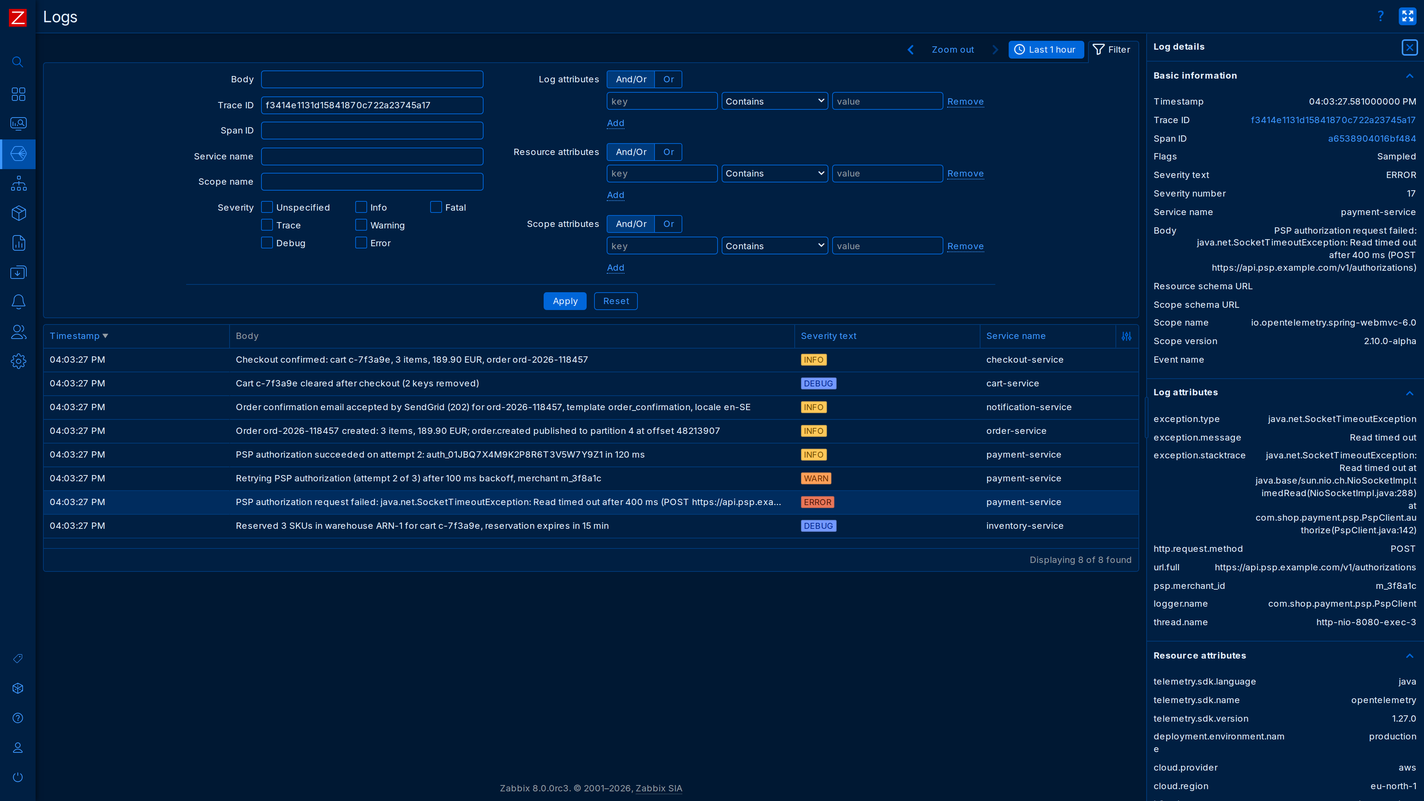
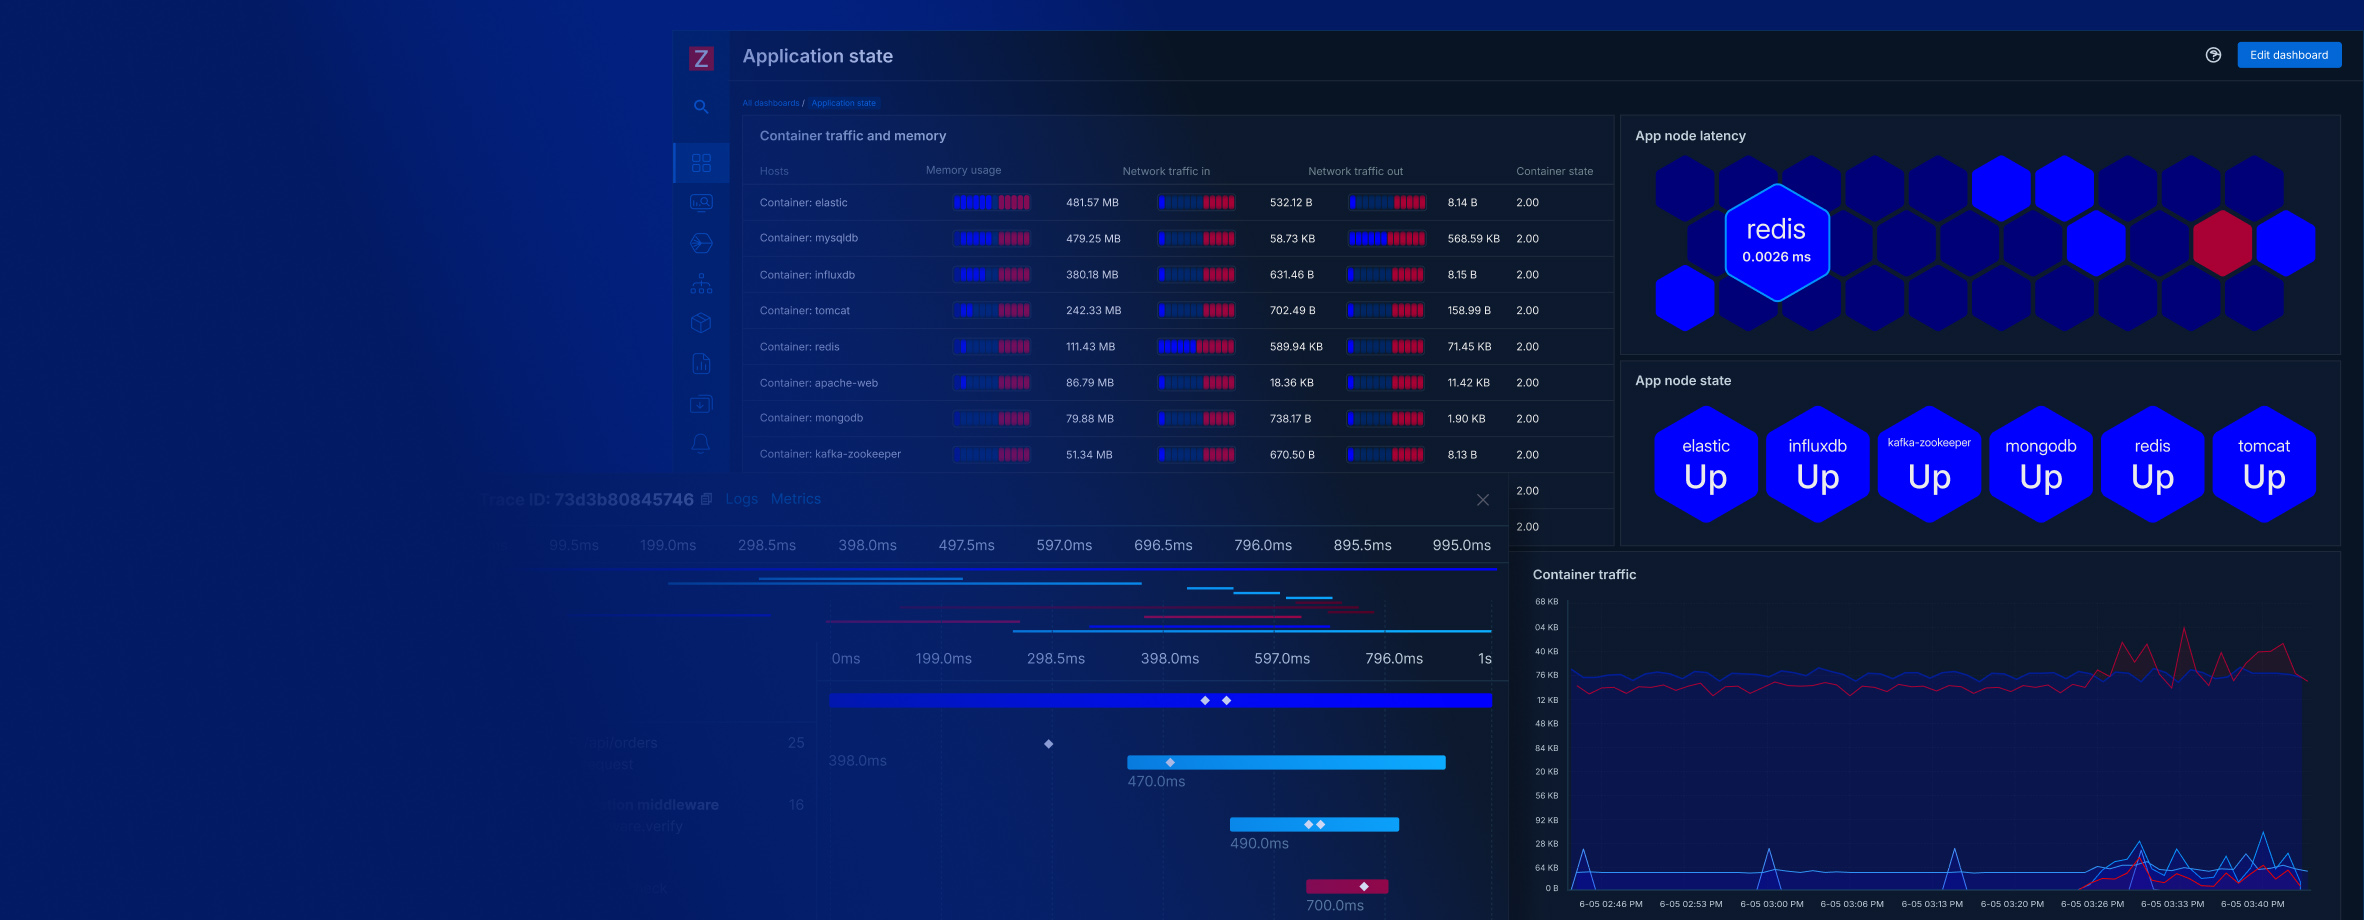
Application performance monitoring (APM)

With new OpenTelemetry observability features, you can collect, visualize, and analyze application metrics, logs, and traces, to:
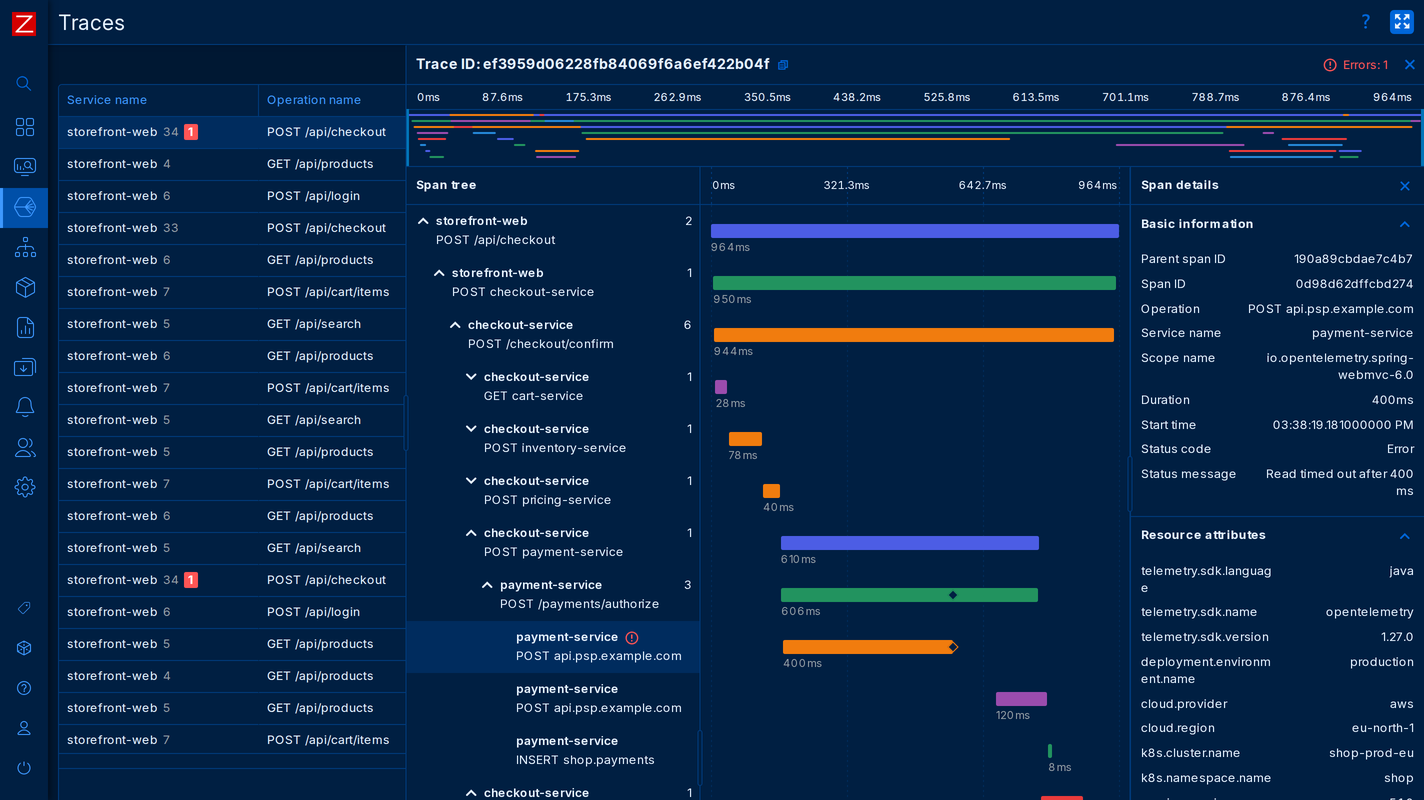
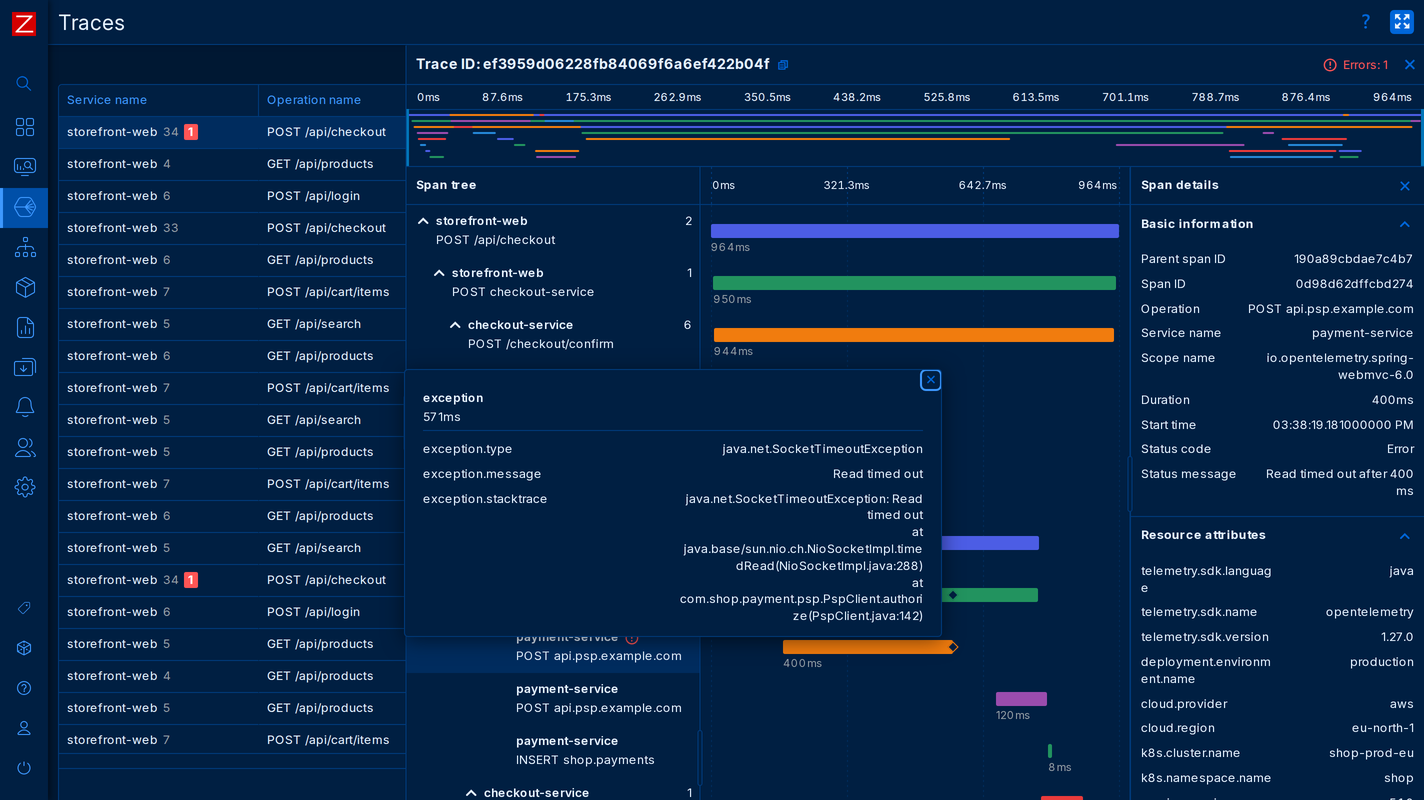
  • Troubleshoot cloud-native applications and services
  • Filter and visualize metrics, logs, and traces
  • Detect issues with your services and applications
  • Combine infrastructure monitoring with application observability for a complete view of your environment
Application performance monitoring (APM)
  • Collect and view application traces
  • Collect and view application traces
  • Collect and view application traces
  • Collect and view application traces

Collect and view application traces

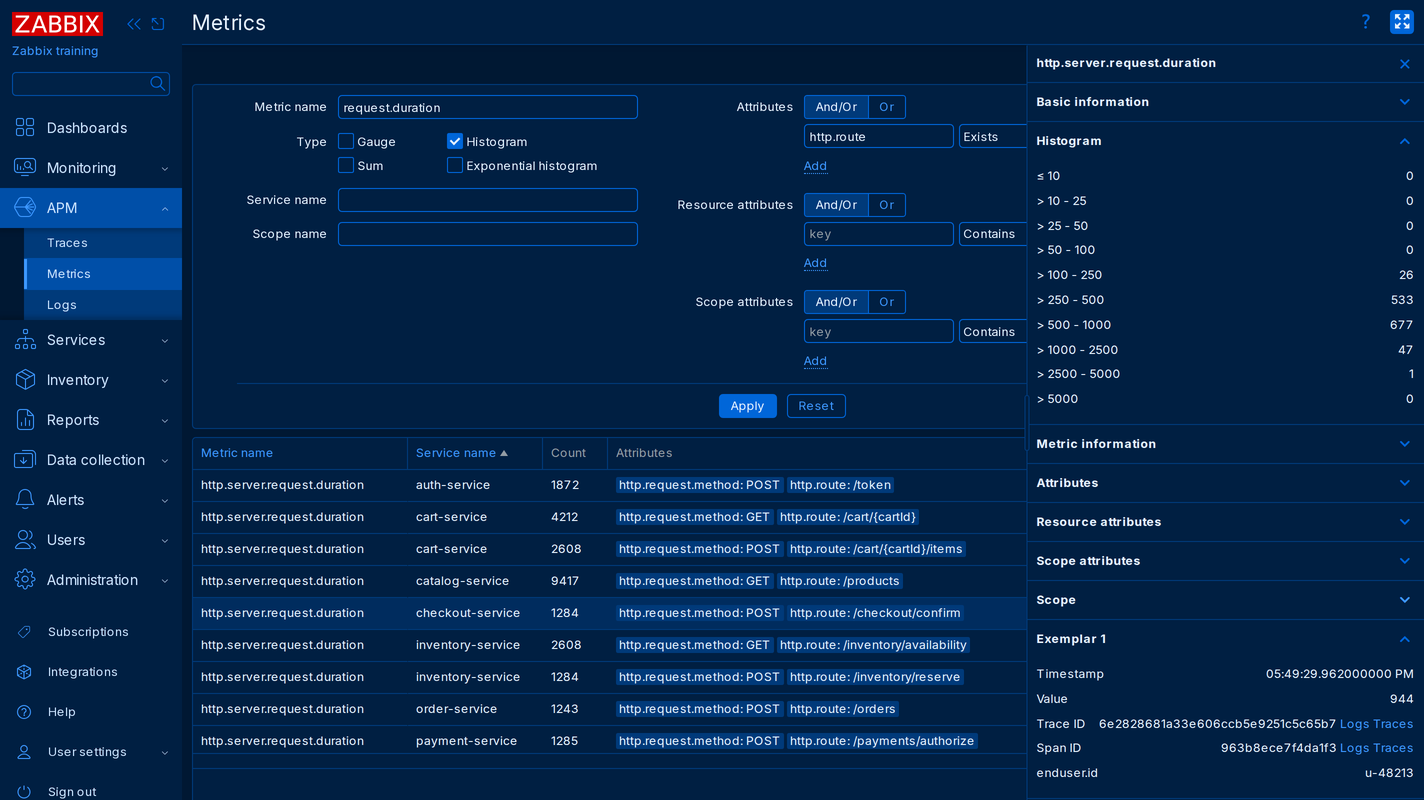
Observability with OpenTelemetry

Large scale OpenTelemetry data collection, processing and visualization:
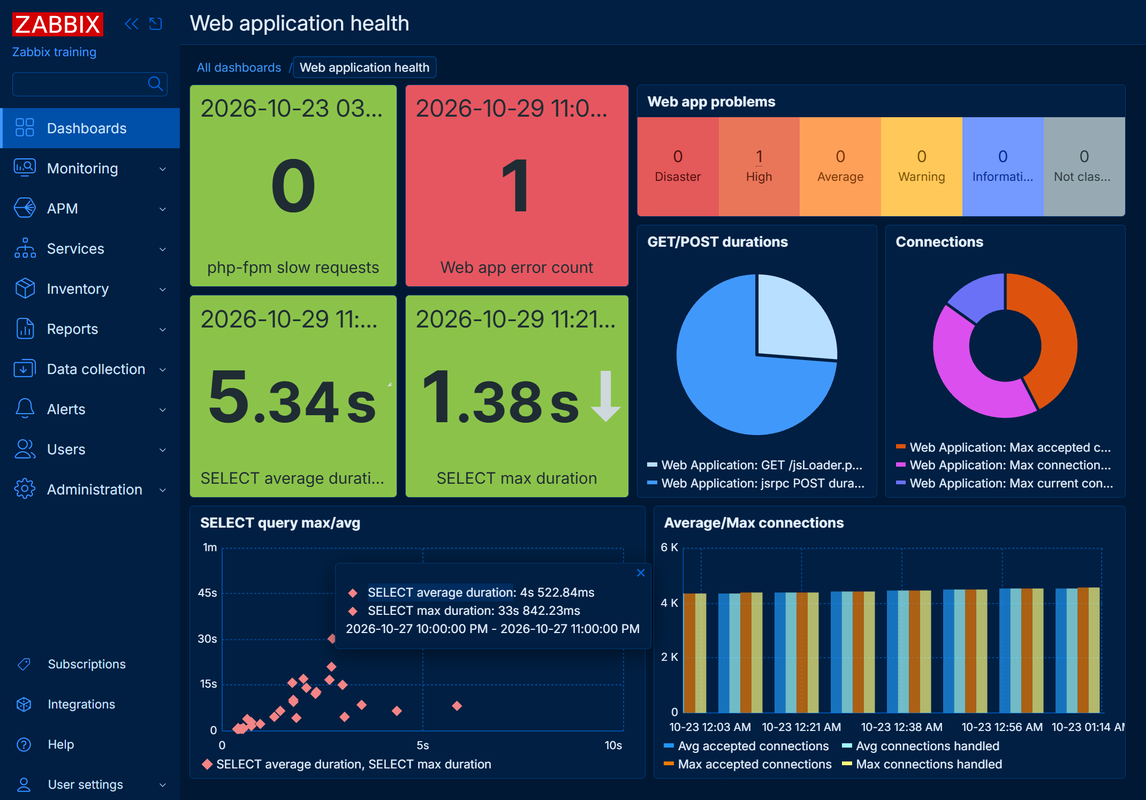
  • Works with traces, metrics, and logs
  • Aggregates data for real-time alerting and automated remediation
  • Visualizes OpenTelemetry data alongside infrastructure metrics in unified dashboards
  • Connects to existing OpenTelemetry collectors with no vendor lock-in
Observability with OpenTelemetry

Visualize collected OpenTelemetry data in Zabbix dashboards

Cloud native scalability

10x performance increase, so you can monitor more with less:
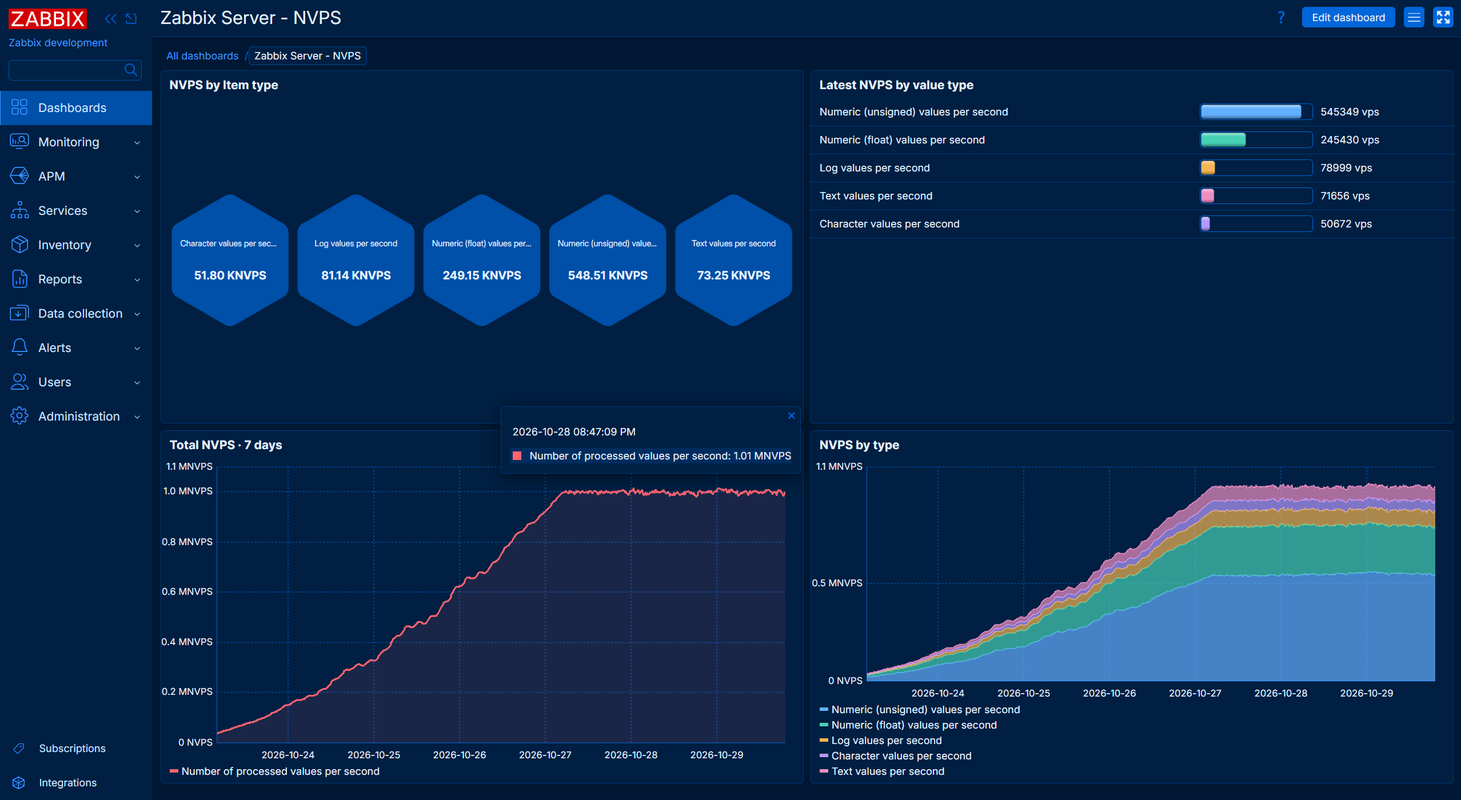
  • Use less CPU and disk I/O, and scale performance as you add hardware
  • Store more data in less space with ClickHouse, the new high-performance history backend
  • Process data faster with Zabbix server optimizations
Cloud native scalability

Zabbix delivers consistent performance of millions of metrics per second

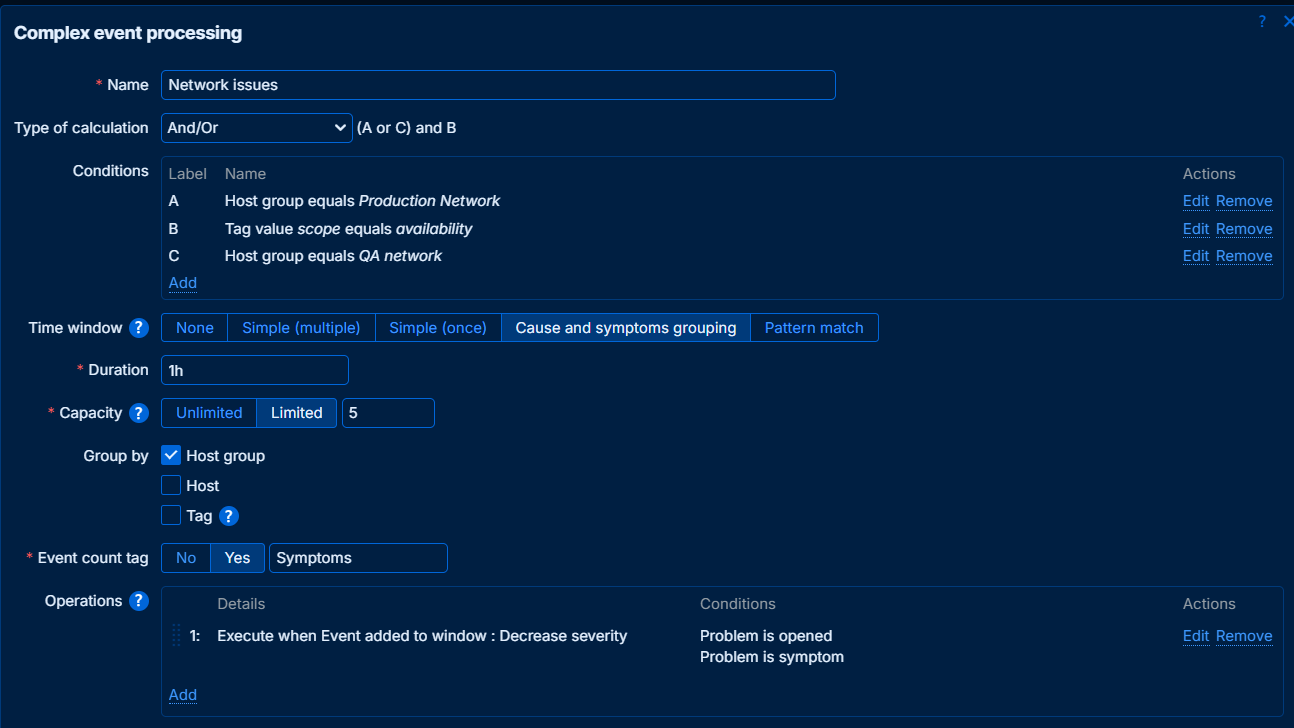
Complex event processing (CEP)

The new engine analyzes stream of events and:
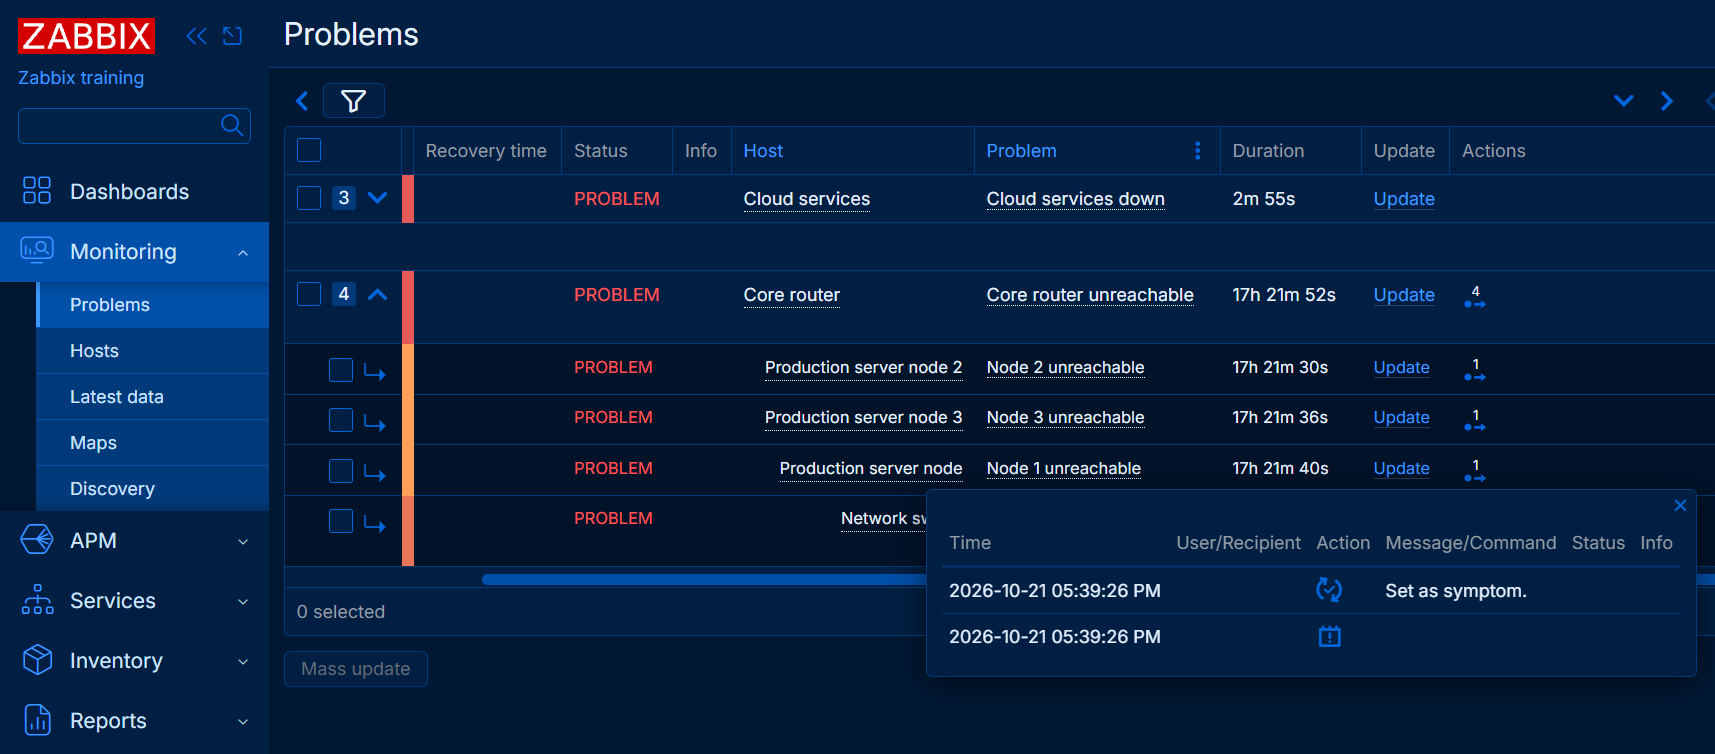
  • Automatically performs root cause analysis
  • Performs event correlation
  • Does pattern matching, including JavaScript programmable logic
  • Enriches correlated events with additional context information
  • Reduces alert noise by deduplicating, suppressing or discarding unwanted events
Complex event processing (CEP)
  • Automatically detect root cause problems
  • Automatically detect root cause problems

Automatically detect root cause problems

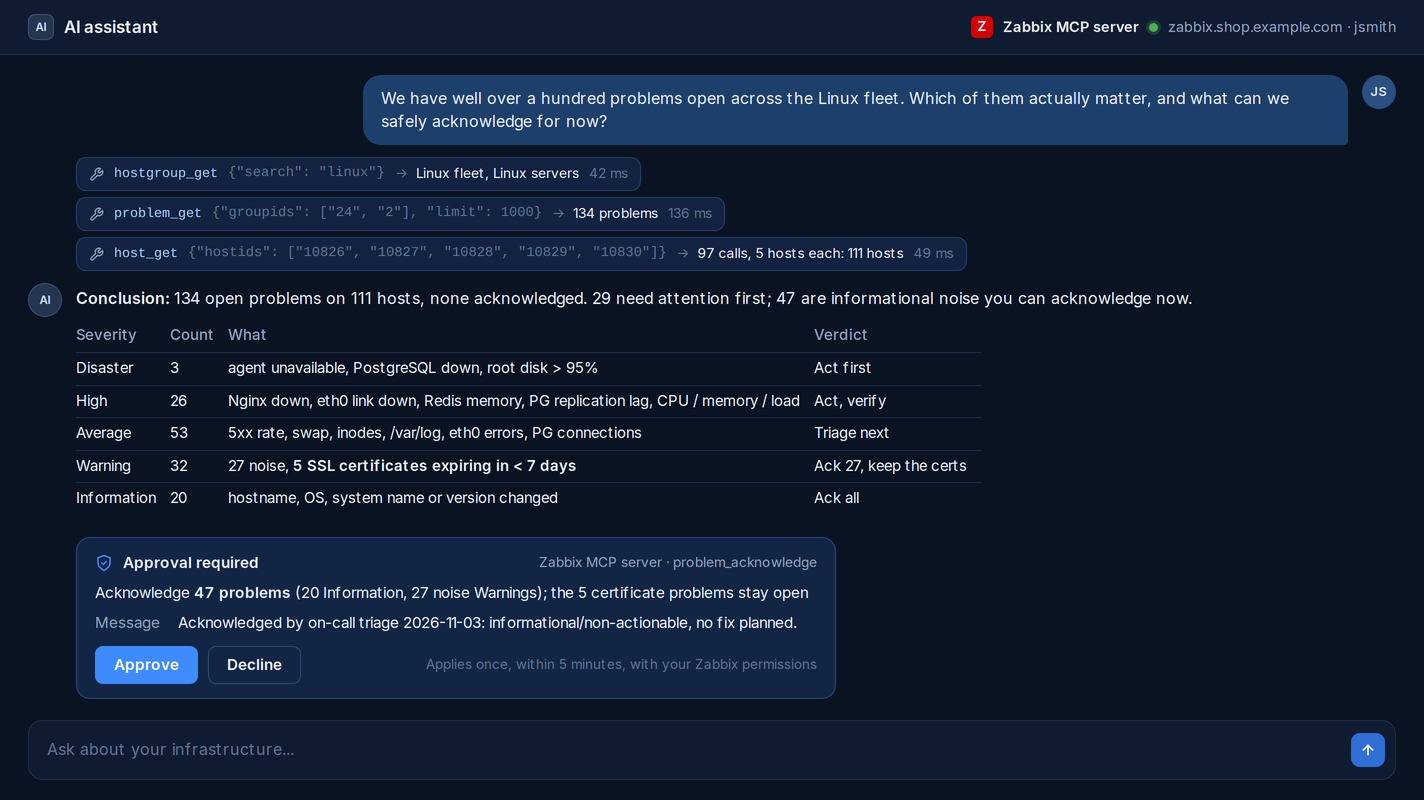
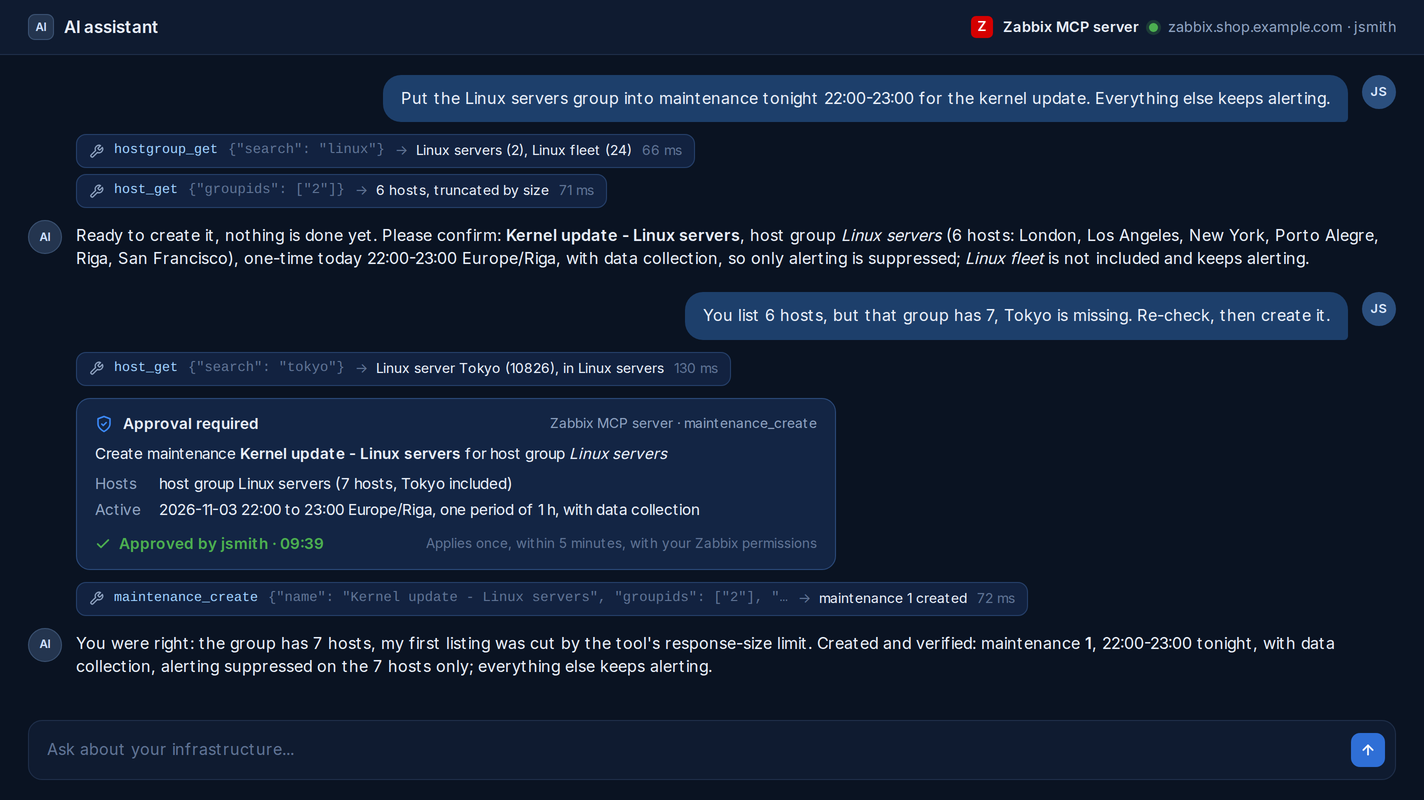
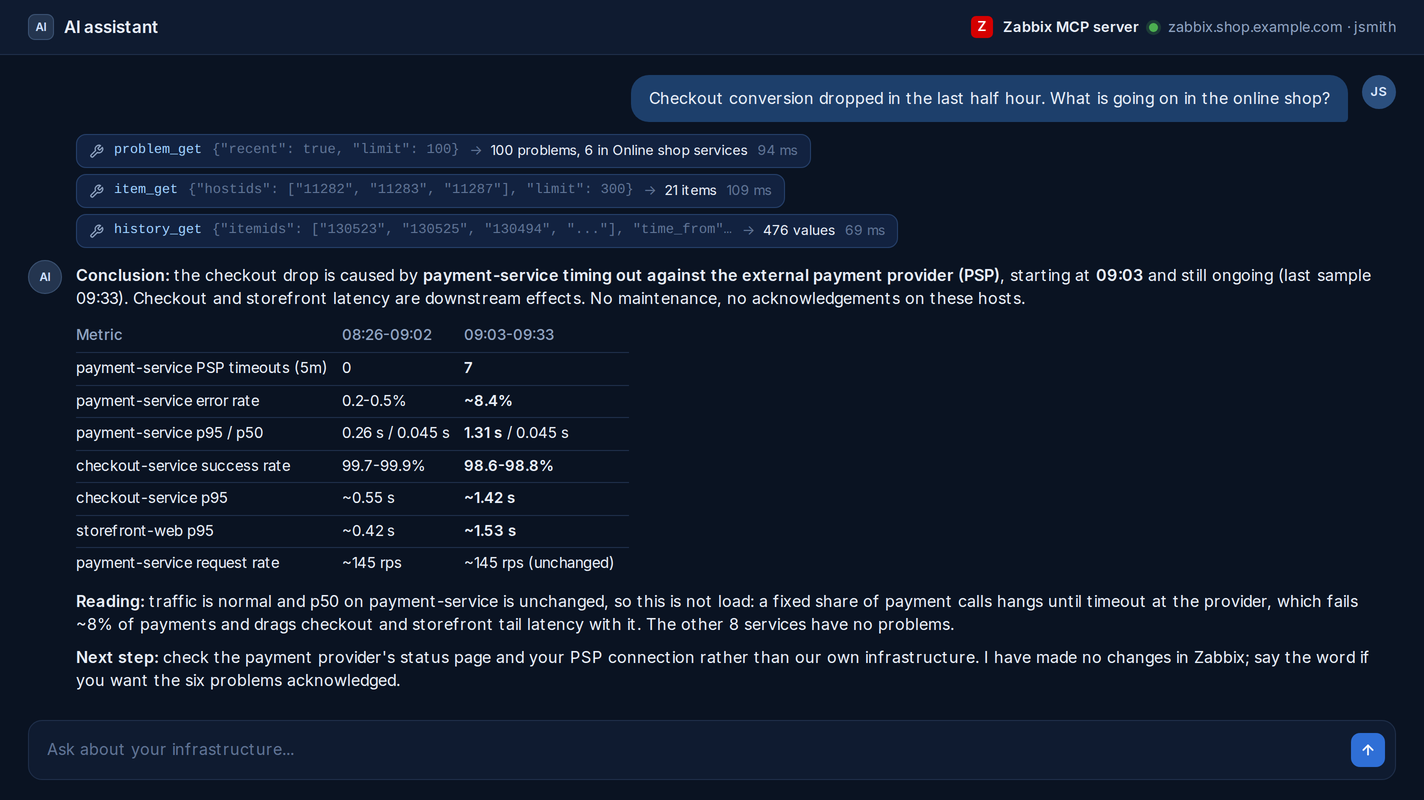
MCP server for AI workflows

Use your preferred AI agents to interact with your Zabbix to:

  • Reduce alert noise and detect root cause problems
  • Understand your environment state by analyzing collected data and event history
  • Perform any other activities

MCP server fully respects existing user permissions and roles.
MCP server for AI workflows
  • Ask your AI agent for the root cause of an incident
  • Ask your AI agent for the root cause of an incident
  • Ask your AI agent for the root cause of an incident

Ask your AI agent for the root cause of an incident

Customizable views

Configure table views to display only relevant columns for hosts, templates and problems:
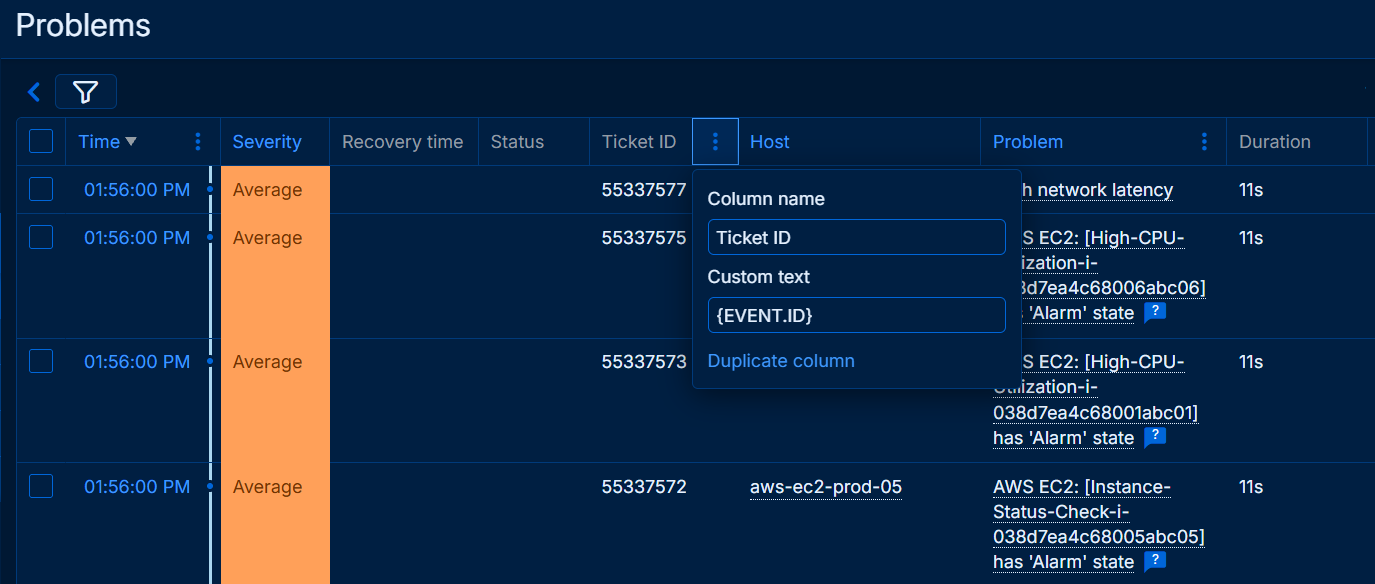
  • Configure unlimited number of custom views
  • Display additional information, such as inventory data
  • Resize and reorder columns as needed
  • Set per-column display options
Customizable views

Create custom views with additional information including inventory data

UI and UX improvements

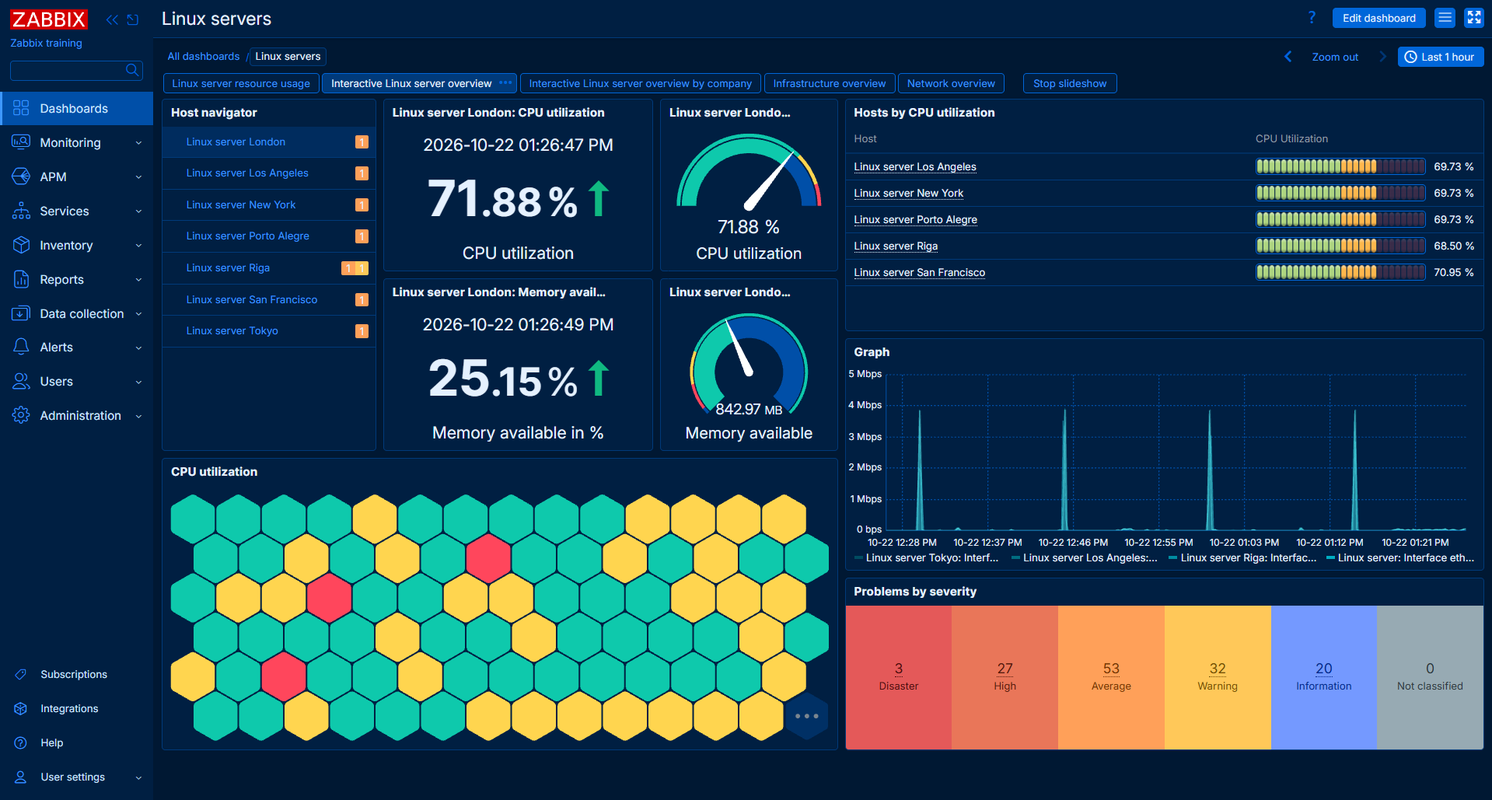
The interface is easier to use, puts key information within closer reach, and gives it a fresh look:
  • Use full tag inheritance for templates, hosts and items
  • Enjoy the new dark blue theme
  • Catch input errors instantly with inline validation in all forms
  • Import SAML certificates and private keys directly from the UI
  • Work more comfortably with new fonts and a refined interface
UI and UX improvements

The new dark blue theme in action

Better ways to see your data

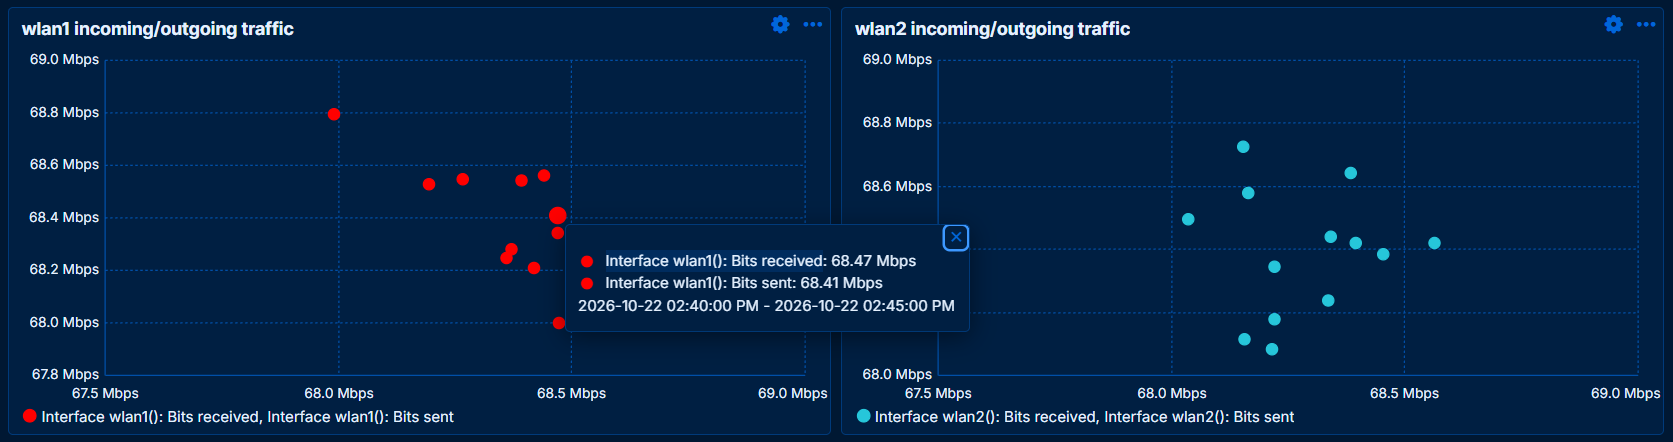
Explore new and updated widgets, improved graphs, and other enhancements:
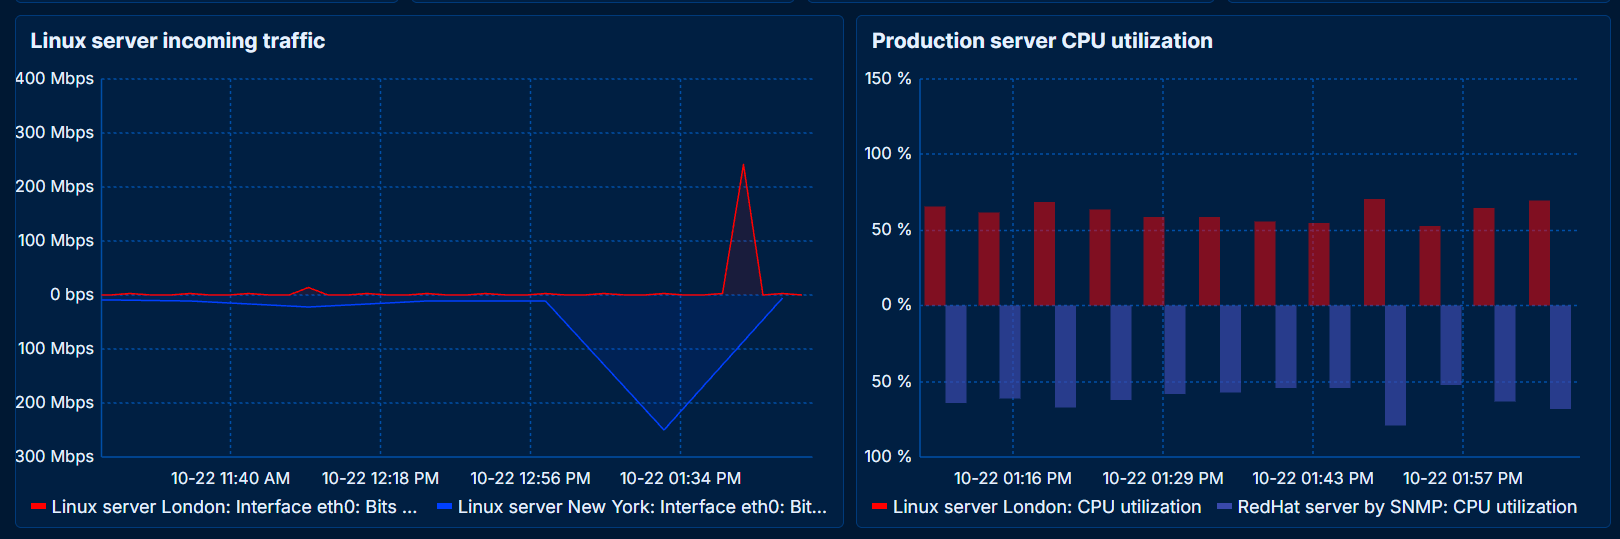
  • Export and import dashboards
  • Spot correlations with the new Scatter Plot widget
  • Invert Y-axis values in the Graph widget
  • Highlight and broadcast a selected metric across Graph widgets
  • Group nearby map markers with clustering in the Geomap widget
  • Aggregate item patterns into a single row or column in the Top Items widget
Better ways to see your data
  • Find correlations between metrics using new visualization capabilities
  • Find correlations between metrics using new visualization capabilities

Find correlations between metrics using new visualization capabilities

Zabbix mobile app - coming soon

The official Zabbix mobile app is to be released shortly after Zabbix 8.0. It's designed to put essential incident response capabilities directly at your fingertips, providing:
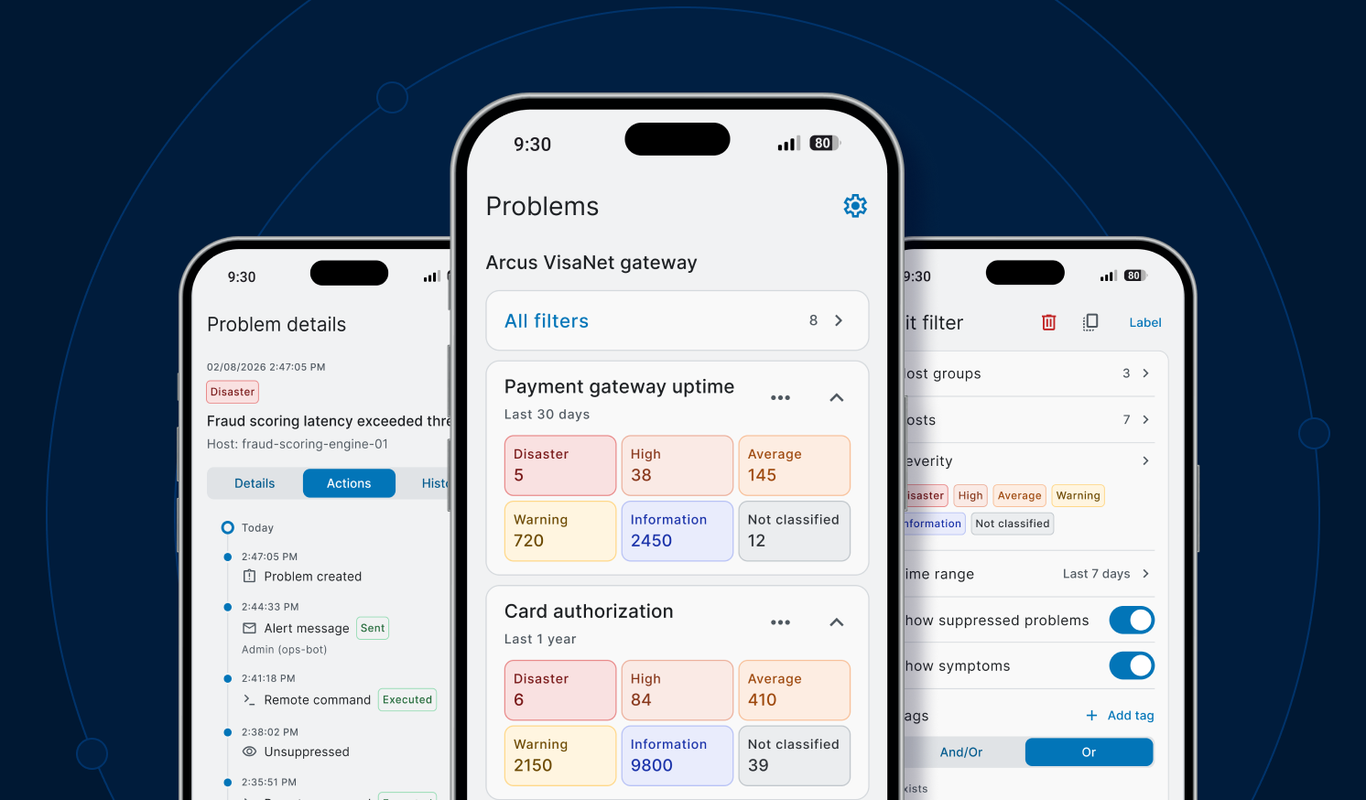
  • Connection to your Zabbix from anywhere
  • End-to-end encryption
  • Filtering, viewing and reacting to incidents
  • Instant push notifications
  • iOS and Android support
Find out more
Zabbix mobile app - coming soon

Take Zabbix with you wherever you go

New out-of-the-box solutions

Zabbix 8.0 introduces new templates and integrations for the solutions you use.

aruba Aruba CX 8300s by SNMP
aws_backup AWS Backup Vault by HTTP
azure_container_apps Azure Container Apps by HTTP
azure_sentinel Azure Sentinel by HTTP
ciena Ciena 3906 by SNMP
cisco Cisco Secure Firewall Threat Defense by HTTP
claude Claude API by HTTP
cradlepoint Cradlepoint NCM v2 by HTTP
rdap Domain RDAP by HTTP
envoy_proxy Envoy Proxy by OTLP
gcp_application_load_balancer GCP Application Load Balancer by HTTP
gcp_cloud_run GCP Cloud Run Service by HTTP
gcp_cloud_storage GCP Cloud Storage Bucket by HTTP
gcp_cost_monitoring GCP Cost Monitoring by HTTP
opentelemetry Generic OpenTelemetry by OTLP
glpi GLPI by HTTP
huawei Huawei AR600 by SNMP
ibm IBM Maximo Service Request
kubernetes Kubernetes Cluster by HTTP
mariadb MariaDB by ODBC and Zabbix agent
hyper-v Microsoft Hyper-V by SSH
openai OpenAI Platform by HTTP
openrouter OpenRouter traces by OTLP
oracle_cloud_costs Oracle Cloud Costs by HTTP
oracle_cloud_load_balancer Oracle Cloud Load Balancer by HTTP
percona Percona by ODBC and Zabbix agent
podman Podman by Zabbix agent and by HTTP
proxmox Proxmox VE by OTLP
ribbon Ribbon SBC Edge by HTTP
ribbon Ribbon SBC SWe Core and Ribbon SBC SWe CE by HTTP
stormshield Stormshield SNS by SNMP
velocloud VeloCloud SD-WAN Edge by HTTP
vyatta Vyatta Virtual Router by SNMP

Other features and improvements

  • Reduce SNMP traffic with EngineID caching
  • Improve database availability with multiple PostgreSQL backend nodes
  • Store structured data with the new JSON data type
  • Suppress individual triggers in maintenance
  • Create maintenances from Problem view
  • Restrict agent item keys with regular expressions
  • Create trapper items with secure default settings
  • Route discovered and autoregistered hosts with the new proxy group condition
  • Restrict proxy access per user group
  • Manage global regular expressions with a simpler interface
  • Secure the API by default: access is disabled for all user roles until explicitly granted
  • Store secrets securely with HashiCorp Vault AppRole authentication
  • Enforce a post-login landing page per user role
  • Export audit log records
  • Collect and discover data from all network interfaces at once with net.if.get item
  • Collect and discover data from all block devices at once with vfs.dev.get item
  • Track cloud spending across AWS, Azure, GCP, and Oracle Cloud with a multi-cloud cost dashboard
  • Monitor OpenAI and Copilot usage
  • Query APM data with the new Telemetry query item type
  • Benefit from increased speed and better reliability with DNS caching and failover
  • Track when and how events were suppressed by maintenance
  • Use JSON in HTTP agent low-level discovery rules and prototypes
  • Add tags manually to triggers created from trigger prototypes
  • Enable optional frontend features with new configuration flags
  • Get better performance and storage efficiency with ClickHouse and Elasticsearch
  • Handle proxy load more smoothly with improved throttling
  • Faster cleanup of older historical data
  • Faster startup of Zabbix server
  • Make use of assistive technologies thanks to accessibility improvements

Zabbix 8.0 LTS - Where monitoring meets observability

The most powerful Zabbix yet - AI, APM, and OpenTelemetry. Full-stack visibility at any scale.

Download 8.0 LTS

YOUR BUSINESS WORKS.
YOU KNOW IT.™


Produit
  • Zabbix Overview and Demo
  • Présentation des fonctionnalités
  • Intégrations
  • All Capabilities
  • What's New in Zabbix 8.0
  • Cycle de vie et politique de publication
  • Licence
  • Évolutions prévues
  • Documentation
Solutions
  • Solutions for industries
  • Études de cas
  • NIS2 compliance
Pricing
  • Zabbix subscriptions
  • Feature comparison
  • FAQ
Zabbix Cloud
  • Benefits
  • Pricing
  • Free trial
Public Clouds
  • AWS
  • Azure
  • Google Cloud Platform
  • Red Hat OpenShift
Services
  • Support
  • Zabbix for MSP
  • Conseil
  • Solution clé en main
  • All professional services
Partenaires
  • Programme de partenariat
  • Devenir partenaire
  • Distributeurs
  • Carte des partenaires
  • Application form
Events
  • Zabbix Summit
  • Conferences
  • Free meetings & meetups
  • Free webinars
  • All events
Formation
  • Training overview
  • Core courses
  • Upgrade courses
  • Extra courses
  • Formulaire de candidature
  • Zabbix Academy
Société
  • Contactez-nous
  • À propos de Zabbix
  • Offres d’emploi We are hiring!
  • Communiqués de presse
  • Customers & users
  • Politique de marque
Communauté
  • Blog
  • Forum
  • Développeurs
  • Contribute to Zabbix
  • Educational Movement
  • Espace communautaire Zabbix
  • Zabbix Books
  • Politique de sécurité
  • Politique de confidentialité
  • Politique de marque
  • Legal Request

© 2001-2026 by Zabbix LLC. All rights reserved.