Выберите язык сайта по-умолчанию
English
Zabbix
  • Продукт
    Открыть для себя Zabbix

    Обзор и демо Zabbix

    Познакомьтесь с Zabbix: краткий технический обзор и демо

    Zabbix Cloud

    Запустите Zabbix в несколько кликов

    Zabbix Mobile App Совсем скоро

    Будьте на связи с оповещениями всегда и везде

    Функции Zabbix

    Узнайте, как Zabbix собирает, обрабатывает и визуализирует данные

    Интеграции

    Изучите список шаблонов мониторинга и интеграций

    Документация

    Руководство по установке, настройке и запуску Zabbix

    Возможности

    • Network
    • Server
    • Cloud
    • Container
    • VMware
    • Windows
    • IoT
    • Log
    • Applications
    • Services
    • Database
    • Все возможности
    О продукте

    • Что нового в Zabbix 8.0
    • Заметки о выпуске
    • Жизненный цикл и политика релизов
    • Политика безопасности
    • Советы по безопасности и CVE
    • План развития
    • Лицензия
    • Баги и новая функциональность

    Zabbix 8.0 LTS is out now!

    Where monitoring meets observability What's new → What's new →
    • Скачать Zabbix
    • Обзор продукта
  • Решения
    Опыт клиентов

    Вдохновляющие примеры внедрения Zabbix другими компаниями

    Крупные инфраструктуры

    Zabbix - решение корпоративного уровня, оптимизированное для высокой производительности и безопасности

    Соответствие NIS2

    Как Zabbix помогает соответствовать актуальным стандартам безопасности

    Решения для вашей отрасли

    Zabbix помогает компаниям из разных отраслей обеспечивать стабильно высокое качество сервиса

    • Банки и финансы
    • Химическая и Энергетика
    • Здравоохранение
    • IT и Телекоммуникации
    • Информационные технологии
    • Торговля
    • Аэрокосмическая
    • Образование
    • Госуправление
    • Логистика и транспорт
    • Все отрасли

    Бесплатный триал Zabbix Cloud

    Разверните Zabbix быстро и просто! Узнать больше → Узнать больше →
    • Скачать Zabbix
    • Обзор продукта
  • Стоимость
  • Услуги
    Профессиональные услуги

    Все услуги

    Широкий выбор профессиональных услуг - от консалтинга до решения "под ключ"

    Решения «под ключ»

    Ваш партнёр по внедрению — от первоначальной настройки до полной наблюдаемости

    Услуги интеграции

    Интеграции Zabbix, точно спроектированные под ваш технологический стек

    Миграция

    Безрисковая миграция и стандартизация на Zabbix


    Обновление

    Актуальная версия, максимальная защита — обновите Zabbix без лишних сложностей

    Создание шаблонов

    Готовые к продакшену конфигурации, точно спроектированные под вашу инфраструктуру

    Услуги разработки

    Адаптируйте Zabbix под конкретные потребности вашего бизнеса

    Консалтинг

    Раскройте весь потенциал вашего мониторинга с экспертной поддержкой от команды, которая его создала

    Обучение

    Обзор курсов

    Освойте мониторинг с Zabbix под руководством опытного тренера

    • Расписание
    • Часто задаваемые вопросы
    • Проверка сертификата
    • Записаться на курс
    Академия Zabbix

    Ваш темп. Ваше расписание. Ваш путь к Zabbix.


    Курсы
    Курсы повышения квалификации
    Спецкурсы
    Экзамены
    • Скачать Zabbix
    • Обзор продукта
  • Партнёры
    Партнёрская программа

    Партнерская сеть, обеспечивающая поддержку и обучение по всему миру

    Станьте партнёром

    Присоединяйтесь и получите международно признанный статус и поддержку от Zabbix

    • Заявка на партнёрство
    Карта партнёров

    Используйте геокарту, чтобы найти ближайшего партнера Zabbix

    • Найти партнёра
    Дистрибьютеры

    Поддержка Zabbix в укреплении позиций компании на новых рынках

    Станьте партнёром Zabbix

    Расширьте нашу глобальную сеть Подать заявку → Подать заявку →
    • Скачать Zabbix
    • Обзор продукта
  • Сообщество
    Community Engagement
    Форум

    Присоединяйтесь к сотням активных пользователей, учитесь и помогайте другим

    Внести вклад в Zabbix

    Engage with Zabbix - submit plugins, localize content, and more

    Разработчики

    Узнайте, как вы можете сделать вклад в разработку Zabbix

    Образовательное движение

    Support for students, professors, and universities

    Сообщество

    Общайтесь с сообществом и совершенствуйте свои знания о Zabbix

    Learning & Updates
    Мероприятия Meet us

    Участвуйте в онлайн и офлайн мероприятиях Zabbix на разных языках

    Вебинары

    Присоединяйтесь к бесплатным вебинарам на разных языках на разные темы о Zabbix

    Блог

    Читайте технические инструкции, примеры из практики и обзоры новых функций

    Новостная рассылка

    Подпишитесь на рассылку новостей Zabbix и будьте в курсе последних событий.

    Zabbix Academy is launched!

    Your pace. Your schedule. Find out more → Find out more →
    • Скачать Zabbix
    • Обзор продукта
  • Компания
    Политики и медиа

    Мероприятия

    Участвуйте в онлайн и офлайн мероприятиях Zabbix на разных языках

    Вебинары

    Присоединяйтесь к бесплатным вебинарам на разных языках на разные темы о Zabbix

    О компании

    О нас

    Познакомьтесь с компанией Zabbix и руководящим составом

    Вакансии We’re hiring

    Начните свою карьеру в Zabbix

    Клиенты и пользователи

    Получите информацию о клиентах Zabbix

    Напишите нам

    Свяжитесь с офисами Zabbix по всему миру

    Присоединяйтесь к глобальной команде Zabbix!

    Вместе мы создаём будущее мониторинга Смотреть вакансии → Смотреть вакансии →
    • Скачать Zabbix
    • Обзор продукта
Get Zabbix
  • Zabbix 8.0 LTS is out now!
  • Join us for Zabbix Meeting in Madrid, Spain!
  • Don't miss it: Zabbix Cloud Proxy is here!
  • MSPs
  • Сообщество
    • Блог
    • Форум
    • Внести вклад в Zabbix
    • Разработчики
    • Образовательное движение
    • Сообщество
    • Новостная рассылка
    • Zabbix Books
Русский
  • English (US)
  • 日本語
  • 中文
  • Español (LA)
  • Português (BR)
  • Deutsch
  • Français
  • Czech
  • Вход для клиентов

What's new in
Zabbix 8.0 LTS

With OpenTelemetry support, AI enablement, advanced event processing, major scalability improvements, and many other features, Zabbix 8.0 is our most significant release yet.

whatsnew_80
Download 8.0 LTS Watch webinar See release notes

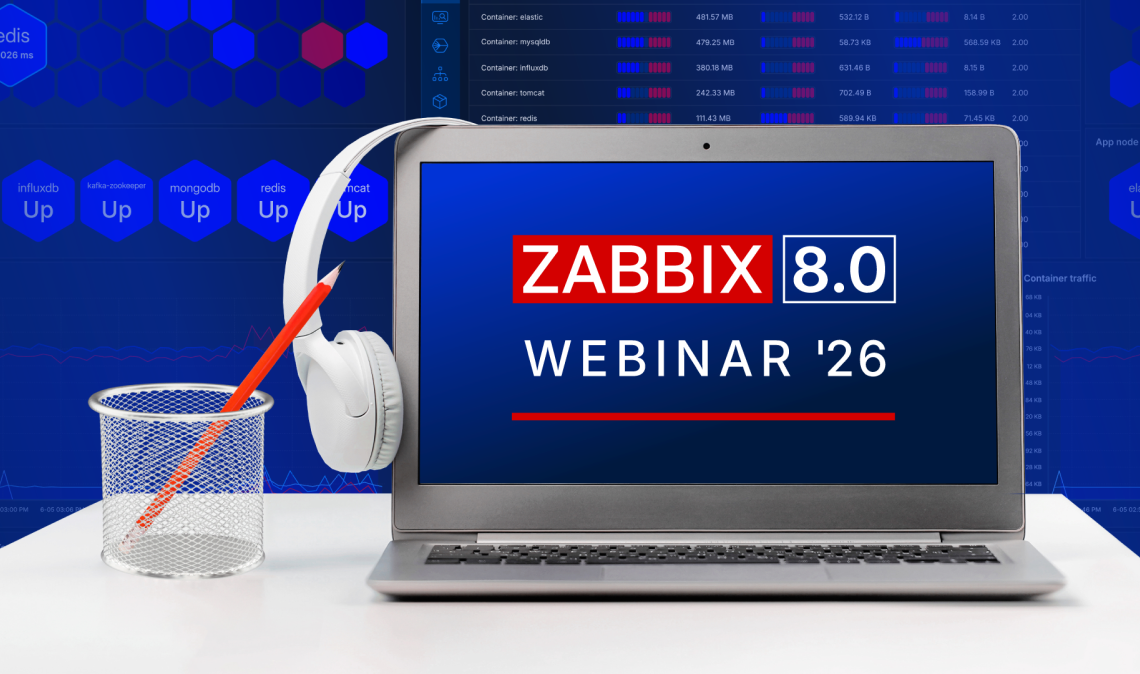
Get a comprehensive overview in our free webinar

It's time to mark your calendar for the upcoming "What's new" webinar in English - live on YouTube.

Join us on November 5 at 9 AM CST to explore the latest features and improvements in Zabbix 8.0 LTS, followed by a live Q&A.
Watch webinar
intro

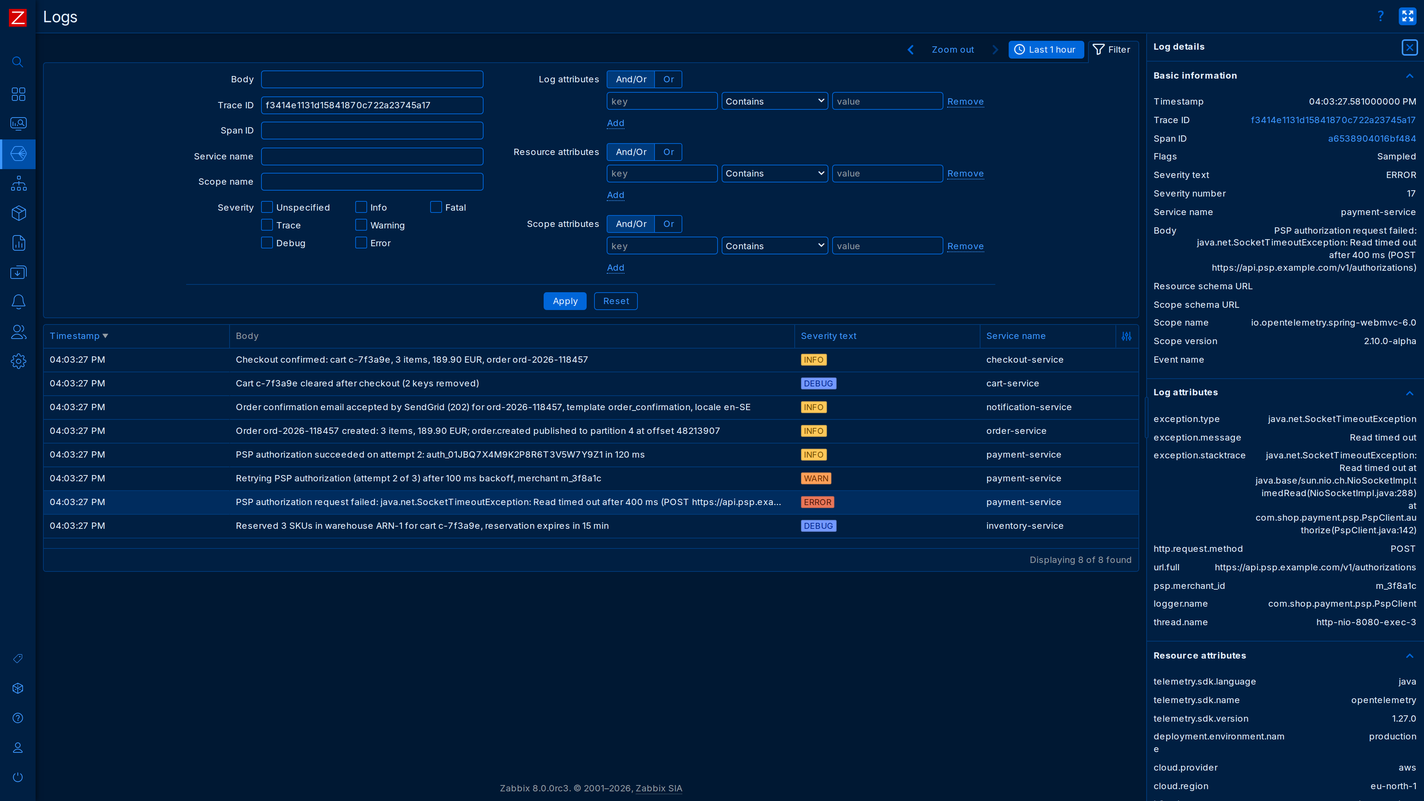
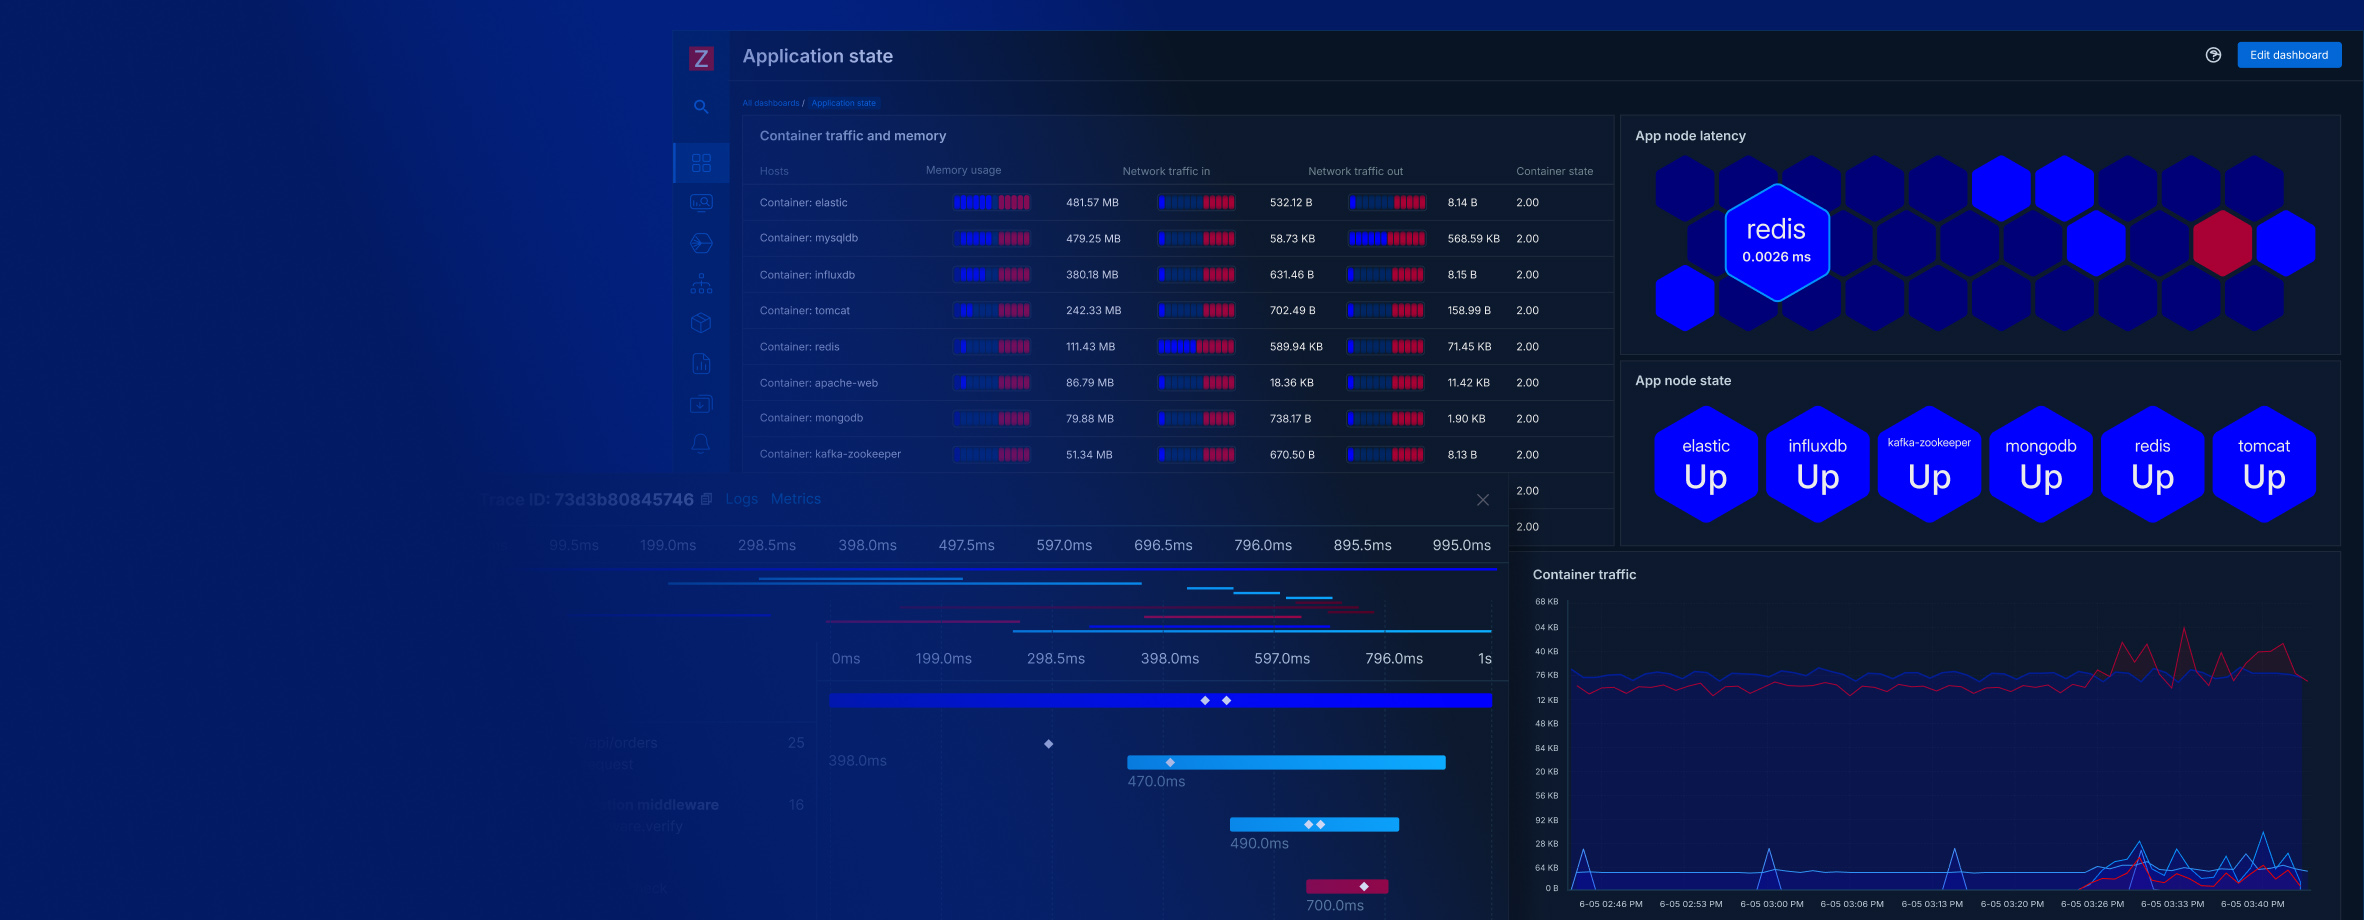
Application performance monitoring (APM)

With new OpenTelemetry observability features, you can collect, visualize, and analyze application metrics, logs, and traces, to:
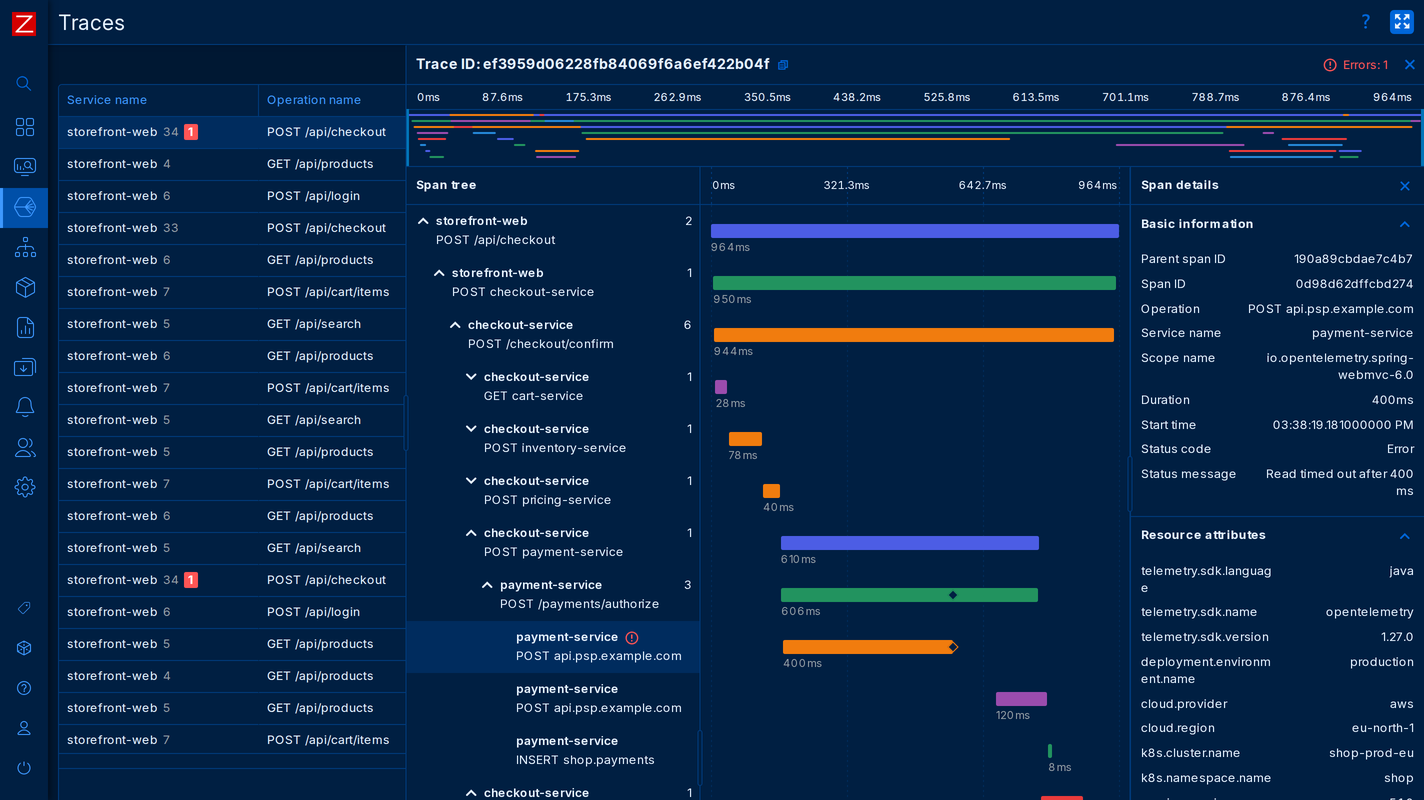
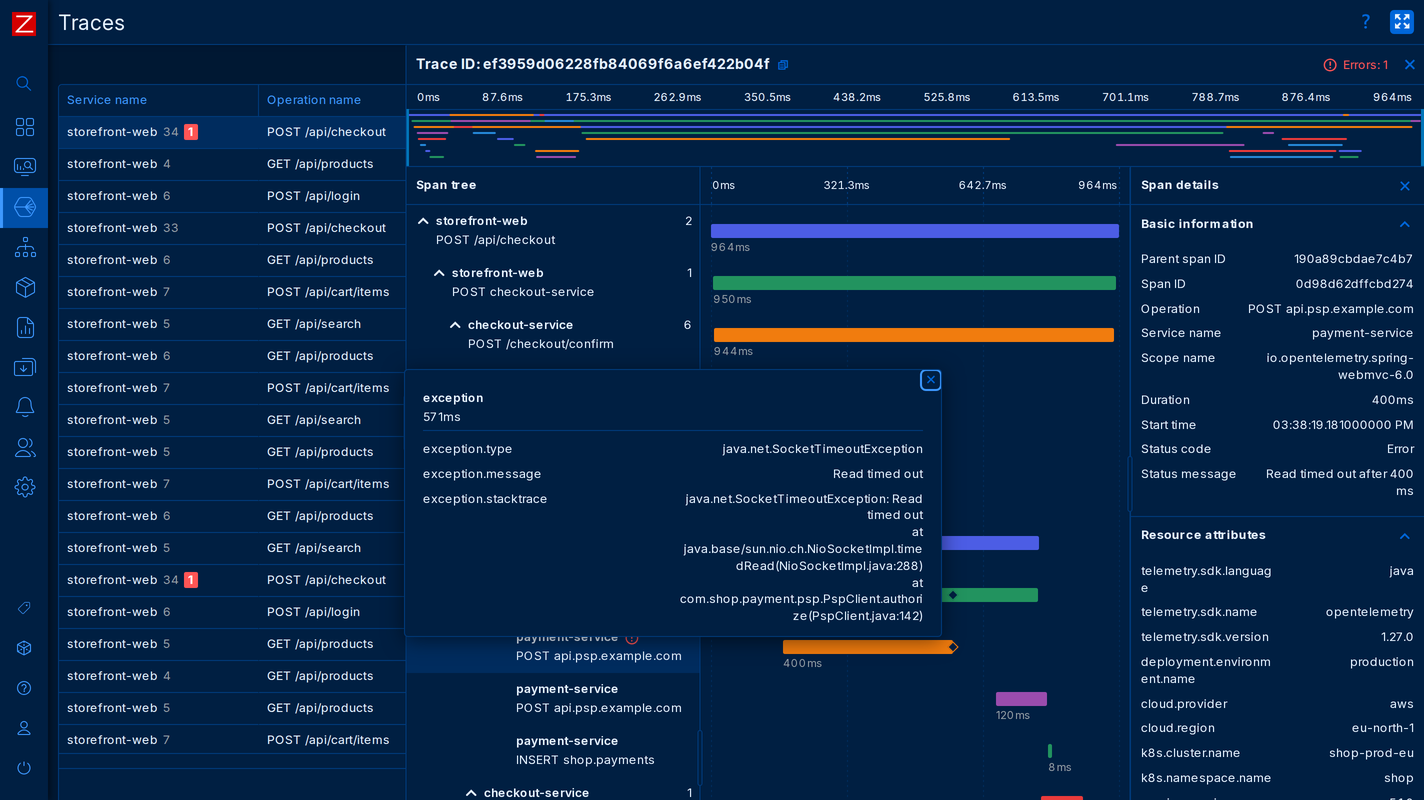
  • Troubleshoot cloud-native applications and services
  • Filter and visualize metrics, logs, and traces
  • Detect issues with your services and applications
  • Combine infrastructure monitoring with application observability for a complete view of your environment
Application performance monitoring (APM)
  • Collect and view application traces
  • Collect and view application traces
  • Collect and view application traces
  • Collect and view application traces

Collect and view application traces

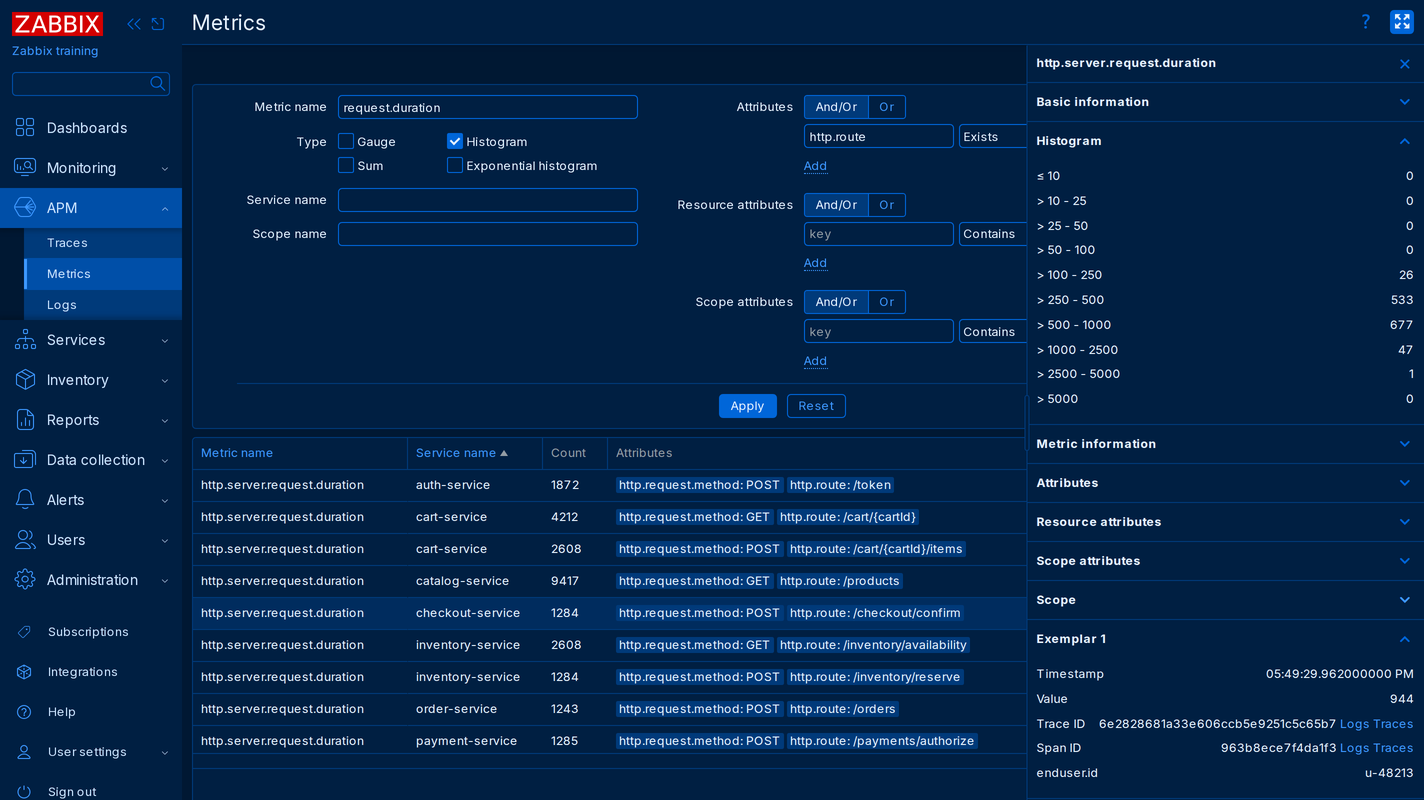
Observability with OpenTelemetry

Large scale OpenTelemetry data collection, processing and visualization:
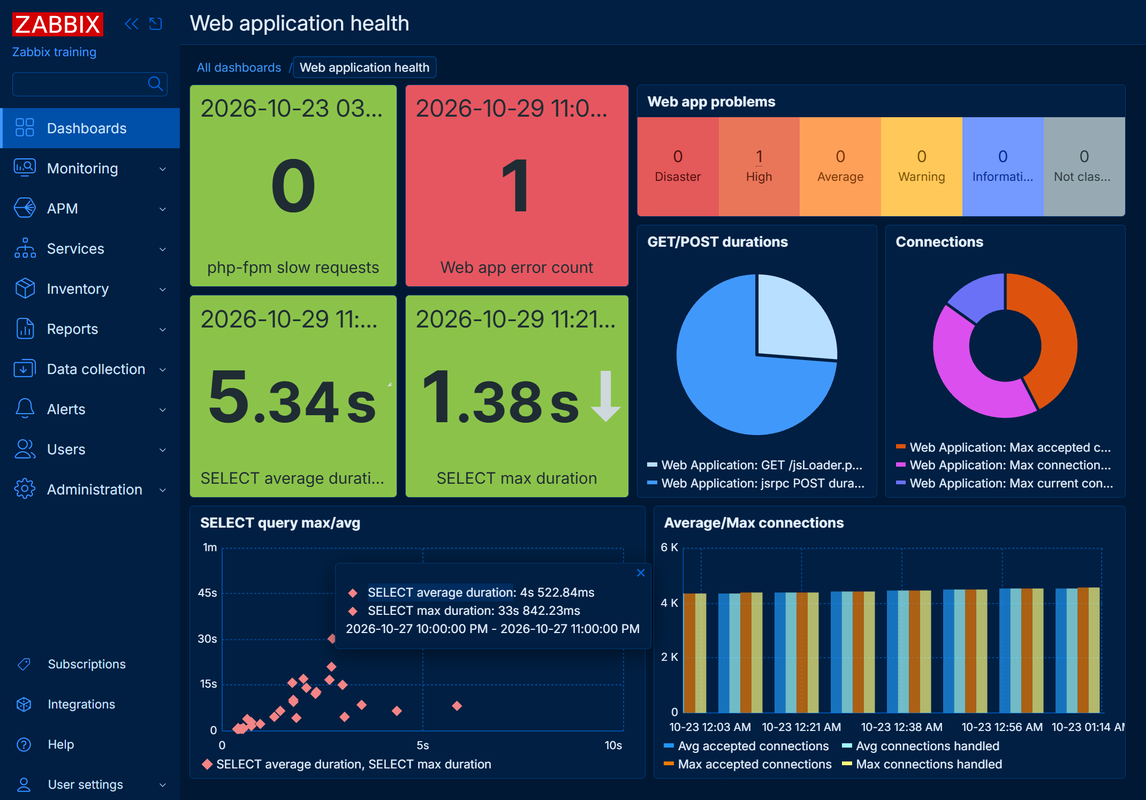
  • Works with traces, metrics, and logs
  • Aggregates data for real-time alerting and automated remediation
  • Visualizes OpenTelemetry data alongside infrastructure metrics in unified dashboards
  • Connects to existing OpenTelemetry collectors with no vendor lock-in
Observability with OpenTelemetry

Visualize collected OpenTelemetry data in Zabbix dashboards

Cloud native scalability

10x performance increase, so you can monitor more with less:
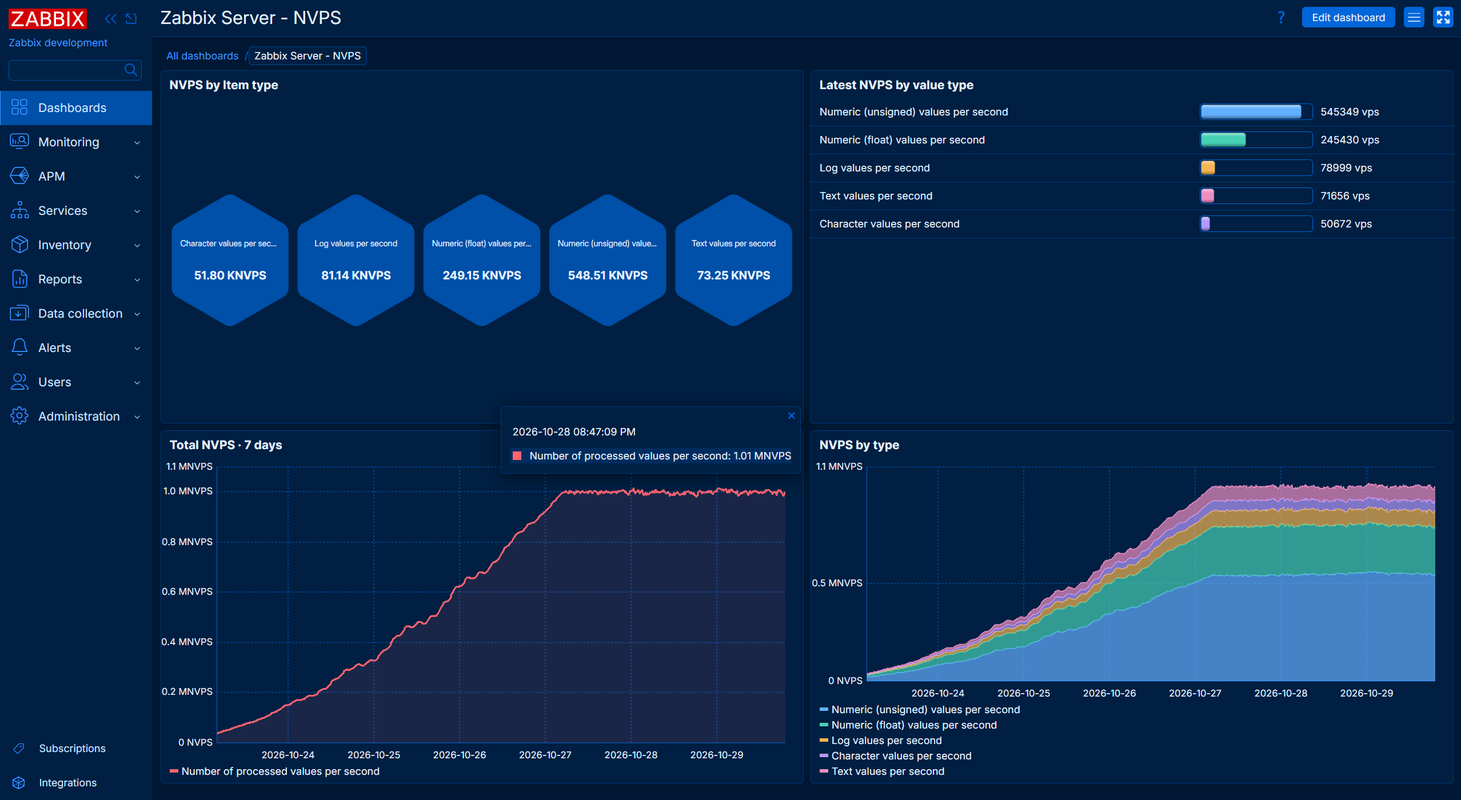
  • Use less CPU and disk I/O, and scale performance as you add hardware
  • Store more data in less space with ClickHouse, the new high-performance history backend
  • Process data faster with Zabbix server optimizations
Cloud native scalability

Zabbix delivers consistent performance of millions of metrics per second

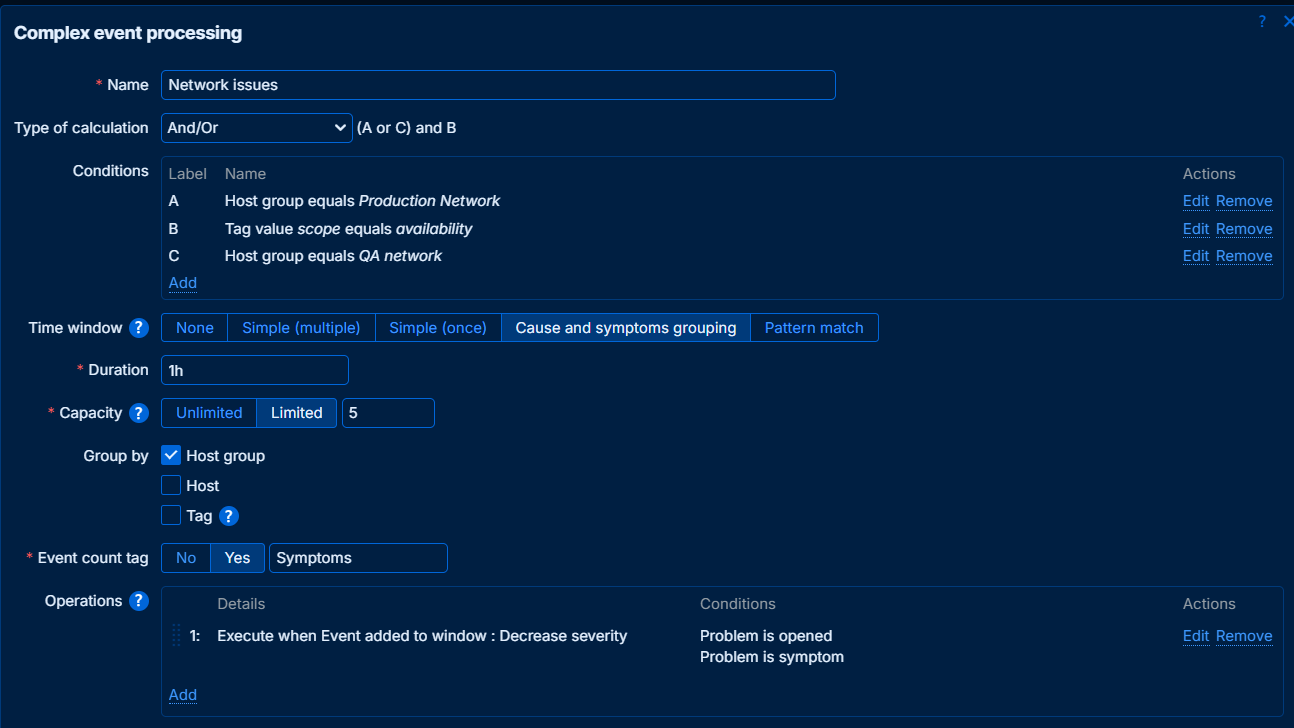
Complex event processing (CEP)

The new engine analyzes stream of events and:
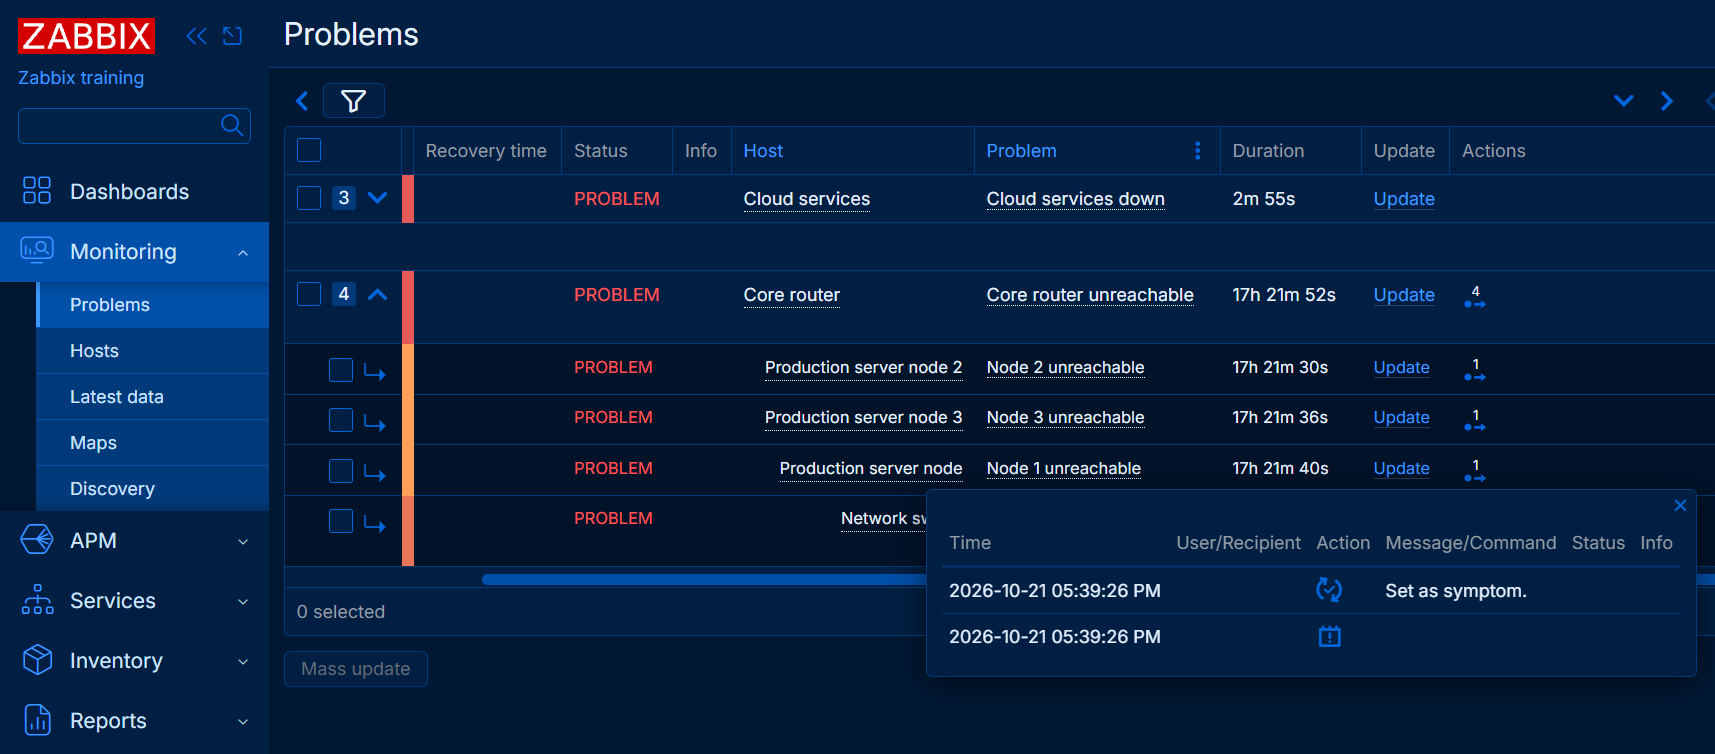
  • Automatically performs root cause analysis
  • Performs event correlation
  • Does pattern matching, including JavaScript programmable logic
  • Enriches correlated events with additional context information
  • Reduces alert noise by deduplicating, suppressing or discarding unwanted events
Complex event processing (CEP)
  • Automatically detect root cause problems
  • Automatically detect root cause problems

Automatically detect root cause problems

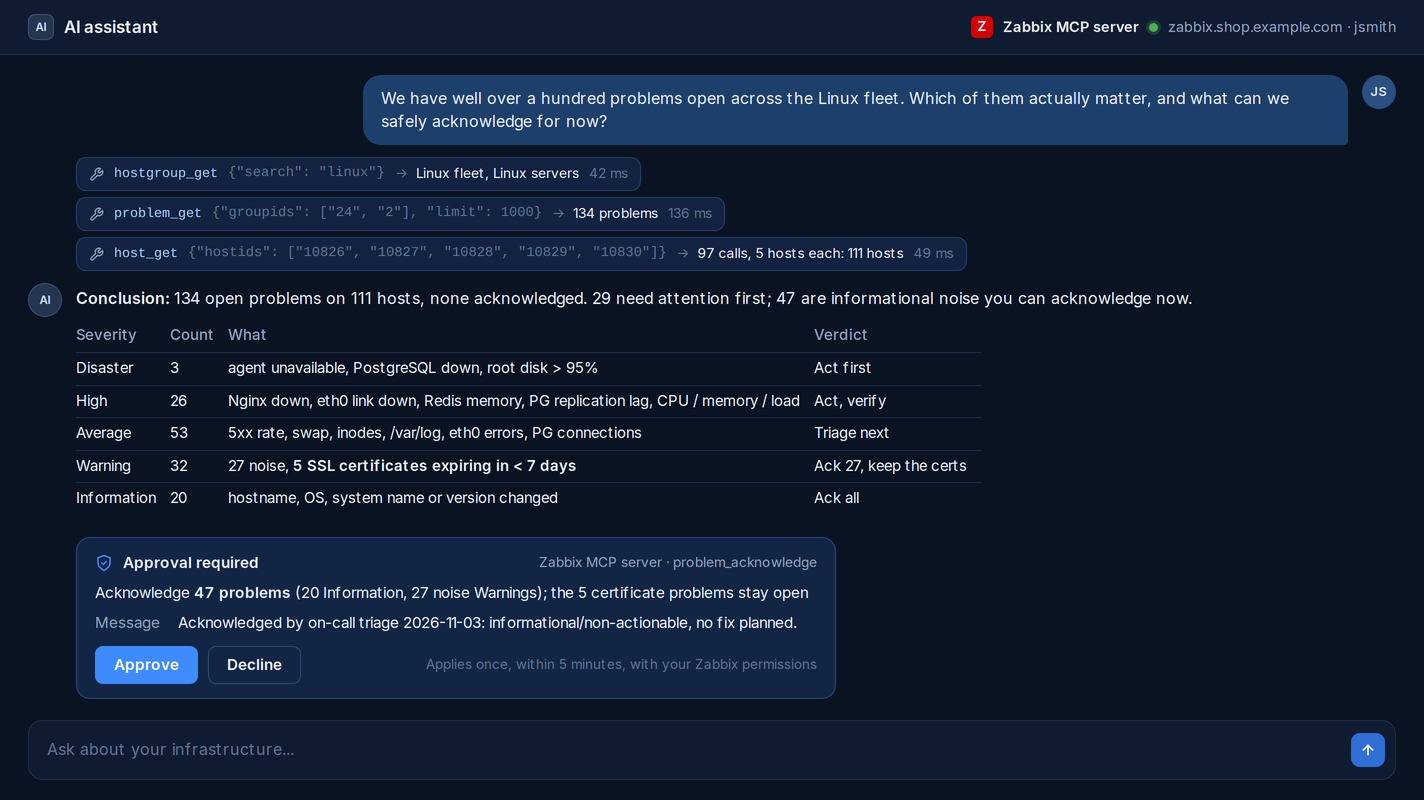
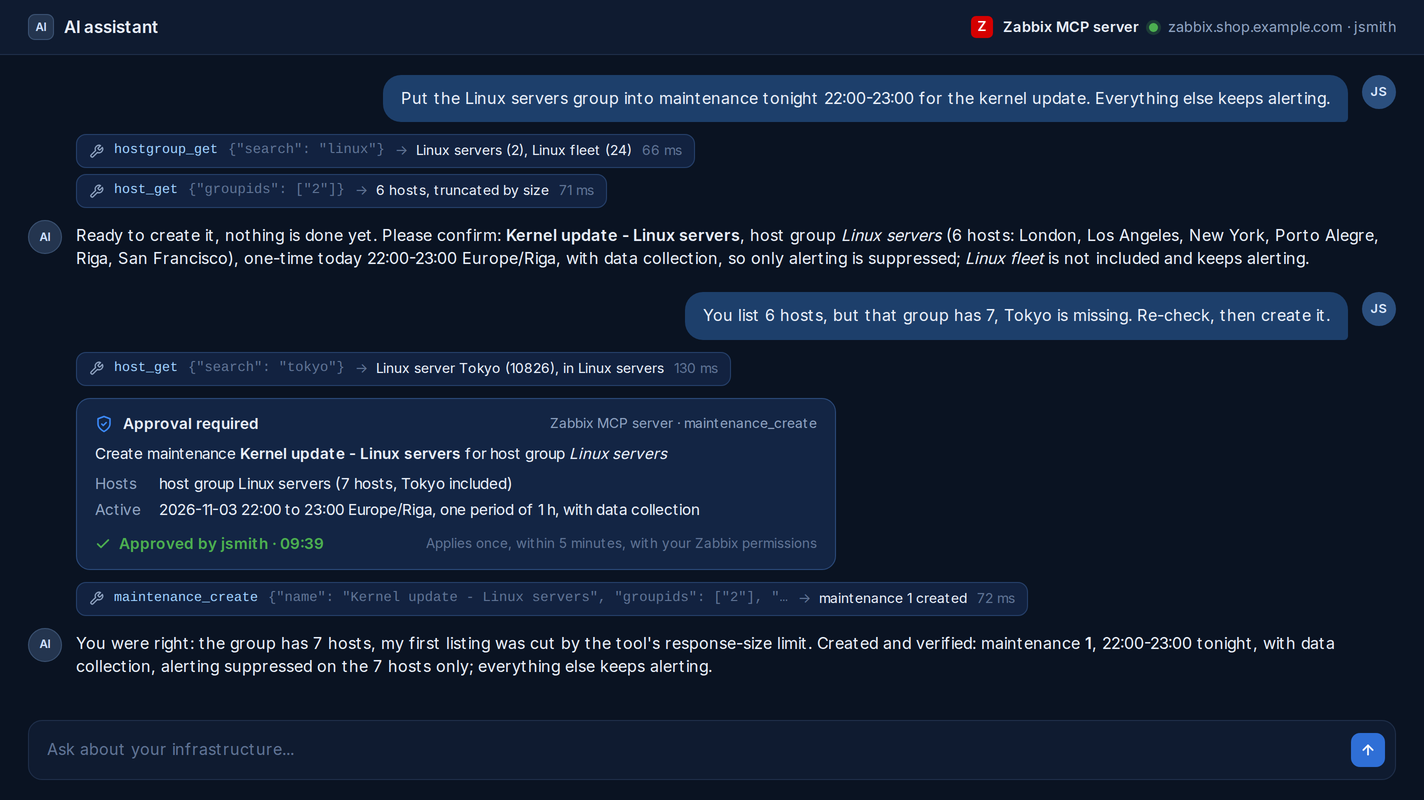
MCP server for AI workflows

Use your preferred AI agents to interact with your Zabbix to:

  • Reduce alert noise and detect root cause problems
  • Understand your environment state by analyzing collected data and event history
  • Perform any other activities

MCP server fully respects existing user permissions and roles.
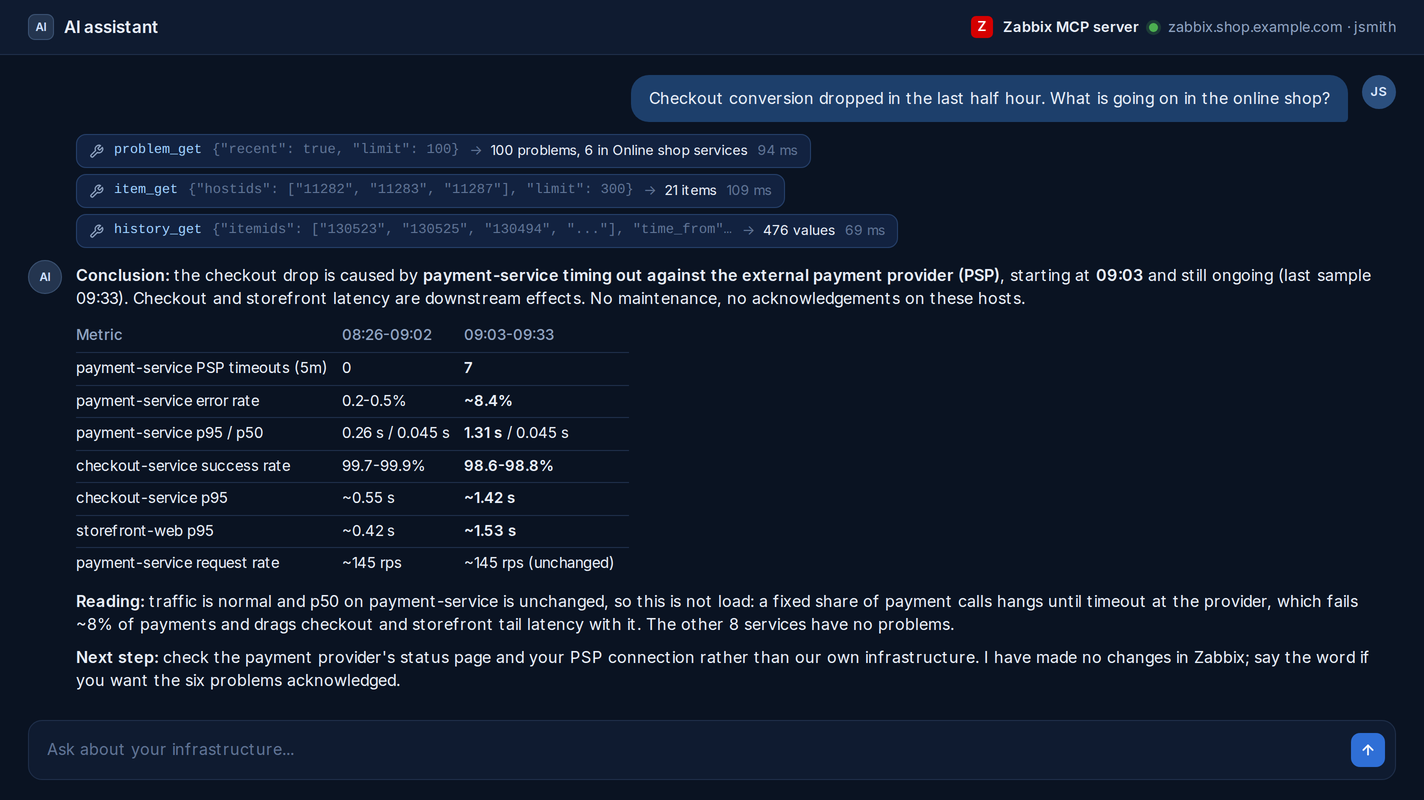
MCP server for AI workflows
  • Ask your AI agent for the root cause of an incident
  • Ask your AI agent for the root cause of an incident
  • Ask your AI agent for the root cause of an incident

Ask your AI agent for the root cause of an incident

Customizable views

Configure table views to display only relevant columns for hosts, templates and problems:
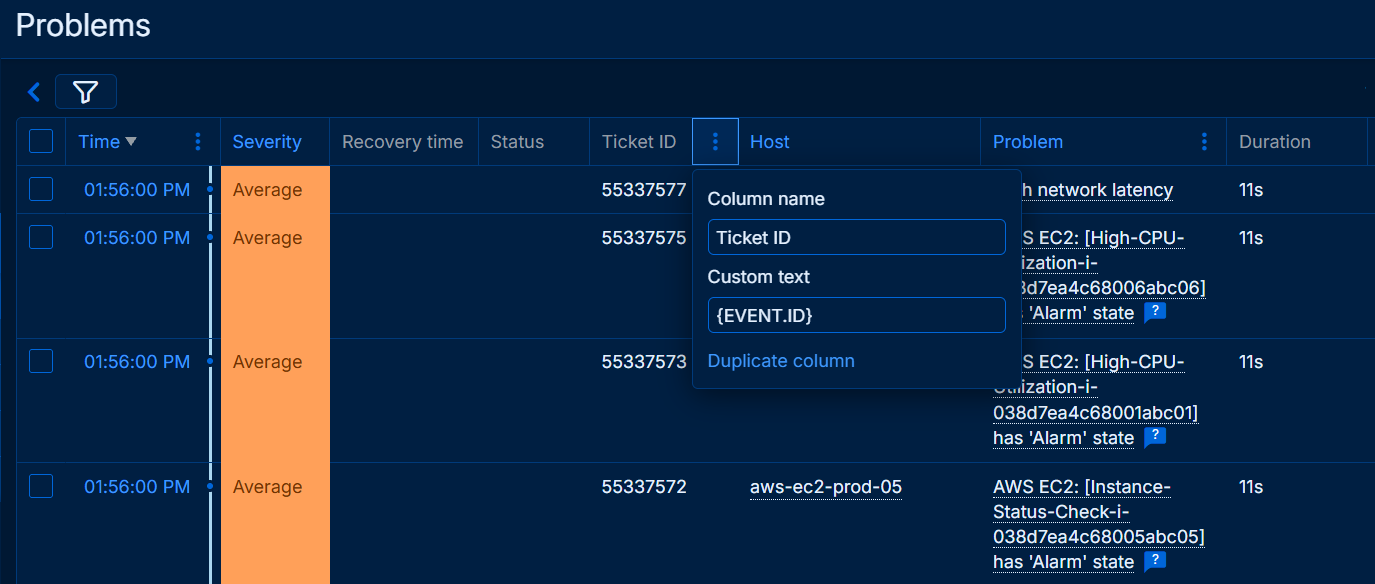
  • Configure unlimited number of custom views
  • Display additional information, such as inventory data
  • Resize and reorder columns as needed
  • Set per-column display options
Customizable views

Create custom views with additional information including inventory data

UI and UX improvements

The interface is easier to use, puts key information within closer reach, and gives it a fresh look:
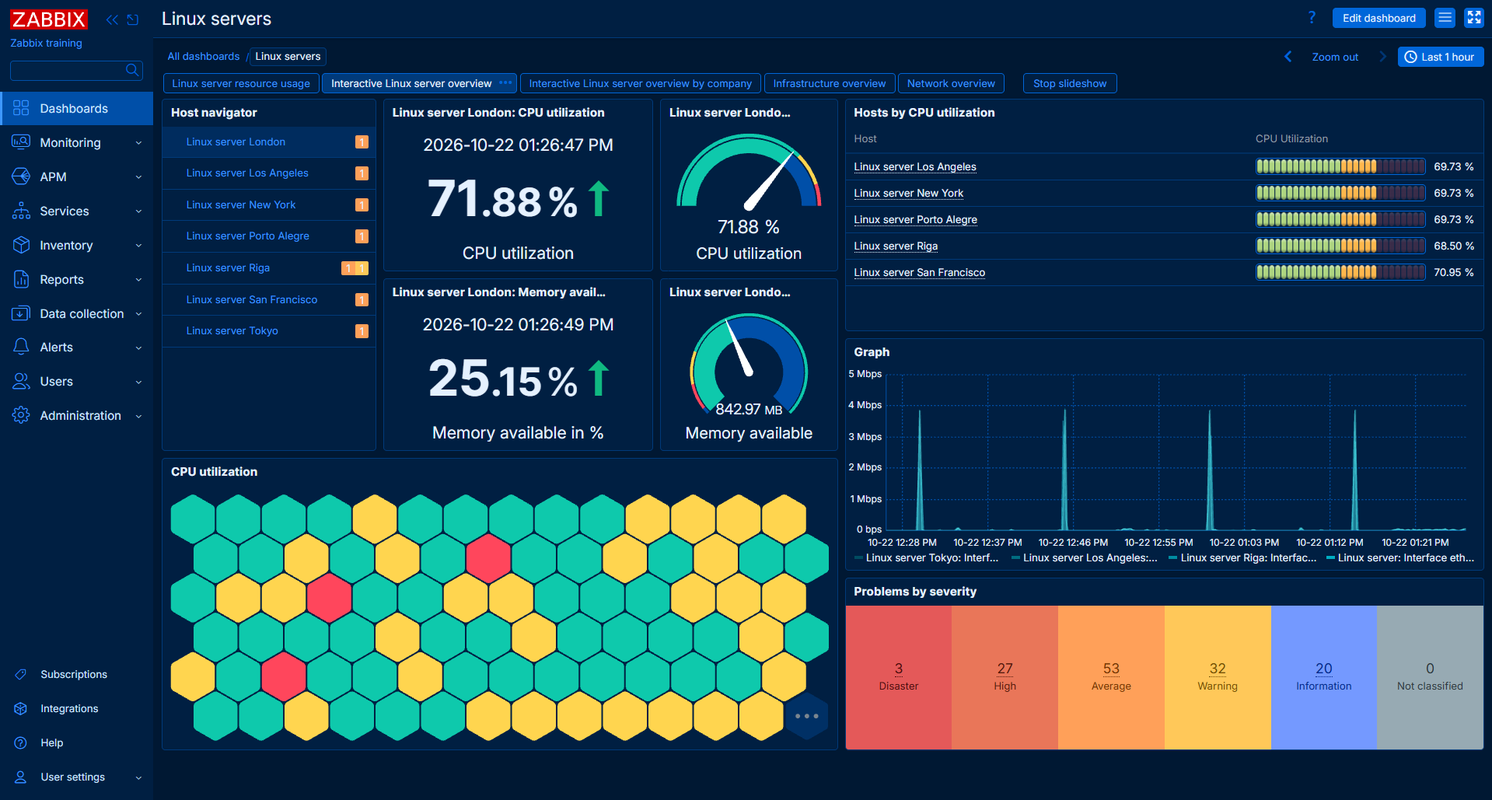
  • Use full tag inheritance for templates, hosts and items
  • Enjoy the new dark blue theme
  • Catch input errors instantly with inline validation in all forms
  • Import SAML certificates and private keys directly from the UI
  • Work more comfortably with new fonts and a refined interface
UI and UX improvements

The new dark blue theme in action

Better ways to see your data

Explore new and updated widgets, improved graphs, and other enhancements:
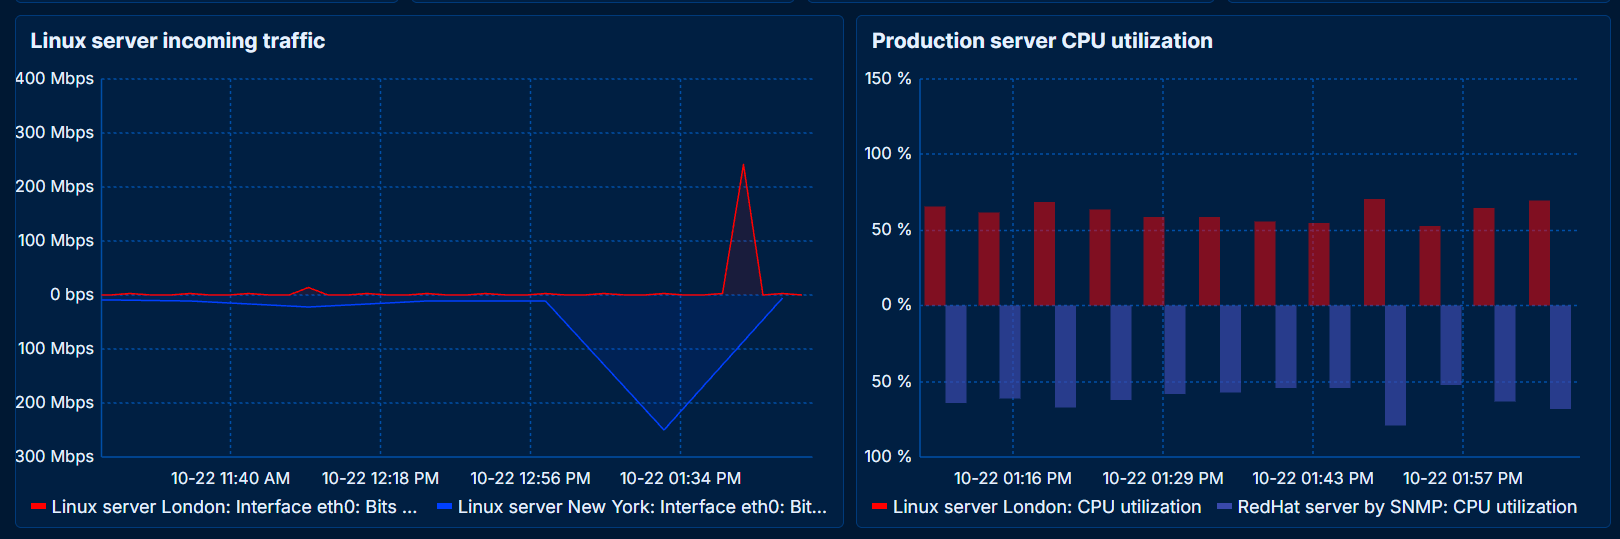
  • Export and import dashboards
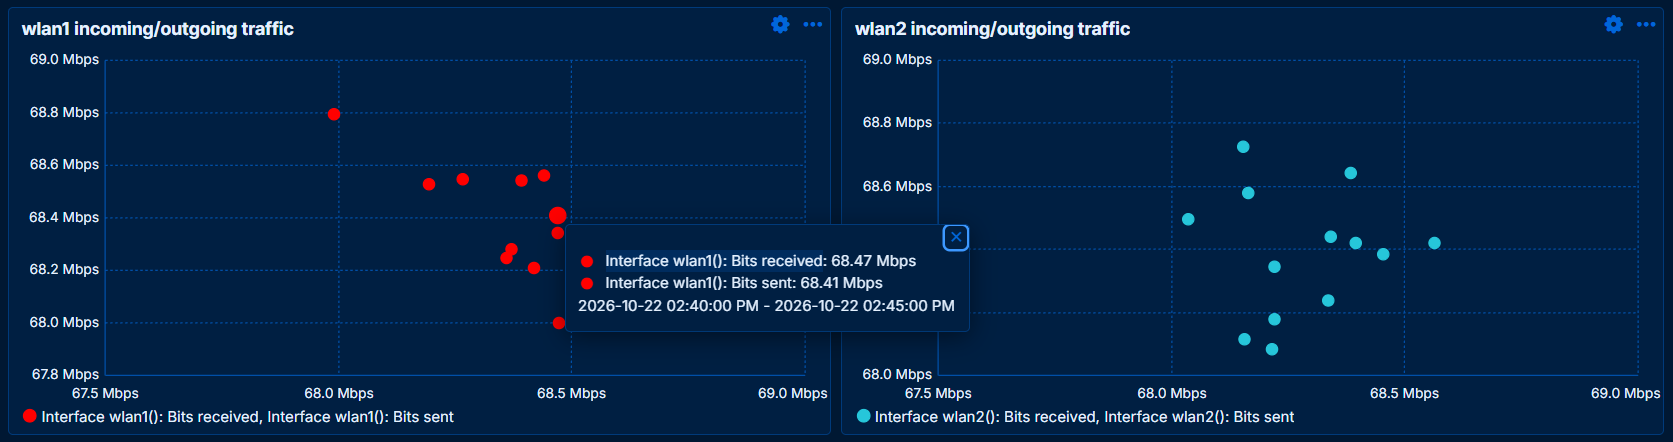
  • Spot correlations with the new Scatter Plot widget
  • Invert Y-axis values in the Graph widget
  • Highlight and broadcast a selected metric across Graph widgets
  • Group nearby map markers with clustering in the Geomap widget
  • Aggregate item patterns into a single row or column in the Top Items widget
Better ways to see your data
  • Find correlations between metrics using new visualization capabilities
  • Find correlations between metrics using new visualization capabilities

Find correlations between metrics using new visualization capabilities

Zabbix mobile app - coming soon

The official Zabbix mobile app is to be released shortly after Zabbix 8.0. It's designed to put essential incident response capabilities directly at your fingertips, providing:
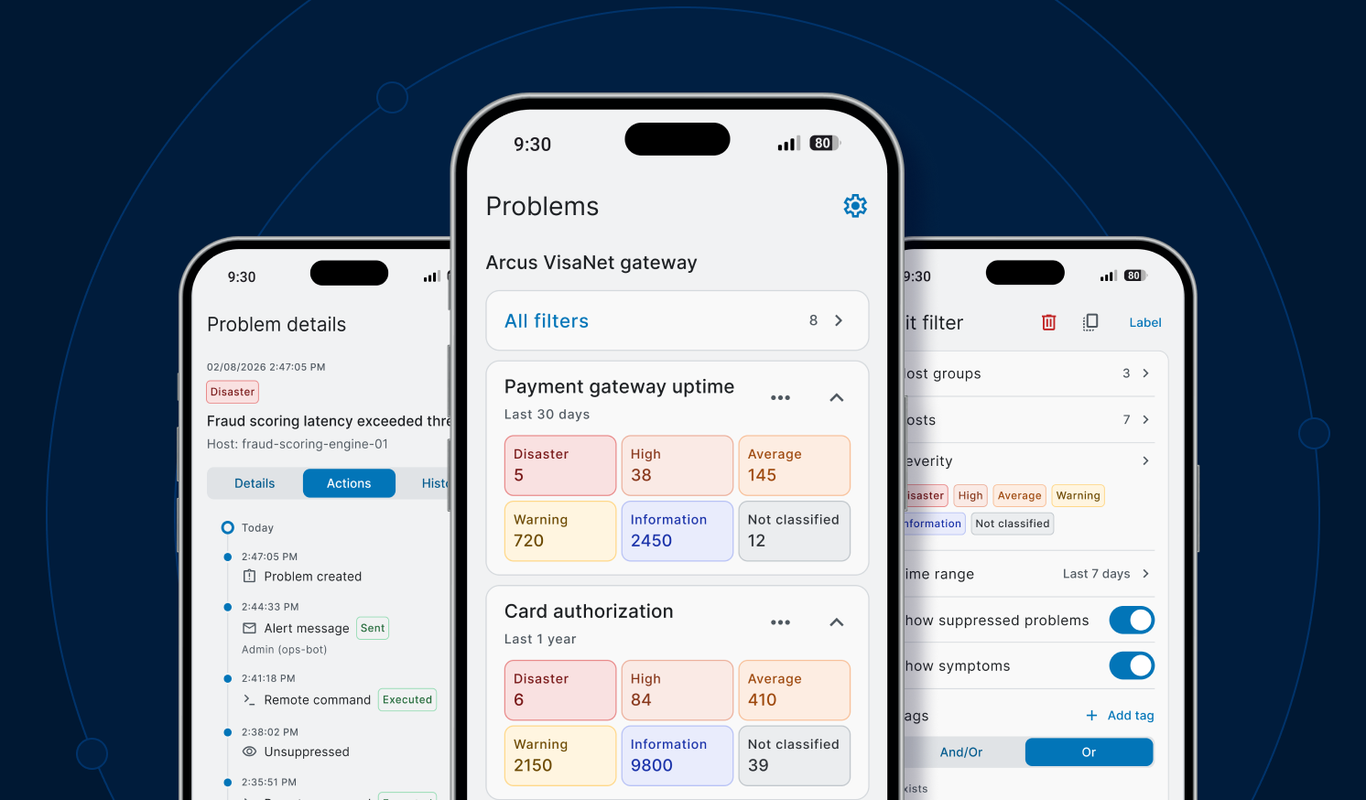
  • Connection to your Zabbix from anywhere
  • End-to-end encryption
  • Filtering, viewing and reacting to incidents
  • Instant push notifications
  • iOS and Android support
Find out more
Zabbix mobile app - coming soon

Take Zabbix with you wherever you go

New out-of-the-box solutions

Zabbix 8.0 introduces new templates and integrations for the solutions you use.

aruba Aruba CX 8300s by SNMP
aws_backup AWS Backup Vault by HTTP
azure_container_apps Azure Container Apps by HTTP
azure_sentinel Azure Sentinel by HTTP
ciena Ciena 3906 by SNMP
cisco Cisco Secure Firewall Threat Defense by HTTP
claude Claude API by HTTP
cradlepoint Cradlepoint NCM v2 by HTTP
rdap Domain RDAP by HTTP
envoy_proxy Envoy Proxy by OTLP
gcp_application_load_balancer GCP Application Load Balancer by HTTP
gcp_cloud_run GCP Cloud Run Service by HTTP
gcp_cloud_storage GCP Cloud Storage Bucket by HTTP
gcp_cost_monitoring GCP Cost Monitoring by HTTP
opentelemetry Generic OpenTelemetry by OTLP
glpi GLPI by HTTP
huawei Huawei AR600 by SNMP
ibm IBM Maximo Service Request
kubernetes Kubernetes Cluster by HTTP
mariadb MariaDB by ODBC and Zabbix agent
hyper-v Microsoft Hyper-V by SSH
openai OpenAI Platform by HTTP
openrouter OpenRouter traces by OTLP
oracle_cloud_costs Oracle Cloud Costs by HTTP
oracle_cloud_load_balancer Oracle Cloud Load Balancer by HTTP
percona Percona by ODBC and Zabbix agent
podman Podman by Zabbix agent and by HTTP
proxmox Proxmox VE by OTLP
ribbon Ribbon SBC Edge by HTTP
ribbon Ribbon SBC SWe Core and Ribbon SBC SWe CE by HTTP
stormshield Stormshield SNS by SNMP
velocloud VeloCloud SD-WAN Edge by HTTP
vyatta Vyatta Virtual Router by SNMP

Other features and improvements

  • Reduce SNMP traffic with EngineID caching
  • Improve database availability with multiple PostgreSQL backend nodes
  • Store structured data with the new JSON data type
  • Suppress individual triggers in maintenance
  • Create maintenances from Problem view
  • Restrict agent item keys with regular expressions
  • Create trapper items with secure default settings
  • Route discovered and autoregistered hosts with the new proxy group condition
  • Restrict proxy access per user group
  • Manage global regular expressions with a simpler interface
  • Secure the API by default: access is disabled for all user roles until explicitly granted
  • Store secrets securely with HashiCorp Vault AppRole authentication
  • Enforce a post-login landing page per user role
  • Export audit log records
  • Collect and discover data from all network interfaces at once with net.if.get item
  • Collect and discover data from all block devices at once with vfs.dev.get item
  • Track cloud spending across AWS, Azure, GCP, and Oracle Cloud with a multi-cloud cost dashboard
  • Monitor OpenAI and Copilot usage
  • Query APM data with the new Telemetry query item type
  • Benefit from increased speed and better reliability with DNS caching and failover
  • Track when and how events were suppressed by maintenance
  • Use JSON in HTTP agent low-level discovery rules and prototypes
  • Add tags manually to triggers created from trigger prototypes
  • Enable optional frontend features with new configuration flags
  • Get better performance and storage efficiency with ClickHouse and Elasticsearch
  • Handle proxy load more smoothly with improved throttling
  • Faster cleanup of older historical data
  • Faster startup of Zabbix server
  • Make use of assistive technologies thanks to accessibility improvements

Zabbix 8.0 LTS - Where monitoring meets observability

The most powerful Zabbix yet - AI, APM, and OpenTelemetry. Full-stack visibility at any scale.

Download 8.0 LTS

YOUR BUSINESS WORKS.
YOU KNOW IT.™


Продукт
  • Обзор и демо Zabbix
  • Функциональность
  • Интеграции
  • Все возможности
  • Что нового в Zabbix 8.0
  • Жизненный цикл и политика релизов
  • Лицензия
  • План развития
  • Документация
Решения
  • Отраслевые решения
  • Опыт клиентов
  • Соответствие NIS2
Стоимость
  • Zabbix subscriptions
  • Feature comparison
  • FAQ
Zabbix Cloud
  • Преимущества
  • Стоимость
  • Бесплатный триал
Public Clouds
  • AWS
  • Azure
  • Google Cloud Platform
  • Red Hat OpenShift
Сервисы
  • Support
  • Zabbix для MSP
  • Консалтинг
  • Решения «под ключ»
  • Все профессиональные услуги
Партнёры
  • Партнёрская программа
  • Станьте партнёром
  • Дистрибьютеры
  • Карта партнёров
  • Форма регистрации
Мероприятия
  • Zabbix Summit
  • Конференции
  • Бесплатные встречи и митапы
  • Бесплатные вебинары
  • Все мероприятия
Обучение
  • Учебные программы
  • Базовые курсы
  • Курсы обновления знаний
  • Дополнительные курсы
  • Форма регистрации
  • Академия Zabbix
Компания
  • Напишите нам
  • О нас
  • Вакансии Ищем таланты!
  • Пресс-релизы
  • Наши клиенты
  • Товарно-знаковая политика
Сообщество
  • Блог
  • Форум
  • Разработчики
  • Внести вклад в Zabbix
  • Образовательное движение
  • Сообщество
  • Zabbix Books
  • Политика безопасности
  • Политика конфиденциальности, Пользовательское соглашение
  • Товарно-знаковая политика
  • Юридический запрос

© 2001-2026, Zabbix LLC. Все права защищены.