
2 SNMP agent
Overview
You may want to use SNMP monitoring on devices such as printers, network switches, routers or UPS that usually are SNMP-enabled and on which it would be impractical to attempt setting up complete operating systems and Zabbix agents.
To be able to retrieve data provided by SNMP agents on these devices, Zabbix server must be initially configured with SNMP support.
SNMP checks are performed over the UDP protocol only.
Since Zabbix 2.2.3 Zabbix server and proxy daemons query SNMP devices for multiple values in a single request. This affects all kinds of SNMP items (regular SNMP items, SNMP items with dynamic indexes, and SNMP low-level discovery) and should make SNMP processing much more efficient. Please see the technical detail section below on how it works internally. Since Zabbix 2.4 there is also a "Use bulk requests" setting for each interface that allows to disable bulk requests for devices that cannot handle them properly.
Since Zabbix 2.2.7 and Zabbix 2.4.2 Zabbix server and proxy daemons log
lines similar to the following if they receive an incorrect SNMP
response:SNMP response from host "gateway" does not contain all of the requested variable bindingsWhile
they do not cover all the problematic cases, they are useful for
identifying individual SNMP devices for which bulk requests should be
disabled.
Since Zabbix 2.2 Zabbix server and proxy daemons correctly use the Timeout configuration parameter when performing SNMP checks. Additionally the daemons do not perform retries after a single unsuccessful SNMP request (timeout/wrong credentials). Previously the SNMP library default timeout and retry values (1 second and 5 retries respectively) were actually used.
Since Zabbix 2.2.8 and Zabbix 2.4.2 Zabbix server and proxy daemons will always retry at least one time: either through the SNMP library's retrying mechanism or through the internal bulk processing mechanism.
If monitoring SNMPv3 devices, make sure that msgAuthoritativeEngineID (also known as snmpEngineID or "Engine ID") is never shared by two devices. According to RFC 2571 (section 3.1.1.1) it must be unique for each device.
Configuring SNMP monitoring
To start monitoring a device through SNMP, the following steps have to be performed:
Step 1
Create a host for the device with an SNMP interface.
Enter the IP address. You can use one of the provided SNMP templates (Template SNMP Device and others) that will automatically add a set of items. However, the template may not be compatible with the host. Click on Add to save the host.
SNMP checks do not use Agent port, it is ignored.
Step 2
Find out the SNMP string (or OID) of the item you want to monitor.
To get a list of SNMP strings, use the snmpwalk command (part of net-snmp software which you should have installed as part of the Zabbix installation) or equivalent tool:
shell> snmpwalk -v 2c -c public <host IP> .As '2c' here stands for SNMP version, you may also substitute it with '1', to indicate SNMP Version 1 on the device.
This should give you a list of SNMP strings and their last value. If it doesn't then it is possible that the SNMP 'community' is different from the standard 'public' in which case you will need to find out what it is.
You can then go through the list until you find the string you want to
monitor, e.g. if you wanted to monitor the bytes coming in to your
switch on port 3 you would use the IF-MIB::ifInOctets.3 string from
this line:
IF-MIB::ifInOctets.3 = Counter32: 3409739121You may now use the snmpget command to find out the numeric OID for 'IF-MIB::ifInOctets.3':
shell> snmpget -v 2c -c public -On 10.62.1.22 IF-MIB::ifInOctets.3Note that the last number in the string is the port number you are looking to monitor. See also: Dynamic indexes.
This should give you something like the following:
.1.3.6.1.2.1.2.2.1.10.3 = Counter32: 3472126941Again, the last number in the OID is the port number.
3COM seem to use port numbers in the hundreds, e.g. port 1 = port 101, port 3 = port 103, but Cisco use regular numbers, e.g. port 3 = 3.
Some of the most used SNMP OIDs are translated automatically to a numeric representation by Zabbix.
In the last example above value type is "Counter32", which internally corresponds to ASN_COUNTER type. The full list of supported types is ASN_COUNTER, ASN_COUNTER64, ASN_UINTEGER, ASN_UNSIGNED64, ASN_INTEGER, ASN_INTEGER64, ASN_FLOAT, ASN_DOUBLE, ASN_TIMETICKS, ASN_GAUGE, ASN_IPADDRESS, ASN_OCTET_STR and ASN_OBJECT_ID (since 2.2.8, 2.4.3). These types roughly correspond to "Counter32", "Counter64", "UInteger32", "INTEGER", "Float", "Double", "Timeticks", "Gauge32", "IpAddress", "OCTET STRING", "OBJECT IDENTIFIER" in snmpget output, but might also be shown as "STRING", "Hex-STRING", "OID" and other, depending on the presence of a display hint.
Step 3
Create an item for monitoring.
So, now go back to Zabbix and click on Items for the SNMP host you created earlier. Depending on whether you used a template or not when creating your host, you will have either a list of SNMP items associated with your host or just an empty list. We will work on the assumption that you are going to create the item yourself using the information you have just gathered using snmpwalk and snmpget, so click on Create item. In the new item form, enter the item 'Name'. Make sure the 'Host interface' field has your switch/router in it and change the 'Type' field to "SNMPv* agent". Enter the community (usually public) and enter the textual or numeric OID that you retrieved earlier into the 'SNMP OID' field, for example: .1.3.6.1.2.1.2.2.1.10.3
Enter the SNMP 'Port' as 161 and the 'Key' as something meaningful, e.g. SNMP-InOctets-Bps. Choose a custom multiplier if you want one and enter an 'Update interval' and 'History storage period' if you want them to be different from the default. Set the 'Type of information' to Numeric (float) and the 'Store value' to Delta (speed per second) (important, otherwise you will get cumulative values from the SNMP device instead of the latest change).
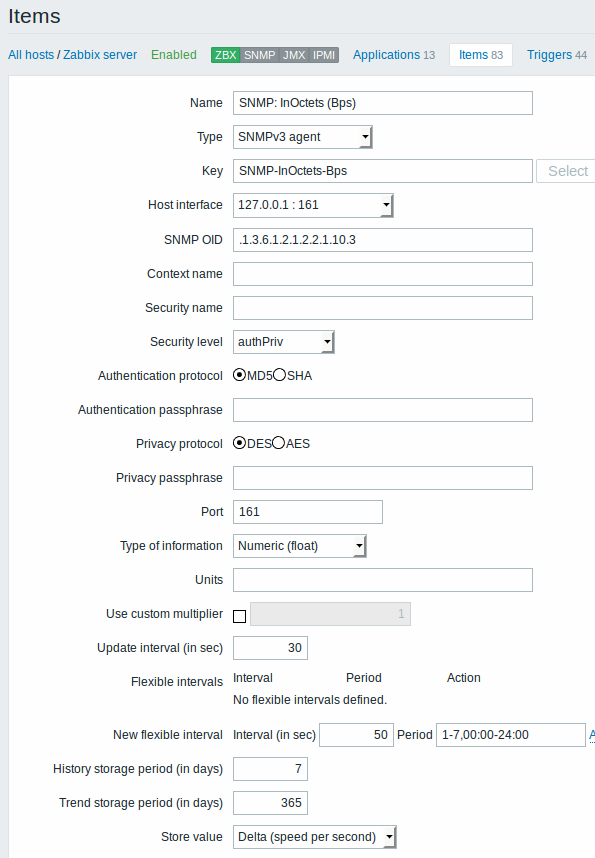
Now save the item and go to Monitoring → Latest data for your SNMP data!
Take note of specific options available for SNMPv3 items:
| Parameter | Description |
|---|---|
| Context name | Enter context name to identify item on SNMP subnet. Context name is supported for SNMPv3 items since Zabbix 2.2. User macros are resolved in this field. |
| Security name | Enter security name. User macros are resolved in this field. |
| Security level | Select security level: noAuthNoPriv - no authentication nor privacy protocols are used AuthNoPriv - authentication protocol is used, privacy protocol is not AuthPriv - both authentication and privacy protocols are used |
| Authentication protocol | Select authentication protocol - MD5 or SHA. |
| Authentication passphrase | Enter authentication passphrase. User macros are resolved in this field. |
| Privacy protocol | Select privacy protocol - DES or AES. |
| Privacy passphrase | Enter privacy passphrase. User macros are resolved in this field. |
Since Zabbix 2.2, SHA and AES protocols are supported for SNMPv3 authentication and privacy, in addition to MD5 and DES supported before that.
Example 1
General example:
| Parameter | Description |
|---|---|
| Community | public |
| OID | 1.2.3.45.6.7.8.0 (or .1.2.3.45.6.7.8.0) |
| Key | <Unique string to be used as reference to triggers> For example, "my_param". |
Note that OID can be given in either numeric or string form. However, in some cases, string OID must be converted to numeric representation. Utility snmpget may be used for this purpose:
shell> snmpget -On localhost public enterprises.ucdavis.memory.memTotalSwap.0Monitoring of SNMP parameters is possible if --with-net-snmp flag was specified while configuring Zabbix sources.
Example 2
Monitoring of uptime:
| Parameter | Description |
|---|---|
| Community | public |
| Oid | MIB::sysUpTime.0 |
| Key | router.uptime |
| Value type | Float |
| Units | uptime |
| Multiplier | 0.01 |
Internal workings of bulk processing
Starting from 2.2.3 Zabbix server and proxy query SNMP devices for multiple values in a single request. This affects several types of SNMP items:
- regular SNMP items;
- SNMP items with dynamic indexes;
- SNMP low-level discovery rules.
All SNMP items on a single interface with identical parameters are scheduled to be queried at the same time. The first two types of items are taken by pollers in batches of at most 128 items, whereas low-level discovery rules are processed individually, as before.
On the lower level, there are two kinds of operations performed for querying values: getting multiple specified objects and walking an OID tree.
For "getting", a GetRequest-PDU is used with at most 128 variable bindings. For "walking", a GetNextRequest-PDU is used for SNMPv1 and GetBulkRequest with "max-repetitions" field of at most 128 is used for SNMPv2 and SNMPv3.
Thus, the benefits of bulk processing for each SNMP item type are outlined below:
- regular SNMP items benefit from "getting" improvements;
- SNMP items with dynamic indexes benefit from both "getting" and "walking" improvements: "getting" is used for index verification and "walking" for building the cache;
- SNMP low-level discovery rules benefit from "walking" improvements.
However, there is a technical issue that not all devices are capable of returning 128 values per request. Some always return a proper response, but others either respond with a "tooBig(1)" error or do not respond at all once the potential response is over a certain limit.
In order to find an optimal number of objects to query for a given device, Zabbix uses the following strategy. It starts cautiously with querying 1 value in a request. If that is successful, it queries 2 values in a request. If that is successful again, it queries 3 values in a request and continues similarly by multiplying the number of queried objects by 1.5, resulting in the following sequence of request sizes: 1, 2, 3, 4, 6, 9, 13, 19, 28, 42, 63, 94, 128.
However, once a device refuses to give a proper response (for example, for 42 variables), Zabbix does two things.
First, for the current item batch it halves the number of objects in a single request and queries 21 variables. If the device is alive, then the query should work in the vast majority of cases, because 28 variables were known to work and 21 is significantly less than that. However, if that still fails, then Zabbix falls back to querying values one by one. If it still fails at this point, then the device is definitely not responding and request size is not an issue.
The second thing Zabbix does for subsequent item batches is it starts with the last successful number of variables (28 in our example) and continues incrementing request sizes by 1 until the limit is hit. For example, assuming the largest response size is 32 variables, the subsequent requests will be of sizes 29, 30, 31, 32, and 33. The last request will fail and Zabbix will never issue a request of size 33 again. From that point on, Zabbix will query at most 32 variables for this device.
If large queries fail with this number of variables, it can mean one of two things. The exact criteria that a device uses for limiting response size cannot be known, but we try to approximate that using the number of variables. So the first possibility is that this number of variables is around the device's actual response size limit in the general case: sometimes response is less than the limit, sometimes it is greater than that. The second possibility is that a UDP packet in either direction simply got lost. For these reasons, if Zabbix gets a failed query, it reduces the maximum number of variables to try to get deeper into the device's comfortable range, but (starting from 2.2.8) only up to two times.
In the example above, if a query with 32 variables happens to fail, Zabbix will reduce the count to 31. If that happens to fail, too, Zabbix will reduce the count to 30. However, Zabbix will not reduce the count below 30, because it will assume that further failures are due to UDP packets getting lost, rather than the device's limit.
If, however, a device cannot handle bulk requests properly for other reasons and the heuristic described above does not work, since Zabbix 2.4 there is a "Use bulk requests" setting for each interface that allows to disable bulk requests for that device.