
2 Availability report
Overview
In Reports → Availability report you can see what proportion of time each trigger has been in problem/ok state. The percentage of time for each state is displayed.
Thus it is easy to determine the availability situation of various elements on your system.
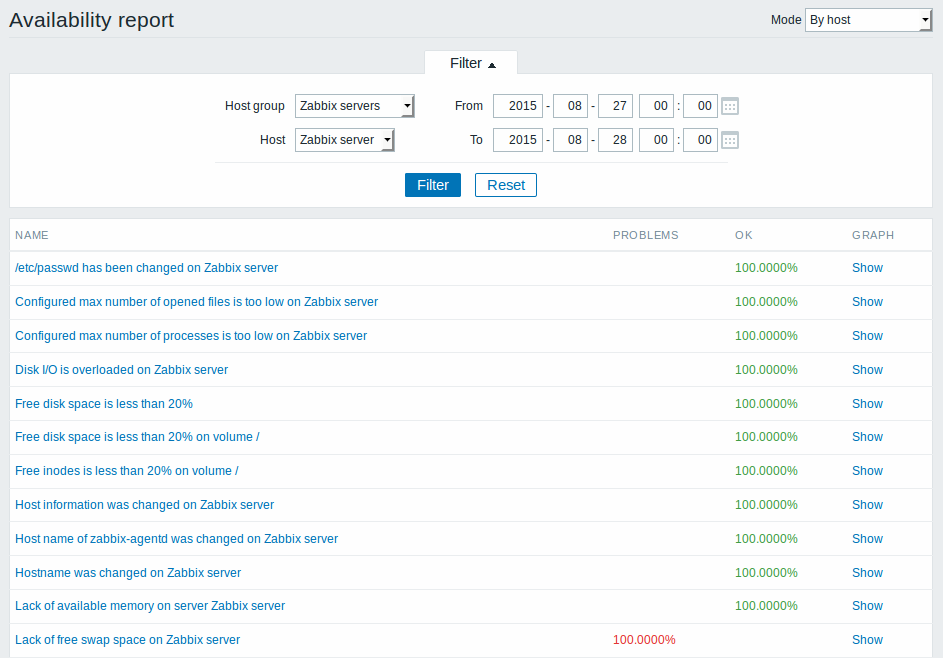
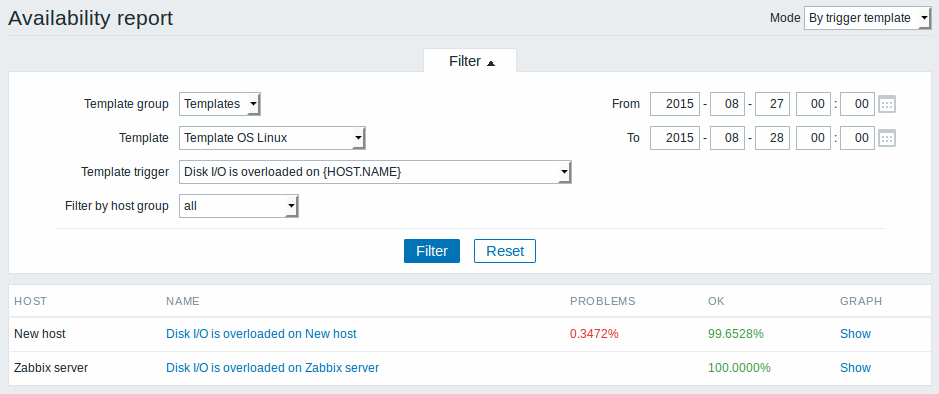
From the dropdown in the upper right corner you can choose the selection mode - whether to display triggers by hosts or by triggers belonging to a template. Then in the filter you can narrow down the selection to the desired options and the time period.
The name of the trigger is a link to the latest events of that trigger.
Clicking on Show in the Graph column displays a bar graph where availability information is displayed in bar format each bar representing a past week of the current year.
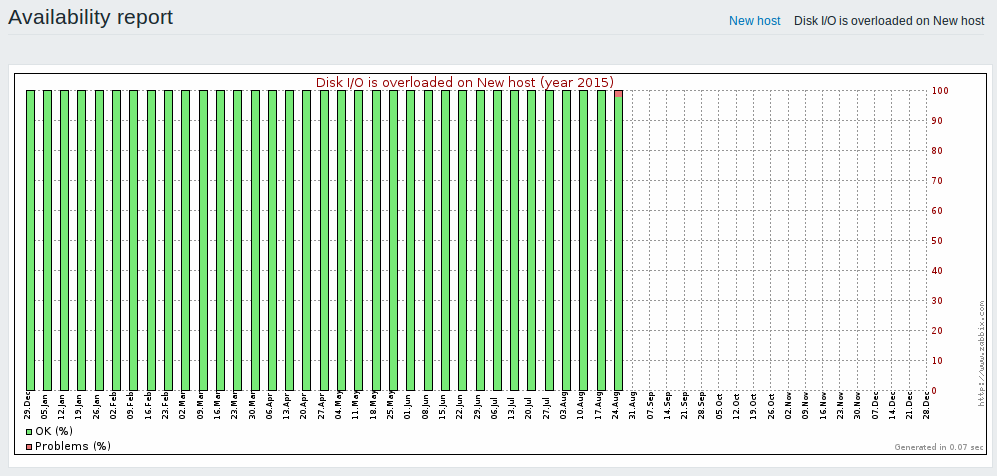
The green part of a bar stands for OK time and red for problem time.