On this page
2 Proxies
Overview
In the Administration → Proxies section proxies for distributed monitoring can be configured in the Zabbix frontend.
Proxies
A listing of existing proxies with their details is displayed.
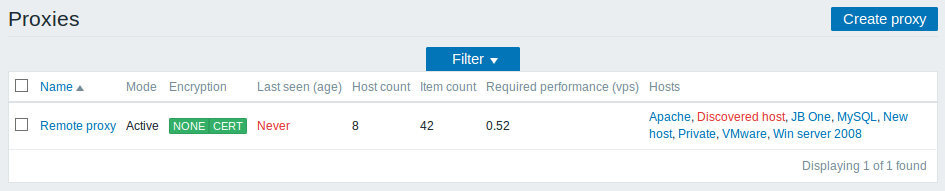
Displayed data:
| Column | Description |
|---|---|
| Name | Name of the proxy. Clicking on the proxy name opens the proxy configuration form. |
| Mode | Proxy mode is displayed - Active or Passive. |
| Encryption | Encryption status for connections from the proxy is displayed: None - no encryption PSK - using pre-shared key Cert - using certificate |
| Last seen (age) | The time when the proxy was last seen by the server is displayed. |
| Host count | The number of hosts monitored by the proxy is displayed. |
| Item count | The number of items monitored by the proxy is displayed. |
| Required performance (vps) | Required proxy performance is displayed (the number of values that need to be collected per second). |
| Hosts | All hosts monitored by the proxy are listed. Clicking on the host name opens the host configuration form. |
To configure a new proxy, click on the Create proxy button in the top right-hand corner.
Mass editing options
Buttons below the list offer some mass-editing options:
- Enable hosts - change the status of hosts monitored by the proxy to Monitored
- Disable hosts - change the status of hosts monitored by the proxy to Not monitored
- Delete - delete the proxies
To use these options, mark the checkboxes before the respective proxies, then click on the required button.
Filter
As the list may contain many proxies, it may be needed to filter out the ones you really need.
The Filter link is available above the list of proxies. If you click on it, a filter becomes available where you can filter proxies by name and mode.