
Sommaire
1 System information
Overview
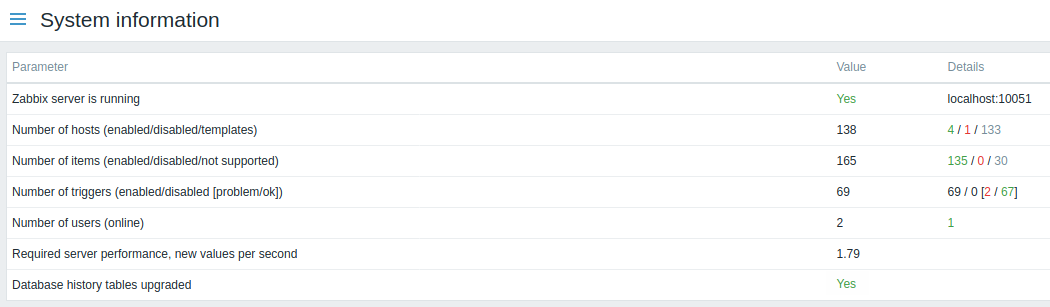
In Reports → System information a summary of key system data is displayed.
This report is also displayed as a widget in the Dashboard.
Displayed data
| Parameter | Value | Details |
|---|---|---|
| Zabbix server is running | Status of Zabbix server: Yes - server is running No - server is not running Note: To display the rest of the information the web frontend needs the server to be running and there must be at least one trapper process started on the server (StartTrappers parameter in zabbix_server.conf file > 0). |
Location and port of Zabbix server. |
| Number of hosts | Total number of hosts configured is displayed. Templates are counted as a type of host too. |
Number of monitored hosts/not monitored hosts/templates. |
| Number of items | Total number of items is displayed. | Number of monitored/disabled/unsupported items. Items on disabled hosts are counted as disabled. |
| Number of triggers | Total number of triggers is displayed. | Number of enabled/disabled triggers. [Triggers in problem/ok state.] Triggers assigned to disabled hosts or depending on disabled items are counted as disabled. |
| Number of users | Total number of users configured is displayed. | Number of users online. |
| Required server performance, new values per second | The expected number of new values processed by Zabbix server per second is displayed. | Required server performance is an estimate and can be useful as a guideline. For precise numbers of values processed, use the zabbix[wcache,values,all] internal item.Enabled items from monitored hosts are included in the calculation. Log items are counted as one value per item update interval. Regular interval values are counted; flexible and scheduling interval values are not. The calculation is not adjusted during a "nodata" maintenance period. Trapper items are not counted. |