
Sommaire
10 Services
Overview
In the Monitoring → Services section the status of IT infrastructure or business services is displayed.
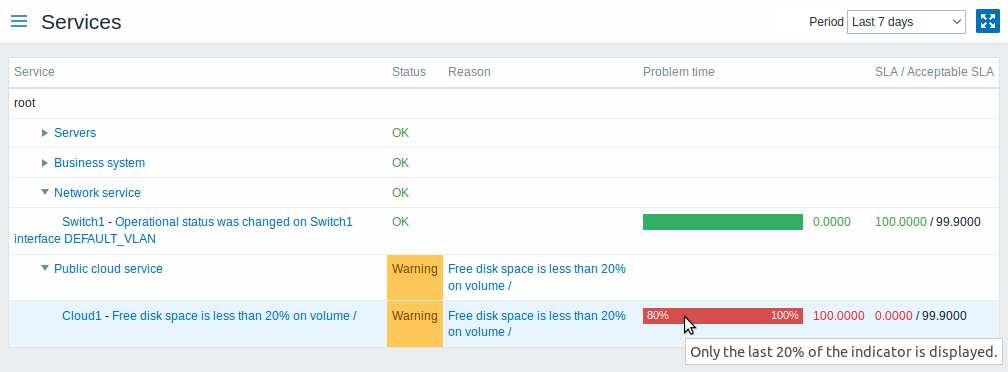
A list of the existing services is displayed along with data of their status and SLA. From the dropdown in the upper right corner you can select a desired period for display.
Displayed data:
| Parameter | Description |
|---|---|
| Service | Service name. |
| Status | Status of service: OK - no problems (trigger colour and severity) - indicates a problem and its severity |
| Reason | Indicates the reason of problem (if any). |
| Problem time | Displays SLA bar. Green/red ratio indicates the proportion of availability/problems. The bar displays the last 20% of SLA (from 80% to 100%). The bar contains a link to a graph of availability data. |
| SLA/Acceptable SLA | Displays current SLA/expected SLA value. If current value is below the acceptable level, it is displayed in red. |
You can also click on the service name to access the Service availability report.
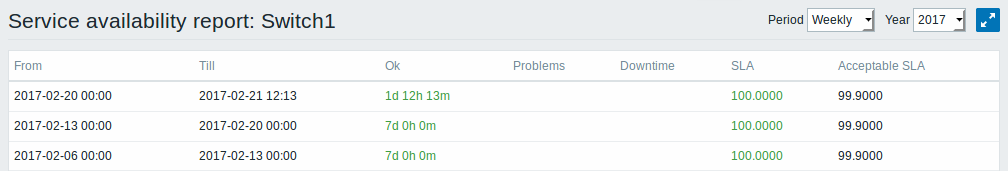
Here you can assess service availability data over a longer period of time on daily/weekly/monthly/yearly basis.
Buttons
View mode buttons being common for all sections are described on the Monitoring page.