
3 Overview
Overview
The Monitoring → Overview section offers an overview of trigger states or a comparison of data for various hosts at once.
The following display options are available:
- select all hosts or specific host groups in the Group dropdown
- choose what type of information to display (triggers or data) in the Type dropdown
- select horizontal or vertical display of information in the Hosts location dropdown
Overview of triggers
In the next screenshot Triggers are selected in the Type dropdown. As a result, trigger states of two local hosts are displayed, as coloured blocks (the colour depending on the state of the trigger):
Note that recent trigger changes (within the last 30 minutes) will be displayed as blinking blocks.
Blue up and down arrows indicate triggers that have dependencies. On mouseover, dependency details are revealed.
Clicking on a trigger block provides links to trigger events, configuration, the acknowledgement screen, URL or a simple graph/latest values list.
Overview of data
In the next screenshot Data is selected in the Type dropdown. As a result, performance item data of two local hosts are displayed.
Only values that fall within the last 24 hours are displayed by default. This limit has been introduced with the aim of improving initial loading times for large pages of latest data. It is also possible to change this limitation by changing the value of ZBX_HISTORY_PERIOD constant in include/defines.inc.php.
Clicking on a piece of data offers links to some predefined graphs or latest values.
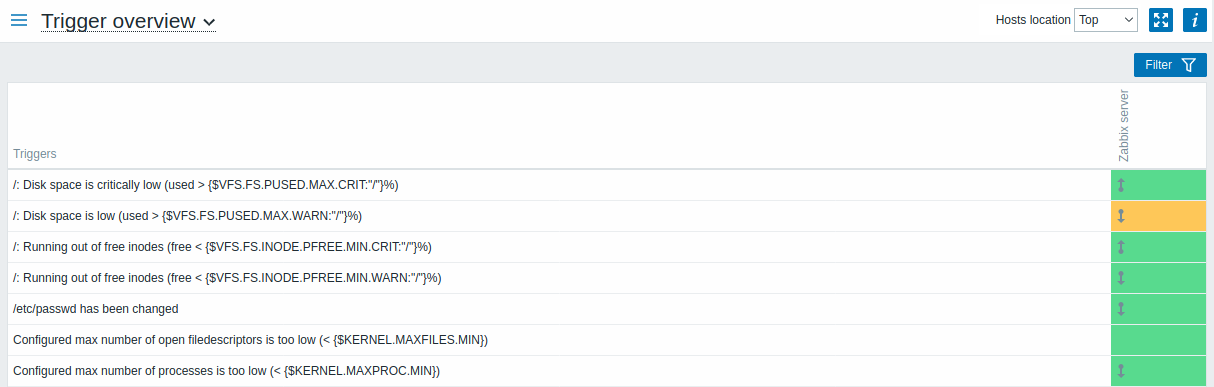
Overview of triggers
In the next screenshot Trigger overview is selected. As a result, the trigger states of a local host are displayed as colored blocks (the color of problem triggers depends on the problem severity color, which can be adjusted in the problem update screen):
Note that recent trigger changes (within the last 2 minutes) will be displayed as blinking blocks.
Blue up and down arrows indicate triggers that have dependencies. On mouseover, dependency details are revealed.
A checkbox icon indicates acknowledged problems. All problems or resolved problems of the trigger must be acknowledged for this icon to be displayed.
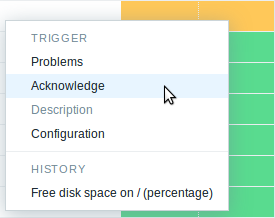
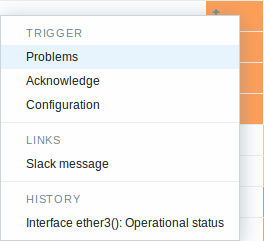
Clicking on a trigger block provides context-dependent links to problem events of the trigger, the problem acknowledgment screen, trigger configuration, trigger URL or a simple graph/latest values list.
Buttons
Button to the right offers the following option:
 |
Additional information on the page content is displayed if you roll the mouse over this button. |
View mode buttons being common for all sections are described on the Monitoring page.
Using filter
You can use the filter to display only the problems you are interested in. For better search performance, data is searched with macros unresolved.
The filter is located above the table.
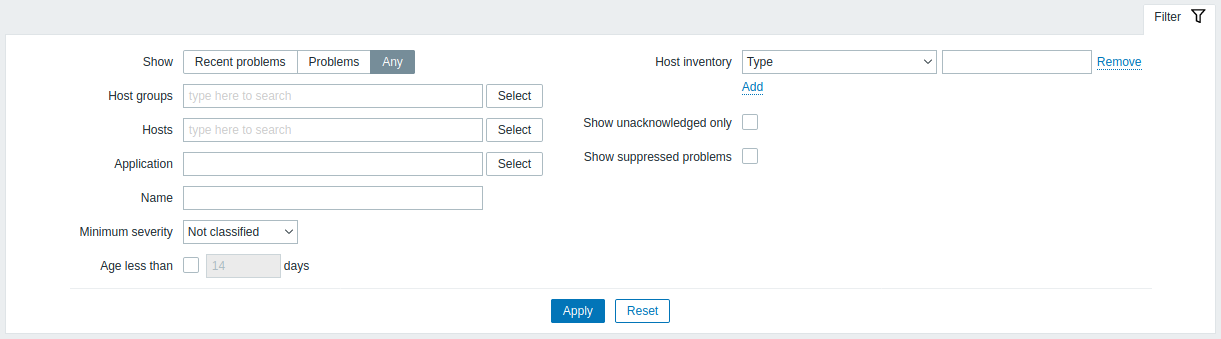
| Parameter | Description |
|---|---|
| Show | Filter by problem status: Recent problems - unresolved and recently resolved problems are displayed (default) Problems - unresolved problems are displayed Any - history of all events is displayed |
| Host groups | Filter by host group. |
| Hosts | Filter by host. |
| Application | Filter by application. |
| Name | Filter by problem name. |
| Minimum severity | Filter by minimum problem severity. |
| Age (less than) | Mark the checkbox to filter by problem age. |
| Host inventory | Filter by inventory type and value. |
| Show unacknowledged only | Mark the checkbox to only display problems which are unacknowledged. |
| Show suppressed problems | Mark the checkbox to display problems which would otherwise be suppressed (not shown) because of host maintenance. |
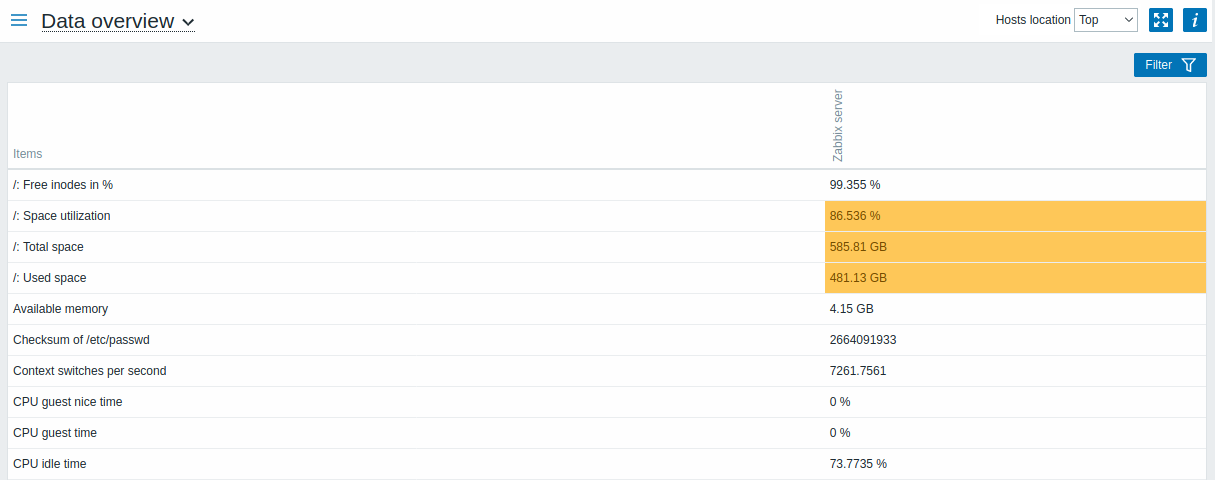
Overview of data
In the next screenshot Data overview is selected. As a result, item data of a local host is displayed.
The color of problem items is based on the problem severity color, which can be adjusted in the problem update screen.
Only values that fall within the last 24 hours are displayed by default. This limit has been introduced with the aim of improving initial loading times for large pages of latest data. It is also possible to change this limitation by changing the value of ZBX_HISTORY_PERIOD constant in include/defines.inc.php.
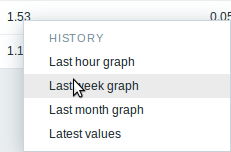
Clicking on a piece of data offers links to some predefined graphs or latest values.
Using filter
You can use the filter to display only the data you are interested in. For better search performance, data is searched with macros unresolved.
The filter is located above the table.

| Parameter | Description |
|---|---|
| Host groups | Filter by host group. |
| Hosts | Filter by host. |
| Application | Filter by application. |
| Show suppressed problems | Mark the checkbox to display problems which would otherwise be suppressed (not shown) because of host maintenance. |