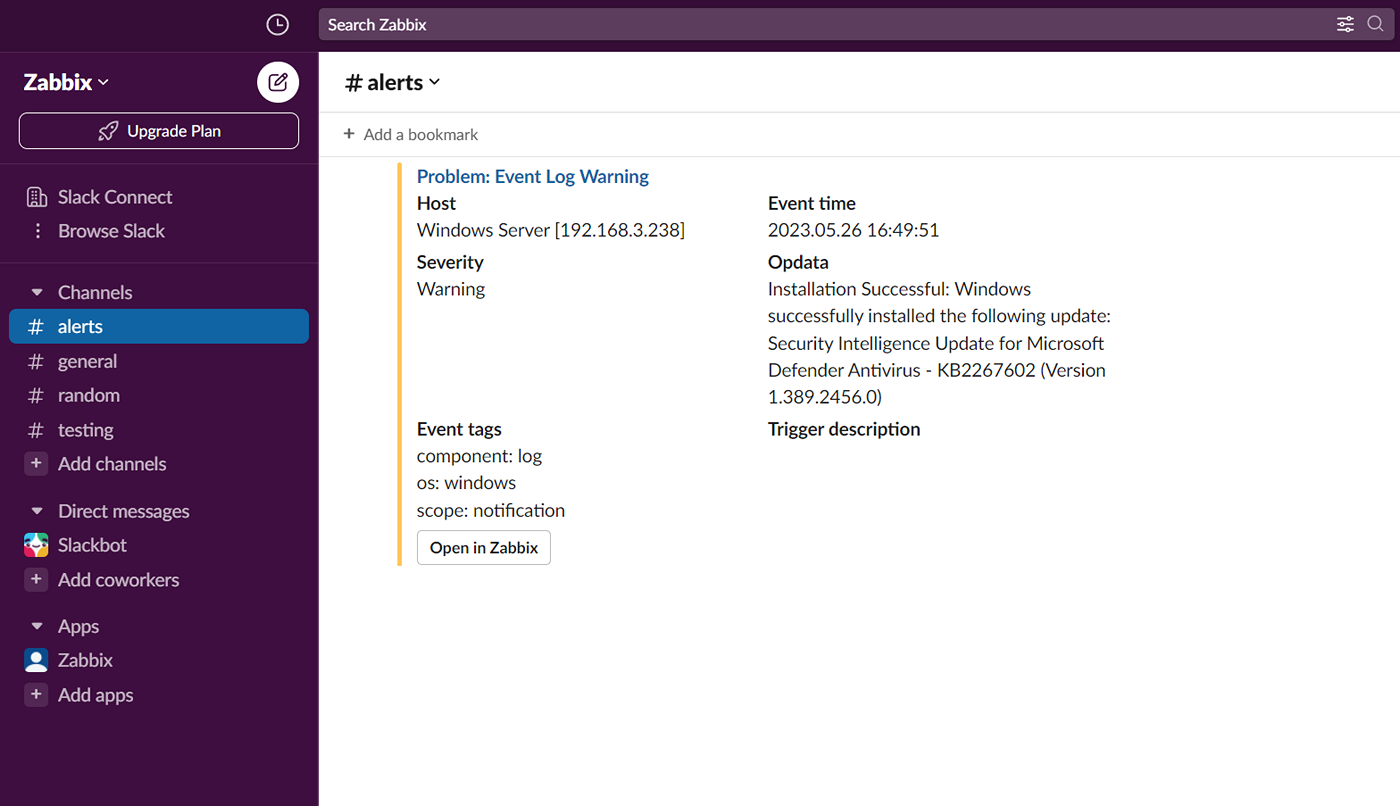
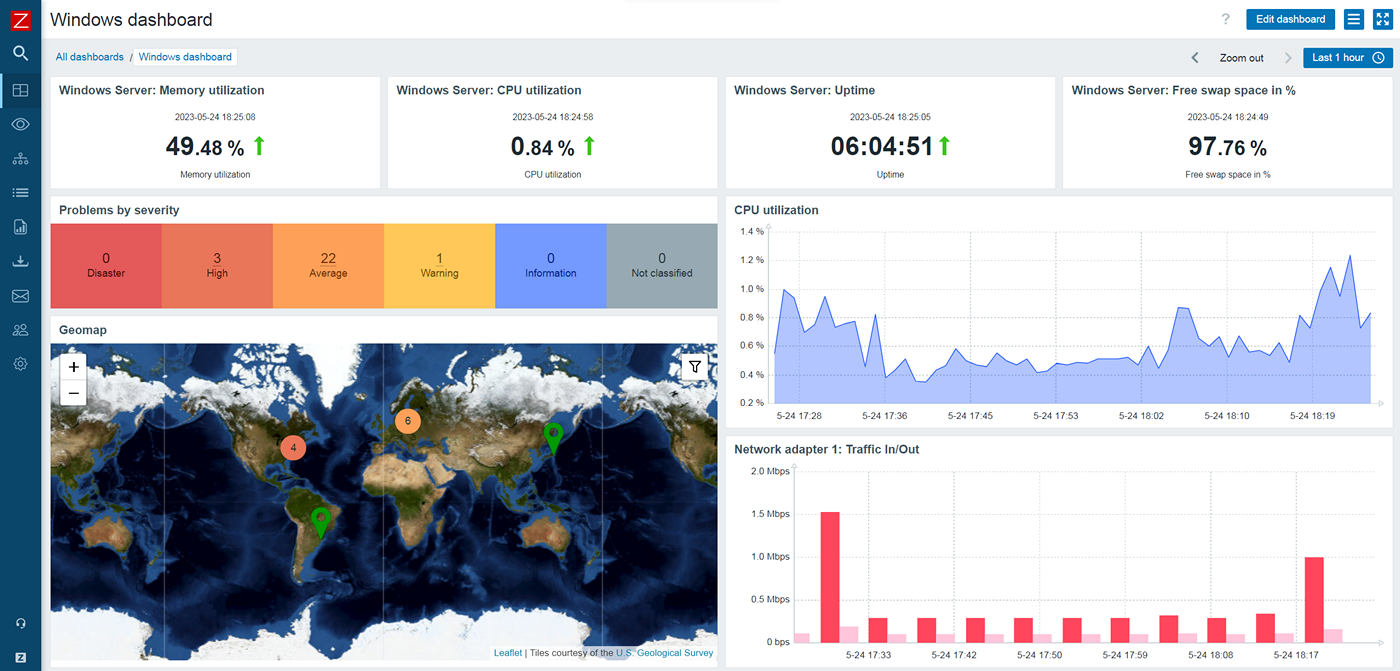
Discover and monitor system resources on any Windows host
and react to any changes performed on the host, gaining real-time information about your Windows environments.
The Windows metrics you can collect with Zabbix include:
Windows service states
Lists of running processes and their parameters
CPU performance and utilization
File system utilization
Memory usage and page statistics
Network traffic, interface information, and discarded/erroneous packages
Physical disk read/write performance and disk queues
System information
Zabbix Agent can be used to
collect OS-level metrics, monitor log files, and extend your monitoring.
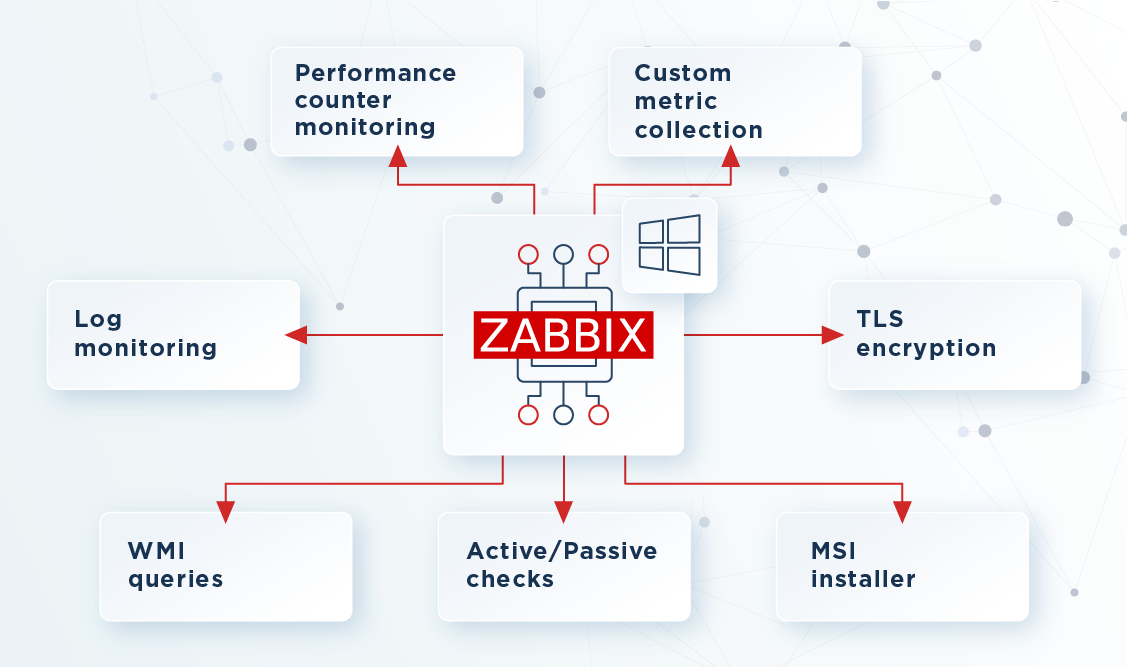
It's easy to extend your monitoring with Zabbix Agent by letting it execute custom commands and scripts. The agent can be deployed with the official Zabbix Agent MSI installer or directly from the command line.
Some of the benefits of deploying Zabbix Agent on your hosts include:
Push or pull metric collection
A negligible performance footprint
MSI or command line installer
Zabbix Agent runs as a Windows service
Zabbix Agent respects service user permissions
Optional PSK or certificate encryption
The ability to define, allow, and deny lists of available metrics
The potential to execute custom commands and scripts
You can also automate the deployment of Zabbix Agent on a large scale by utilizing the official Zabbix Agent MSI packages together with your active directory group policies. This allows you to perform silent Zabbix Agent installs and updates.
By utilizing WMI (Windows management instrumentation) queries, you can monitor the resulting metrics.
WMI is a powerful interface in Windows environments that can
monitor Windows services, system information, and installed software.
In addition, you can define WQL queries and collect multiple Windows metrics in bulk. A single WQL (WMI query language) query can be used to retrieve multiple metrics from the WMI interface, getting rid of potential performance impact that results from the rapid execution of multiple queries.
Enjoy native support in Windows environments
Monitor service and application states
Retrieve device information and status
Automatically filter and discover WMI metrics
Windows performance counters provide an interface for collecting system and application information. By monitoring Windows performance counter metrics, Zabbix users can easily
collect OS-level resource information or application-specific data points.
Performance counters are widely used for services and applications, including:
Microsoft SQL Server (MSSQL)
Microsoft Internet Information Services (IIS)
Microsoft Remote Desktop
And many others
Zabbix - бесплатное программное обеспечение с открытым исходным кодом. Никаких ограничений и скрытых расходов