Acompanhe a integridade e o desempenho da sua rede
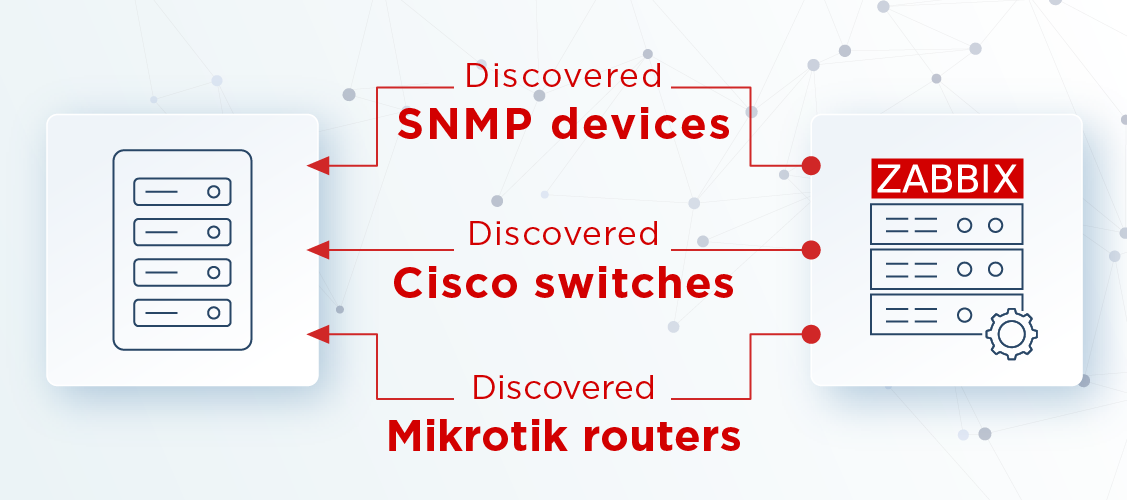
Colete métricas de SNMP ou implante um agente Zabbix para monitorar diversas métricas de rede. Aplique o modelo apropriado em seu endpoint de monitoramento de rede e comece a coletar métricas de rede, incluindo:
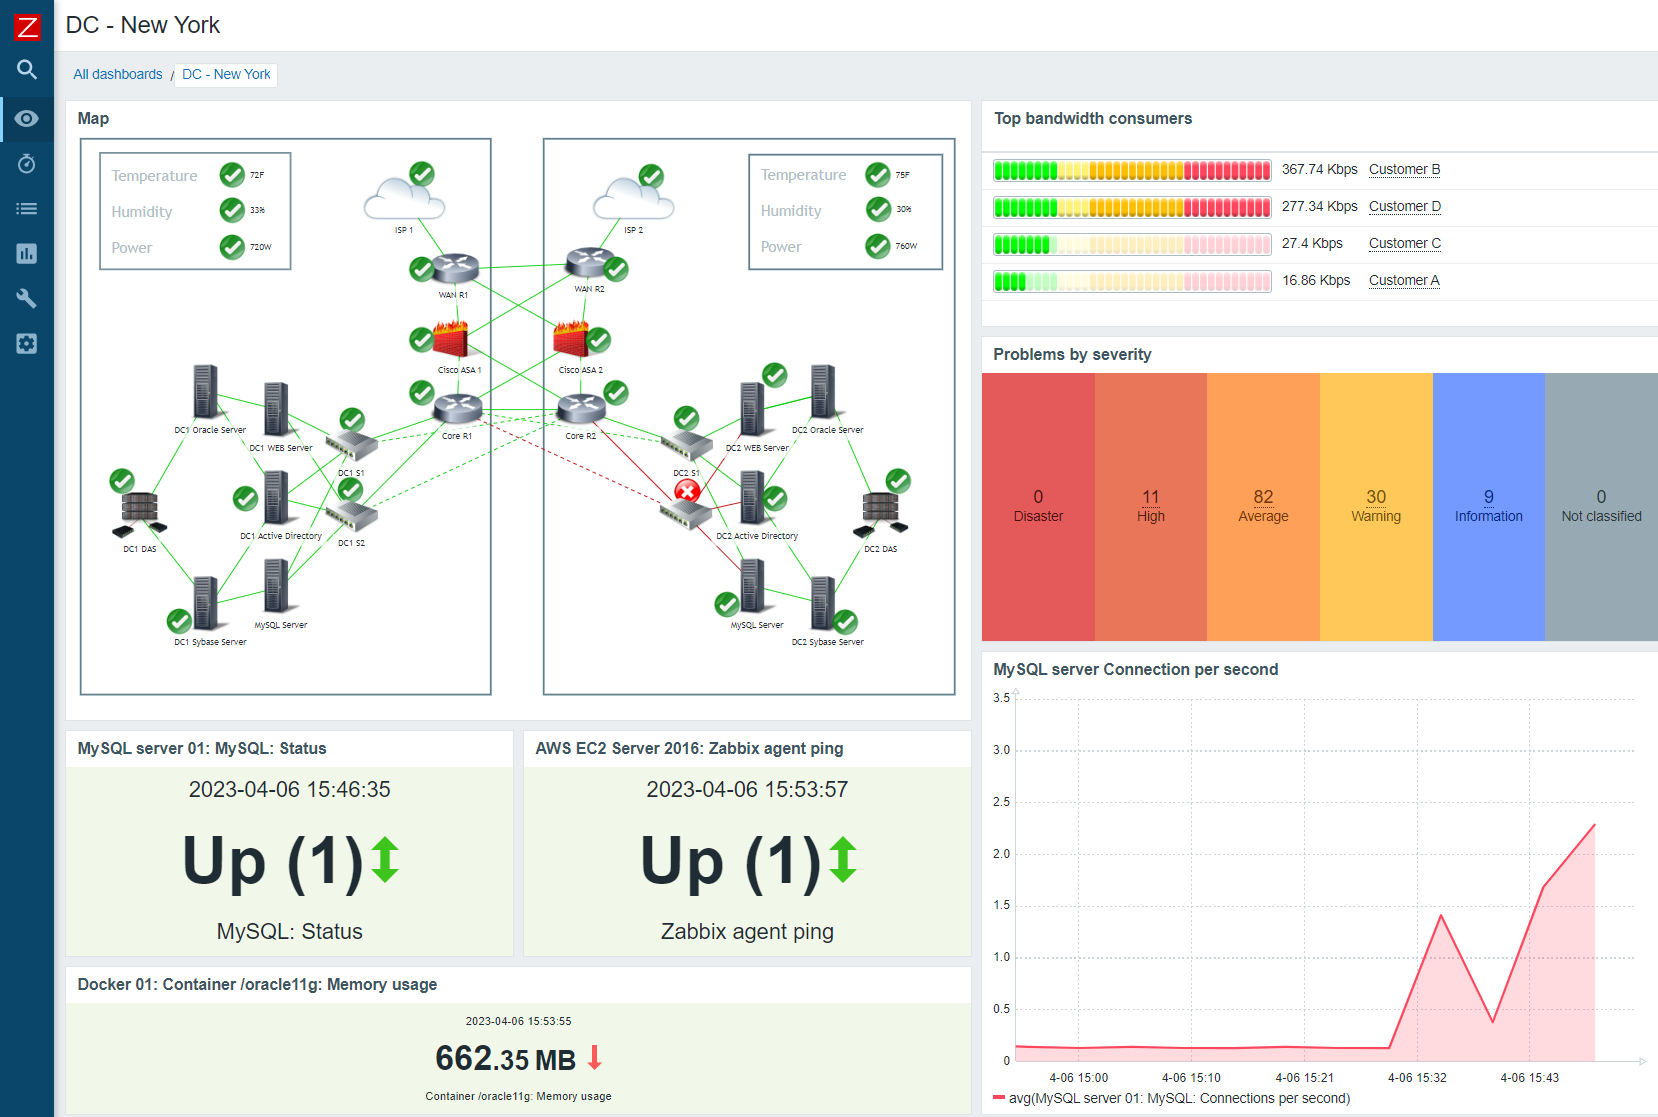
Tráfego de entrada e saída
Uso de largura de banda total
Perda de pacotes e taxas de erro de interface
Número de conexões TCP
Status do link
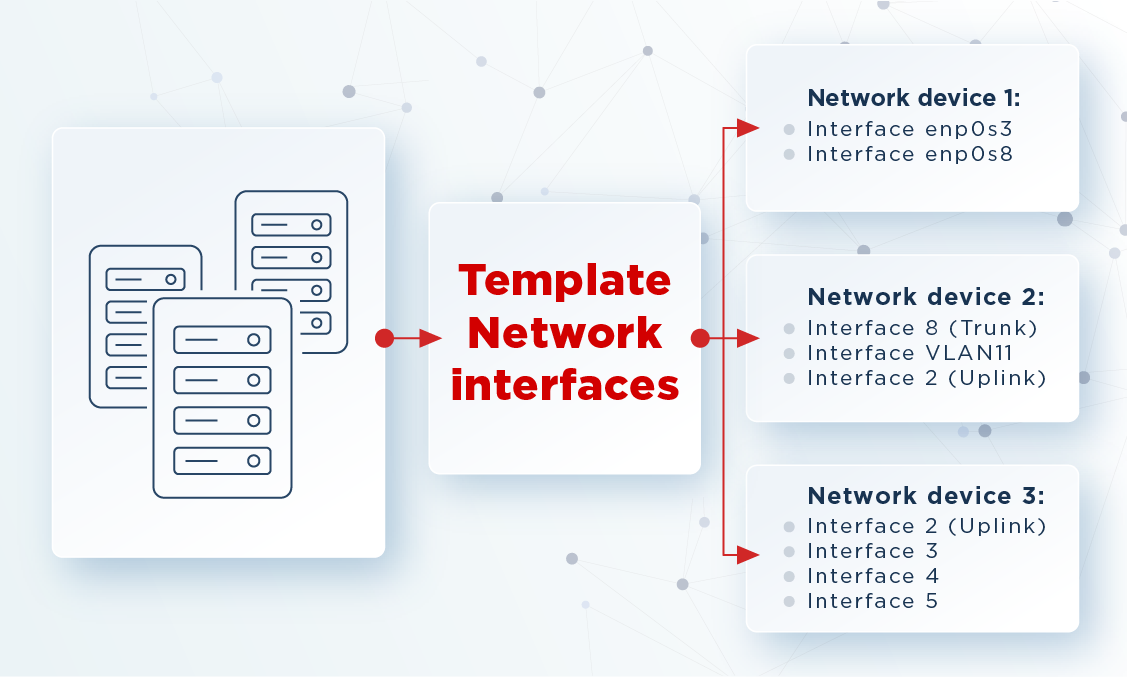
Velocidade e status da interface
Muitas outras métricas SNMP
Zabbix suporta versões SNMP v1, v2c e v3 e coleta de interceptações de SNMP, permitindo compatibilidade com dispositivos legados e modernos.