University of Oslo Case Study
Zabbix is monitoring a heterogeneous infrastructure of the main educational institution in Norway with more than 3,000 servers and services

Being the main educational institution in Norway with almost 30,000 enrolled students, the University of Oslo (UiO) has a heterogeneous infrastructure, with thousands of servers and clients, all kinds of connected devices, different operating systems, multiple locations and hundreds of IT staff.
The case study shows the problems resolved with Zabbix and the challenges of implementing Zabbix as the main monitoring tool at the UiO. For the past year and a half, Zabbix has been helping the IT Center at the UiO to achieve their goals of reaching full automation and delegation of privileges.

The University of Oslo has a highly complex infrastructure with around 3,000 servers to keep track of (both Linux and Windows), 13,000TB of storage, more than 1,500 databases of all kinds, 2,500 routers, switches and WiFi access points and more than 26TB of data going in and out of its network every day.
During the last two years, the work has been focused on 4 areas that needed to be improved and upgraded. Firstly, the way the information on what is running in their infrastructure is being processed. Secondly, the way the infrastructure is monitored. The third matter of concern was trending. And the final one was log analysis.
“Using different monitoring solutions in 2014, we faced the fact that some of them were no longer able to scale, and it was difficult to maintain and configure them”, says Rafael Martinez Guerrero, a Chief Engineer at the University of Oslo. In addition, there was no integration between them and the environment where they were running. That is when the UiO decided to implement Zabbix to try to improve how the IT center was monitoring the IT infrastructure.
Having around 300 people involved in IT administration, development and support, there were many obstacles to overcome to have a central system in charge of the monitoring of the whole IT infrastructure.
“After the requirements were set and the decision to change how we were doing monitoring was made, we put a high grade of automation as the main priority, in order to increase efficiency of IT administration without doing too much configuration”, says Rafael.Apart from the necessity of the smooth integration and automation through an API, the list of desired functionalities was long and ambitious. Among the most important features were distributed monitoring for scaling the system and being able to implement monitoring for some of the restricted areas in their network. Advanced access control system with Zabbix roles and user groups was essential to control how over 300 people were going to operate within the system. Avoiding unnecessary alarms and the ability to perform root cause analysis of problems were also really important in this project.
Rafael comments on the choice to use Zabbix: “We did an in-depth research and comparison of capabilities of Zabbix and this assured us that the built-in API and events generator, the advanced core functionality to process data and an advanced access control system would help us to achieve our goal, in spite of some skepticism of the changes we were proposing”.
Zabbix is running on the current infrastructure available at the UiO, on virtual machines running Red Hat Linux 7, using the PostgreSQL database as backend, and with CFEngine orchestrating the whole configuration of the system.
The UiO is using dedicated servers for all of the Zabbix components in the system. Apache web servers operate the Zabbix dashboard and API, a dedicated database server and Zabbix server in the core of the system and multiple proxies at multiple locations of the infrastructure to gather measurements from the components they are monitoring.
Using Zabbix proxies in active mode has been beneficial both for security and for performance, as fewer resources are needed for inquiries to gather data from Zabbix agents. To achieve the best performance, the update interval for different checks ranges from 30 seconds to several hours. “For testing purposes, in the beginning, we activated the monitoring of all the disks with checks at every minute generating 3,000-4,000 values per second” says Rafael. To allow for scalability, update intervals were optimized to match real world requirements.
Overview of the current system: 3,000 servers, 350,000 items, 200,000 triggers, 350 users with access to the system. The IT center at the UiO relies heavily on host groups functionality in Zabbix to allow complex roles with different permissions, allowing separate users to have their own specific templates for their configuration options.
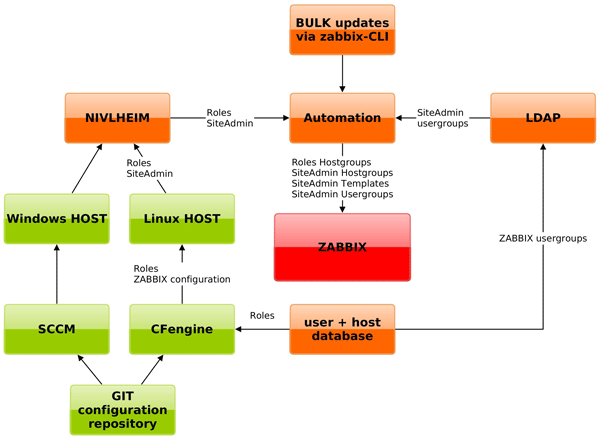
At the university, they have developed a unique software called Nivlheim, used to get configuration data and system information from all of the hosts of the university. All the information gathered with the help of Nivlheim agents is indexed and stored on a Nivlheim server and can be accessed via REST API.
The process of adding new machines or deleting the old ones is fully automated. Thanks to the information available through Nivlheim, new host groups for roles and owners, and templates are automatically created in Zabbix, and new devices are added quickly and effortlessly. The devices that cannot run the Nivlheim agent are updated with the help of Zabbix-cli, a terminal client also developed at the UiO.
There were some unforeseen problems when first deploying Zabbix, however, they were soon solved, as the main cause of the issues was SELinux running on the Zabbix machines. After taking this into account, everything went on smoothly.
Another critical aspect of the Zabbix implementation was the optimization of performance. In the beginning, the database CPU use was constantly under high load. After profiling the system calls, the performance was optimized and problems with unexplained CPU use were gone.
After moving the current system to a new VMware cluster, the CPU use got even better. “So we have learned the lesson that in virtual environments one should be very careful not to over-allocate resources”.
Rafael stresses that “it is true when they say that with great power comes great responsibility. Although automation is great when it comes to fixing things very fast, it can also destroy things very fast”. After having extensively tested their automation scripts, they did not find a corner case bug that triggered in an unexpected situation, and this brought the whole system down, losing all the settings and definitions in Zabbix. Still, after understanding the reason of the problem and fixing it, due to automation everything was recreated very fast without having to do much work.
To allow much easier access to data from Zabbix for their users, the UiO has worked on integrating Zabbix with various other systems. One of the solutions used is the Grafana-Zabbix plugin for accessing Zabbix data from Grafana, thus allowing people to create their own dashboards integrating data from Zabbix with data from other systems.
Alarm information from Zabbix is also sent to ELK, so people are able to access the alarm information via Kibana dashboards and integrating it in dashboards consisting of data from numerous systems and correlating Zabbix data with log information from other systems.
As you see, Zabbix allows easy integration with various systems, and its data can be used in collaboration with other tools for creating a solid IT infrastructure overview hub.
As always, the IT center at the UiO is constantly working on improvements for the system to find new ways of automating tasks and tuning alarm generation. The goal is to have a highly effective central monitoring system with relevant alarms that helps them to deliver high quality services for the university.
The University of Oslo is the oldest and largest educational institution in Norway, having almost 30,000 students from all over the world. The UiO includes 8 faculties, 2 museums and 19 libraries.
Having been founded in 1811, the UiO has been preparing the best specialists in the fields of Law, Mathematics and Natural Sciences, Medicine, Humanities, Theology, Social and Educational Sciences. Five scientists affiliated with the University of Oslo have been awarded Nobel Prizes.
Fill out this Questionnaire or contact our Marketing Team for further assistance.
Zabbix is a professionally developed open-source software with no limits or hidden costs