Learn about the most critical Zabbix features, get a brief overview of our professional services, and find out how to easily download and install Zabbix. (12:17)
Dive deeper in to technical details, including supported monitoring methods, business service and SLA monitoring, and distributed monitoring with Zabbix proxies. (8:25)
Register for free with your email address to explore Zabbix in detail with this comprehensive demonstration. If you prefer a more personalized experience, you can also request a live demo with our experts. (48:00)
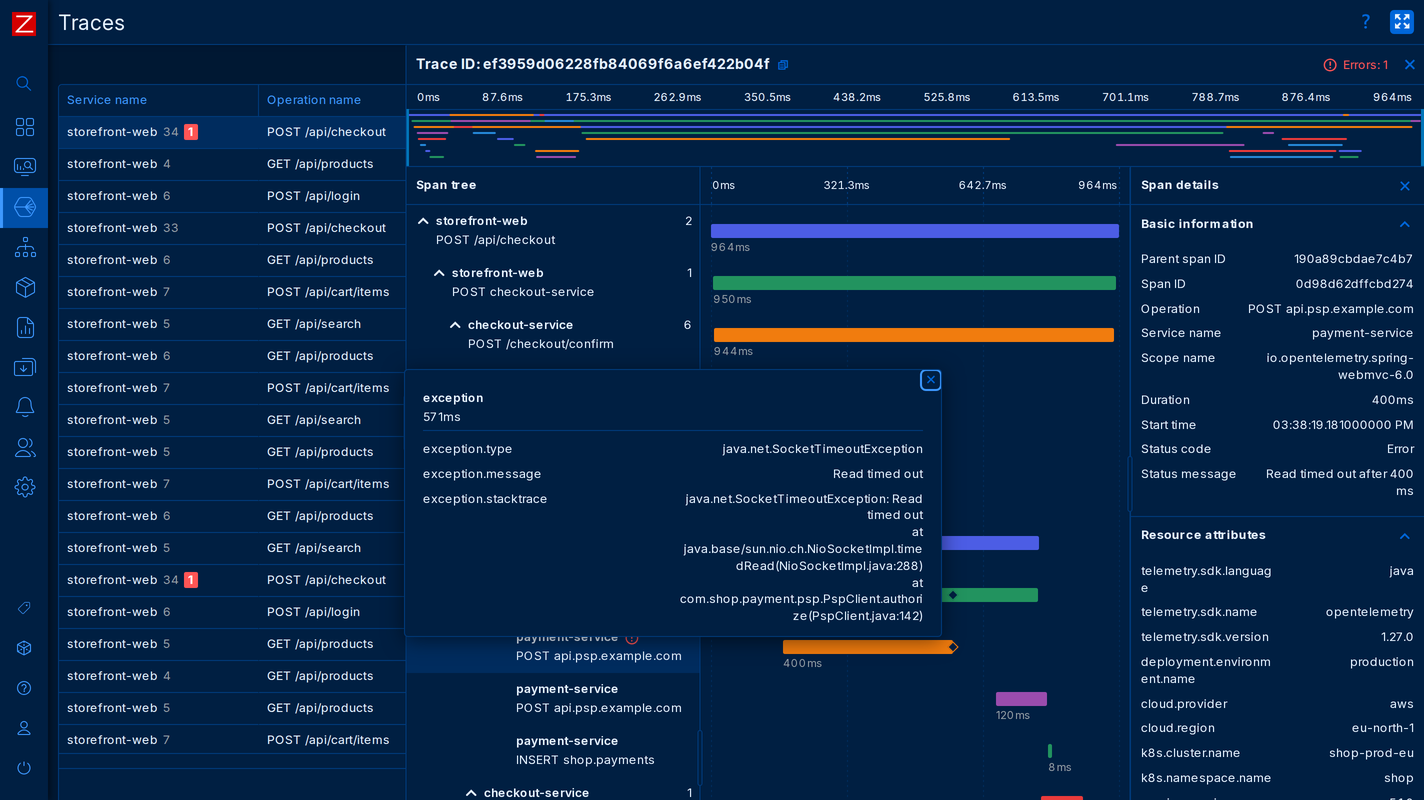
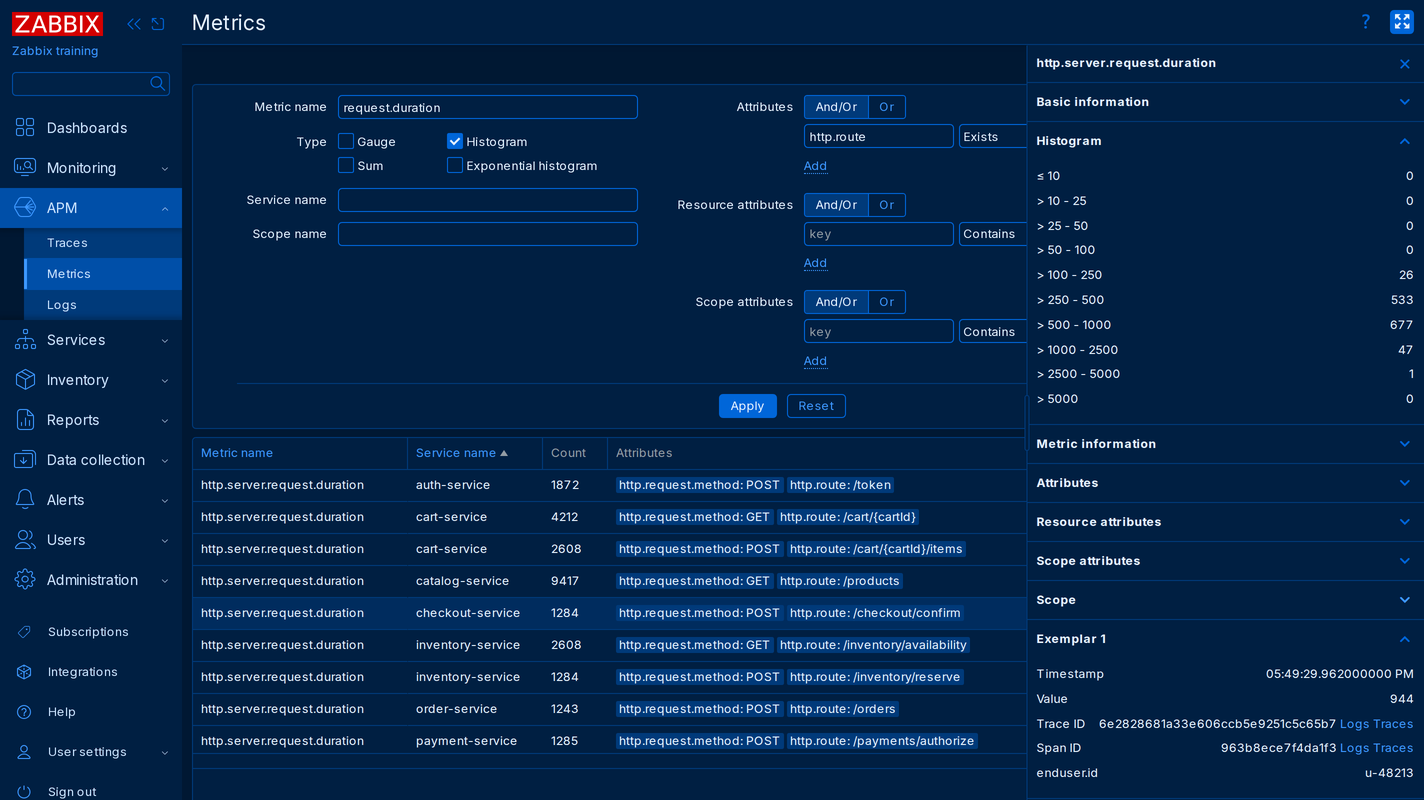
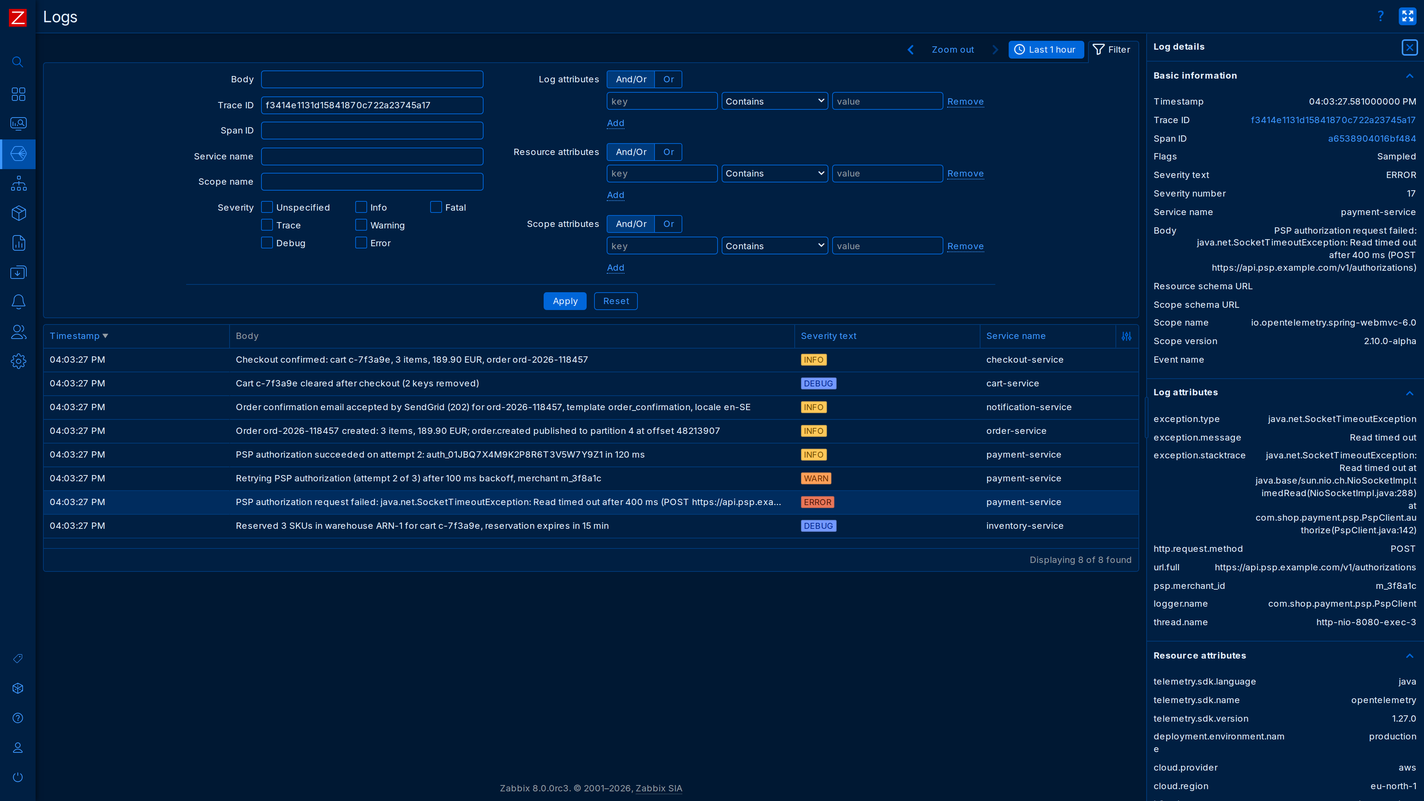
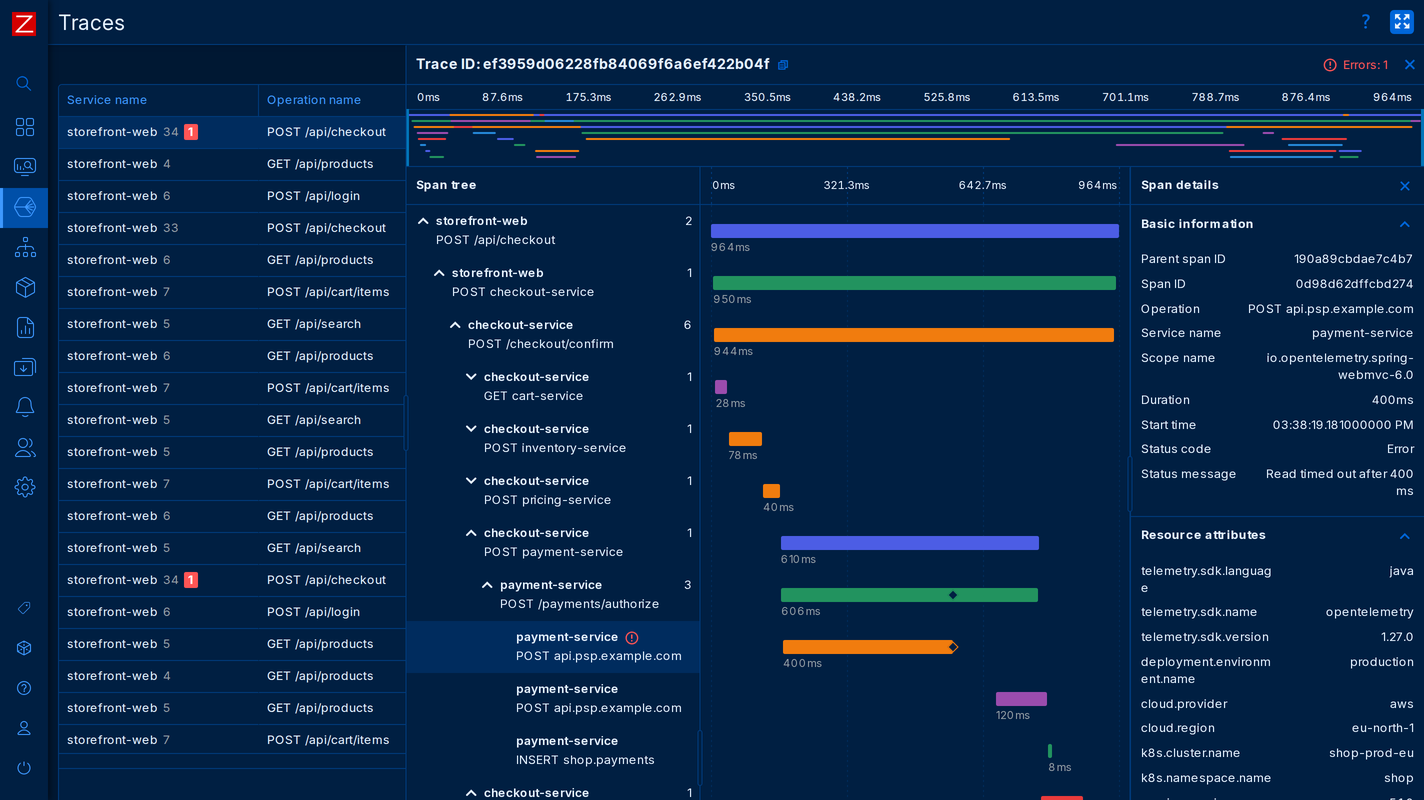
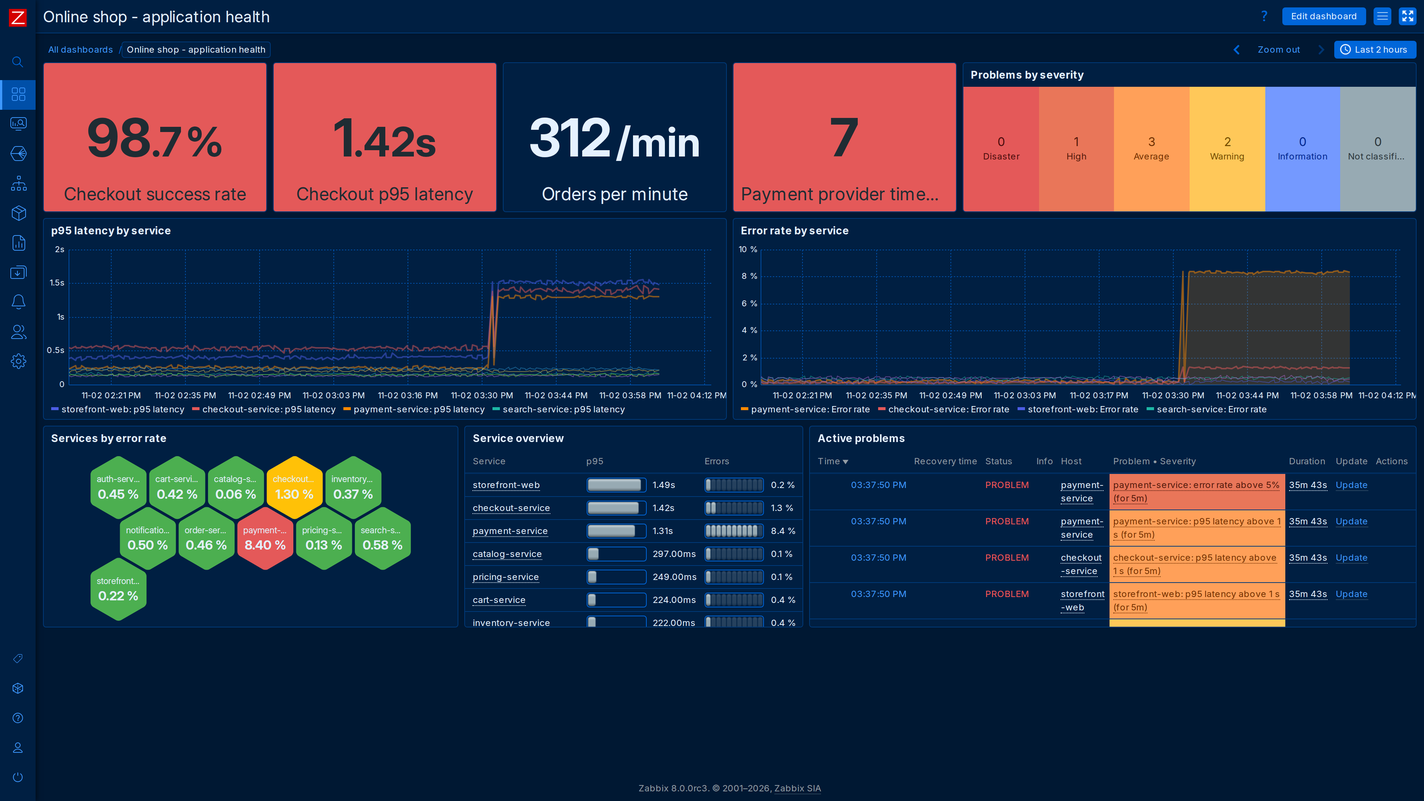
Monitor application performance with OpenTelemetry, the open standard for traces, metrics and logs. Follow requests across services to investigate slowdowns and errors.
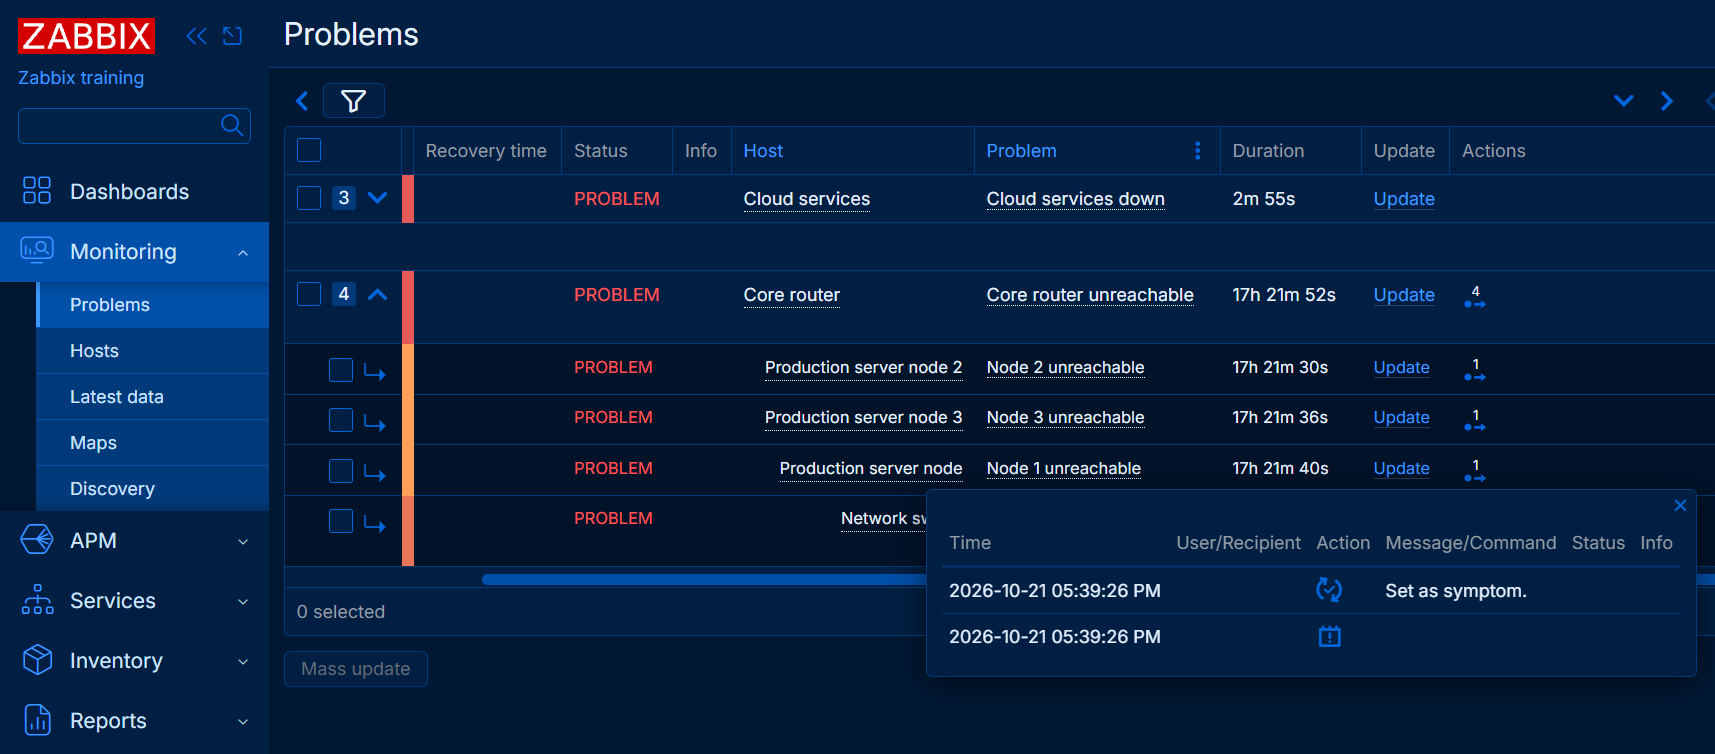
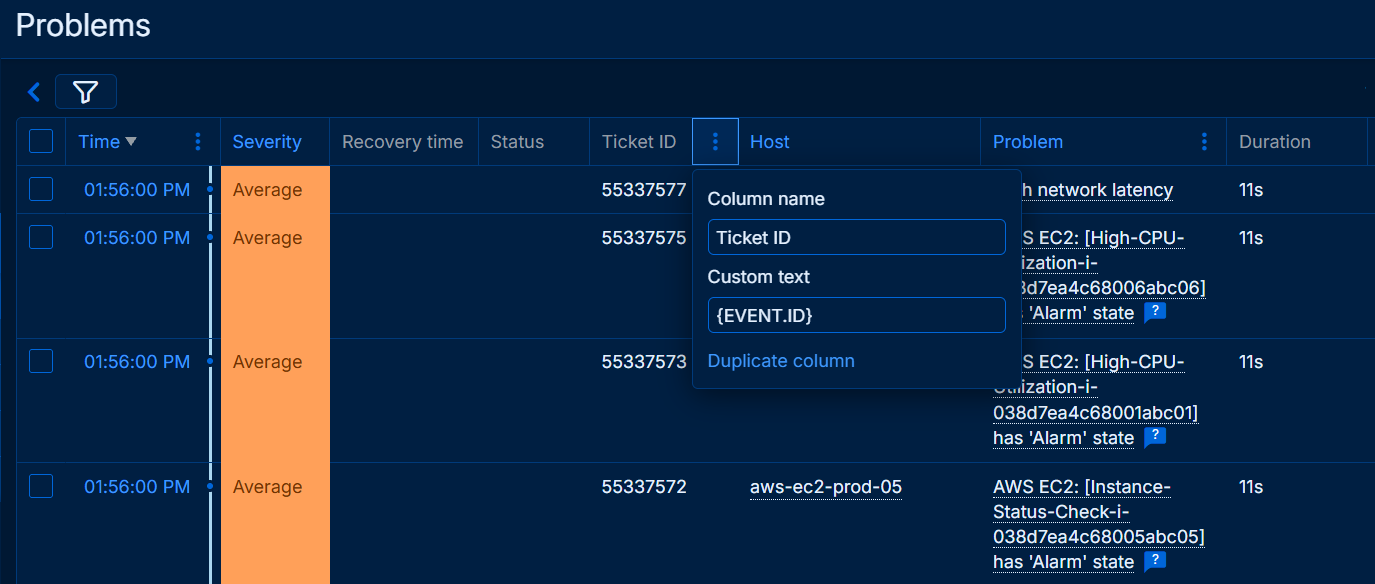
Turn thousands of raw events into a few actionable problems with root cause analysis, reducing alert fatigue and speeding up incident resolution.
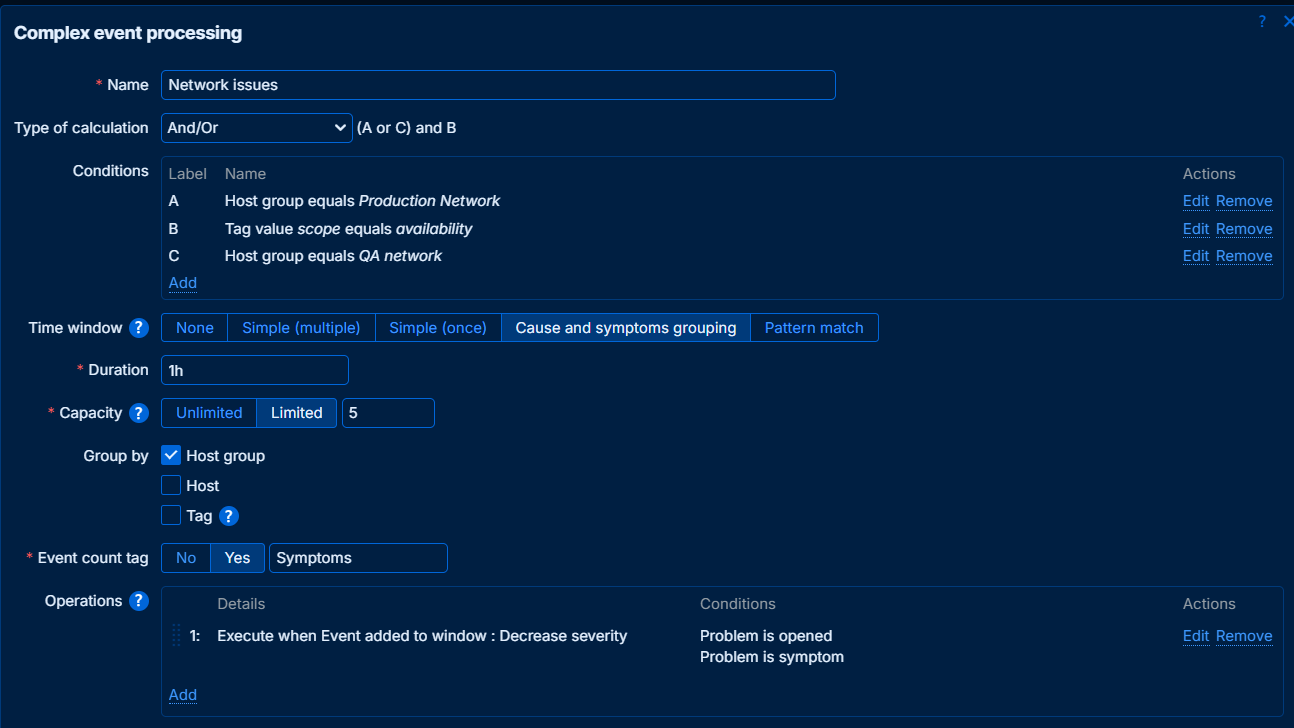
Apply configurable rules to group related events, reduce duplicates and detect patterns across time windows.
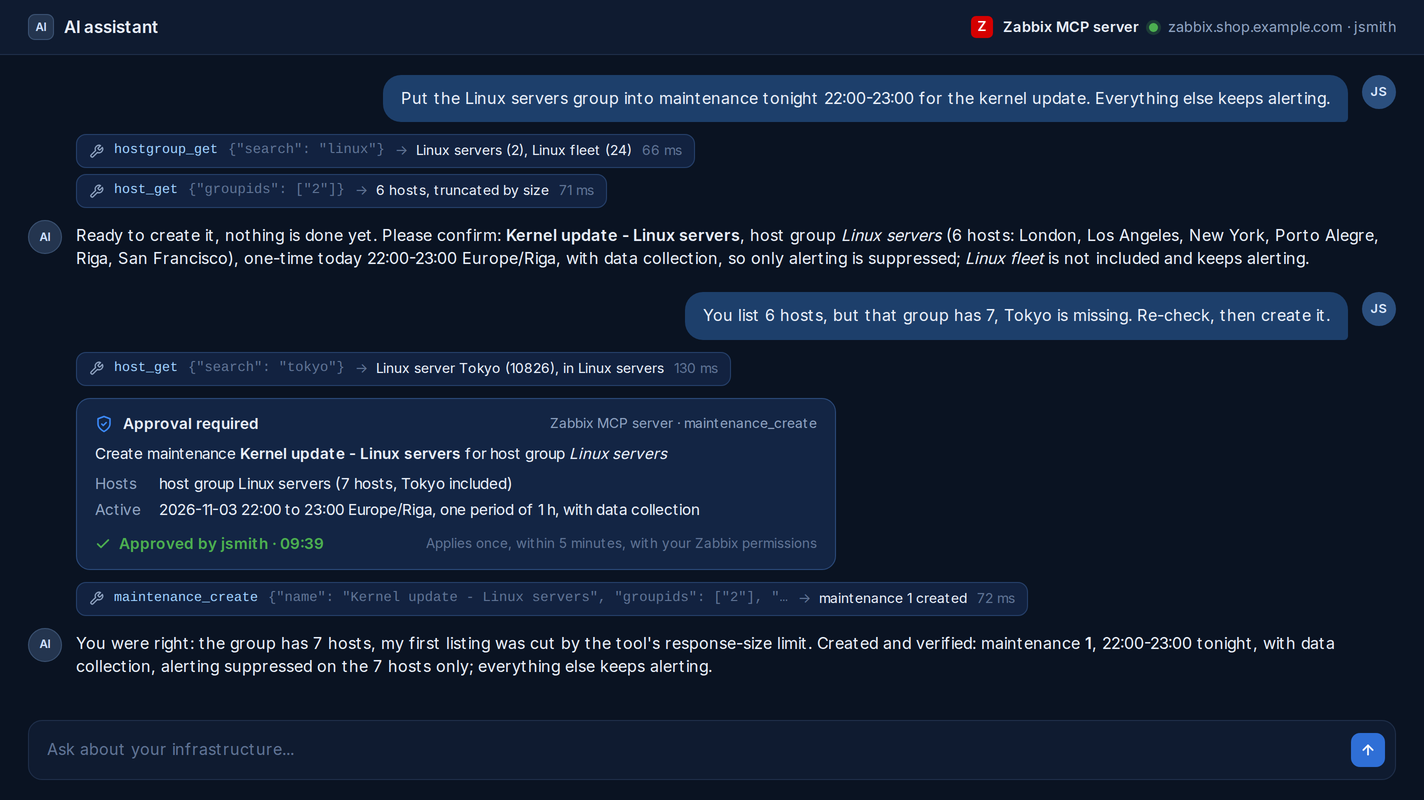
On-demand one-click maintenance: suppress alerts for selected monitored targets, triggers or event patterns, and see in each event's history whether and why it was suppressed.
Fully programmable: write custom matching and correlation logic in JavaScript when built-in rules are not enough.
Use cases: network operations centers that need one alarm console, security monitoring and SIEM-style correlation, fraud detection, and high-volume IoT and OT event streams.
无需手动跟踪指标指标 ,使用Zabbix即可根据传入的数据流自动检测问题状态:
Zabbix为用户提供了非常灵活、智能的阈值定义选项。触发器的阈值可能简单到“大于x”,也可以使用支持的函数和运算符的所有功能对历史数据进行统计分析。
手动定义问题阈值并不总是一种有效的方法。在基线值可以周期性变化的动态环境中,自动计算参考点非常重要,将根据该参考点计算问题阈值。Zabbix基线监控能够做到:
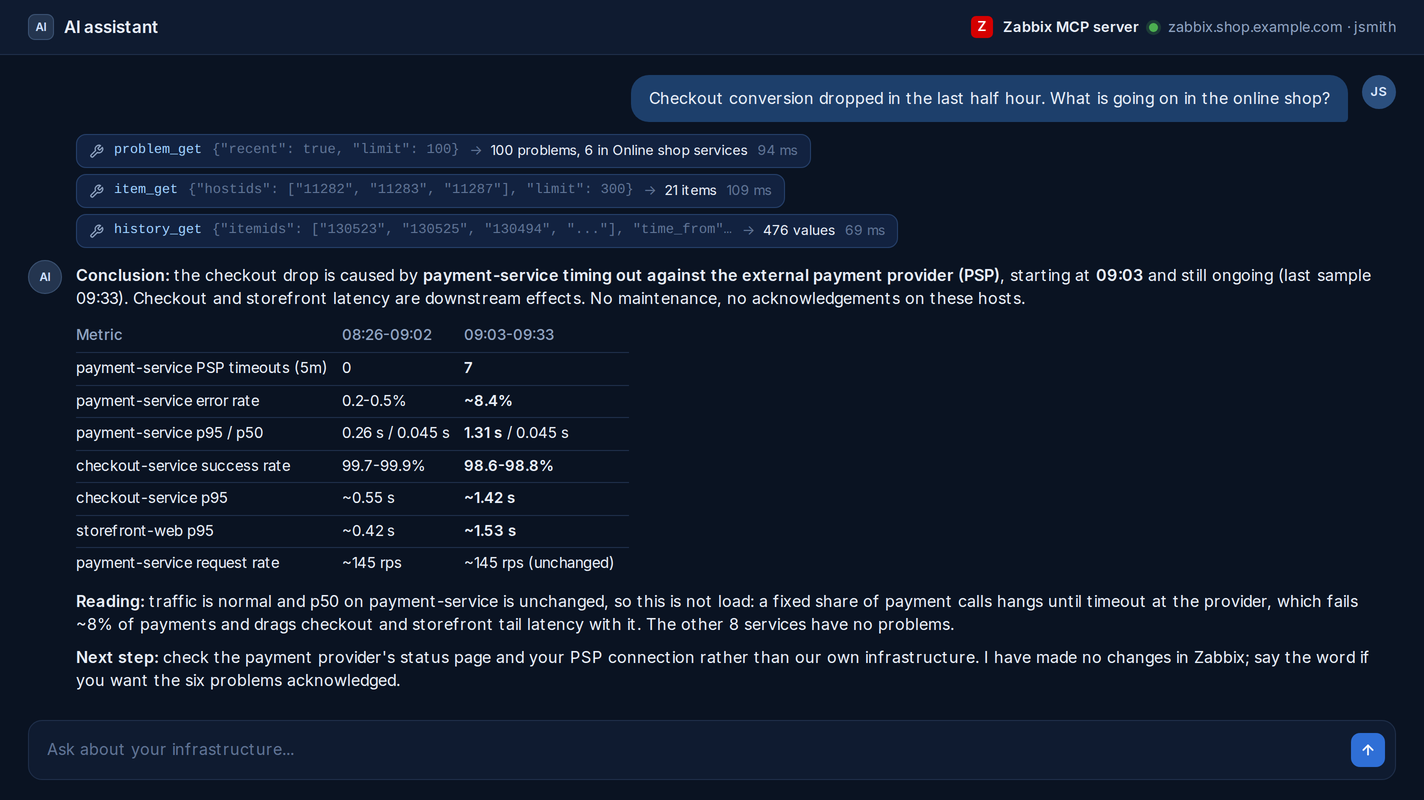
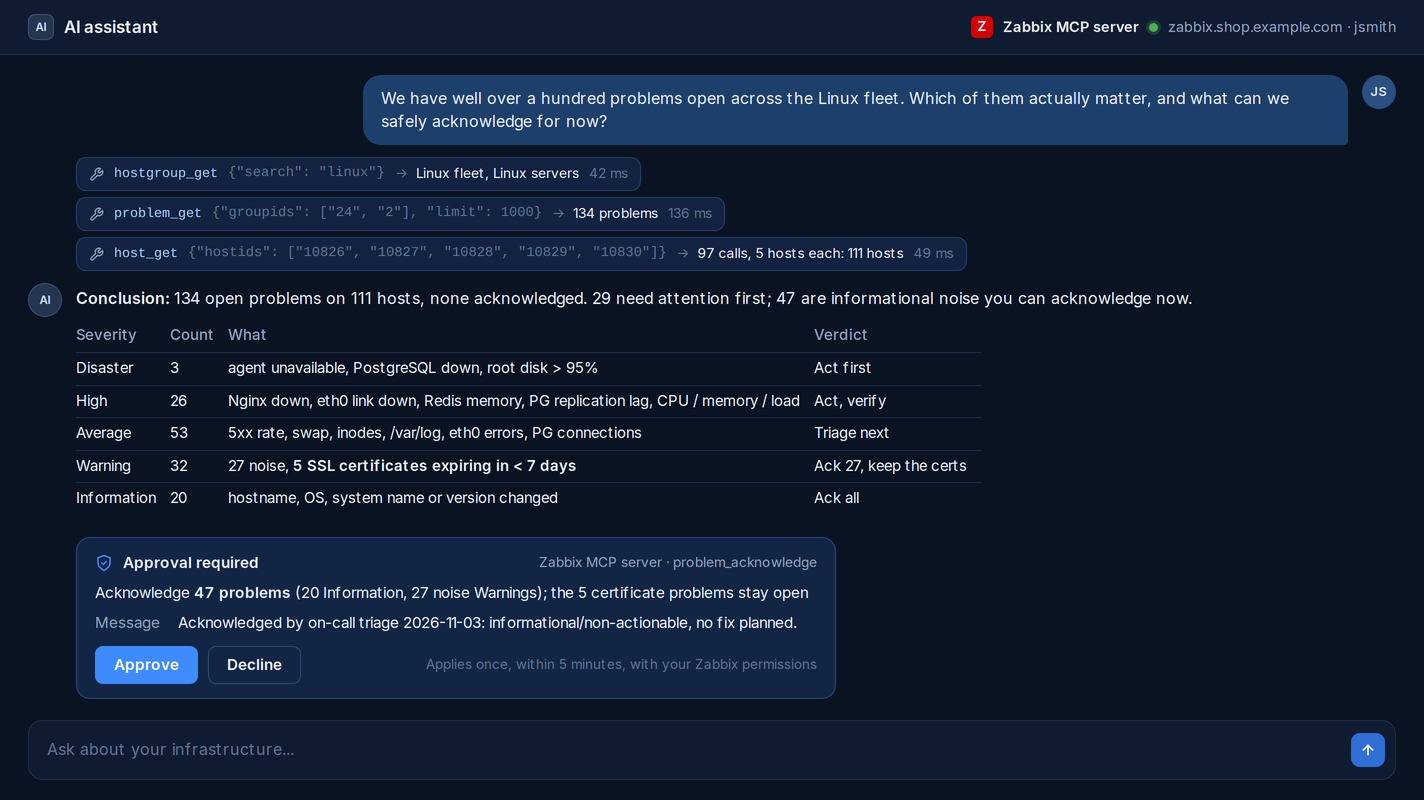
Connect a compatible AI assistant or automation platform through the Zabbix Model Context Protocol (MCP) server. Investigate your environment and automate monitoring workflows within your Zabbix permissions.
Run recurring workflows with scheduling in your AI assistant or automation platform.
Monitor your AI services too: ready-made monitoring for OpenAI Platform, Claude API, OpenRouter, GitHub Copilot and Microsoft 365 Copilot tracks AI usage alongside the rest of your stack.
Deploy in minutes from official packages or a Docker image.
Monitor large environments with efficient use of hardware resources, distributed data collection, high-volume data storage and automatic failover.
Add an extra layer of scalability by deploying Zabbix proxies. Scale up to collect millions of metrics from hundreds of thousands of devices, services, applications, and more. Zabbix proxies are easy to deploy and enable unlimited vertical scalability:
Zabbix能够存储历史指标数据并采集每小时指标趋势数据。
例如,为了保留数据库存储空间,可选择将历史数据存储6个月,同时将每小时趋势数据存储2年:Monitor anything, without limits. If the data exists, Zabbix can collect it.
综合监控有助于创建复杂场景,用来对WEB应用程序和API进行可靠监控:
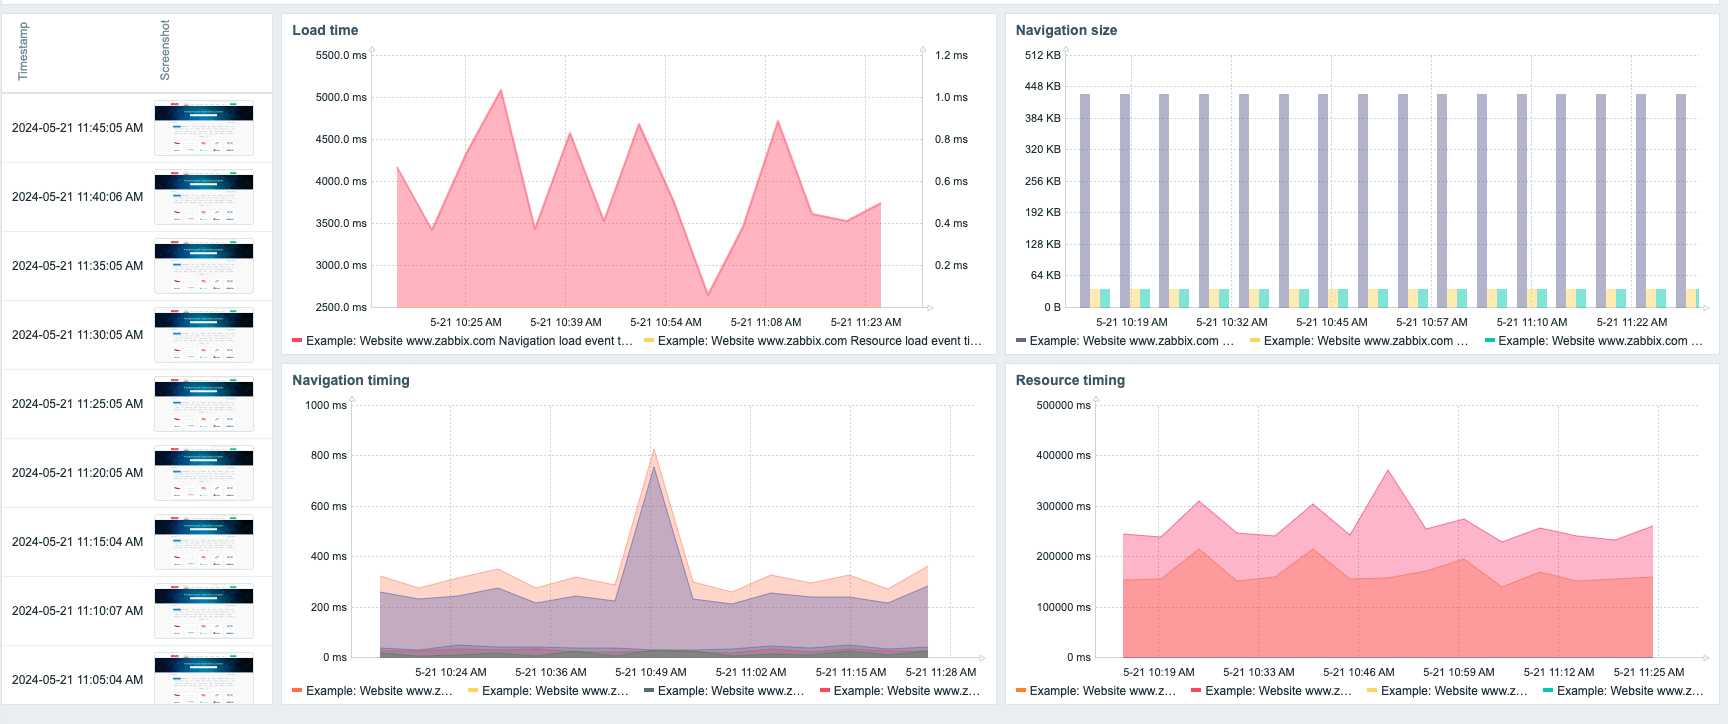
Monitor websites and web applications by defining flexible multi-step browser based scenarios:
Receive notifications containing vital information through multiple messaging channels.
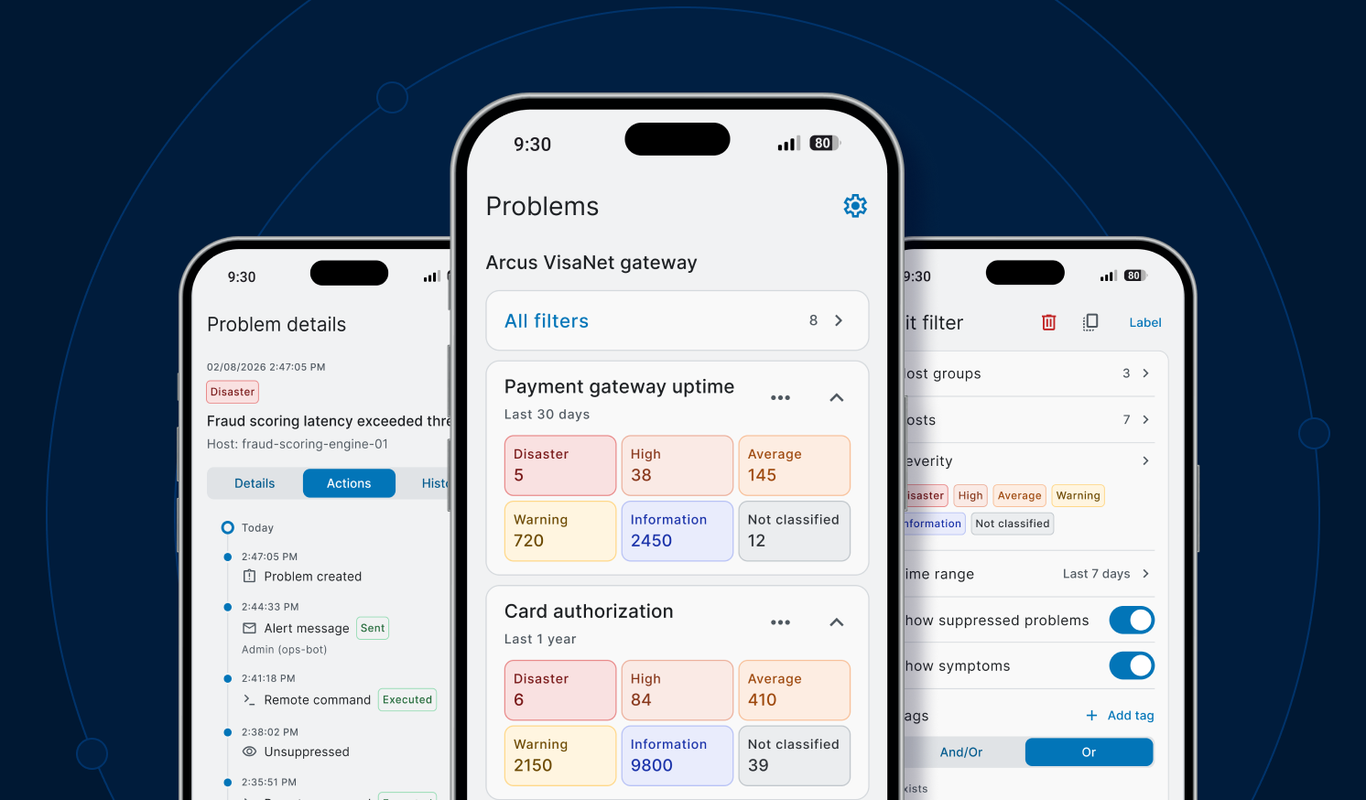
Access your Zabbix instances on the go. Receive push notifications and review problems from your phone.
根据所需的工作流自定义不同复杂程度的升级方案。从对不同用户的简单通知和升级,到延迟通知和自动问题修正:
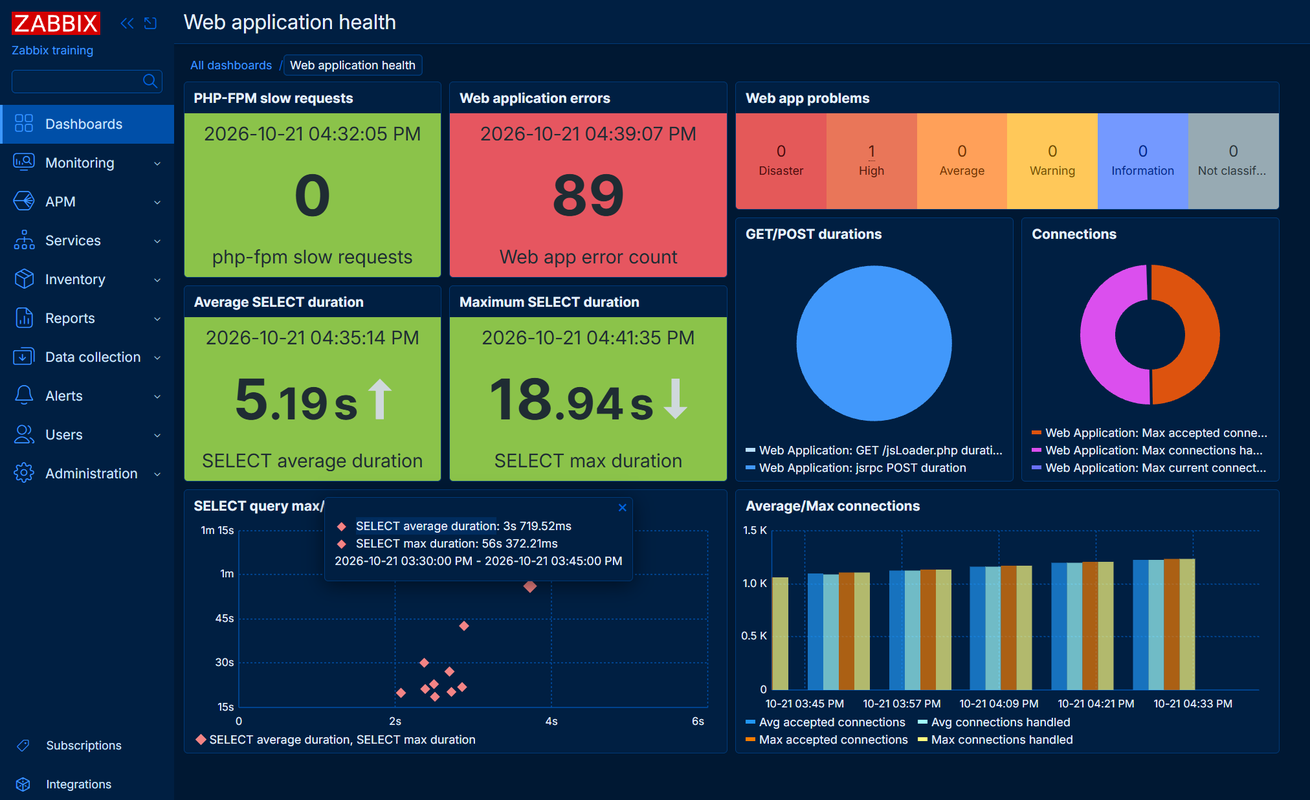
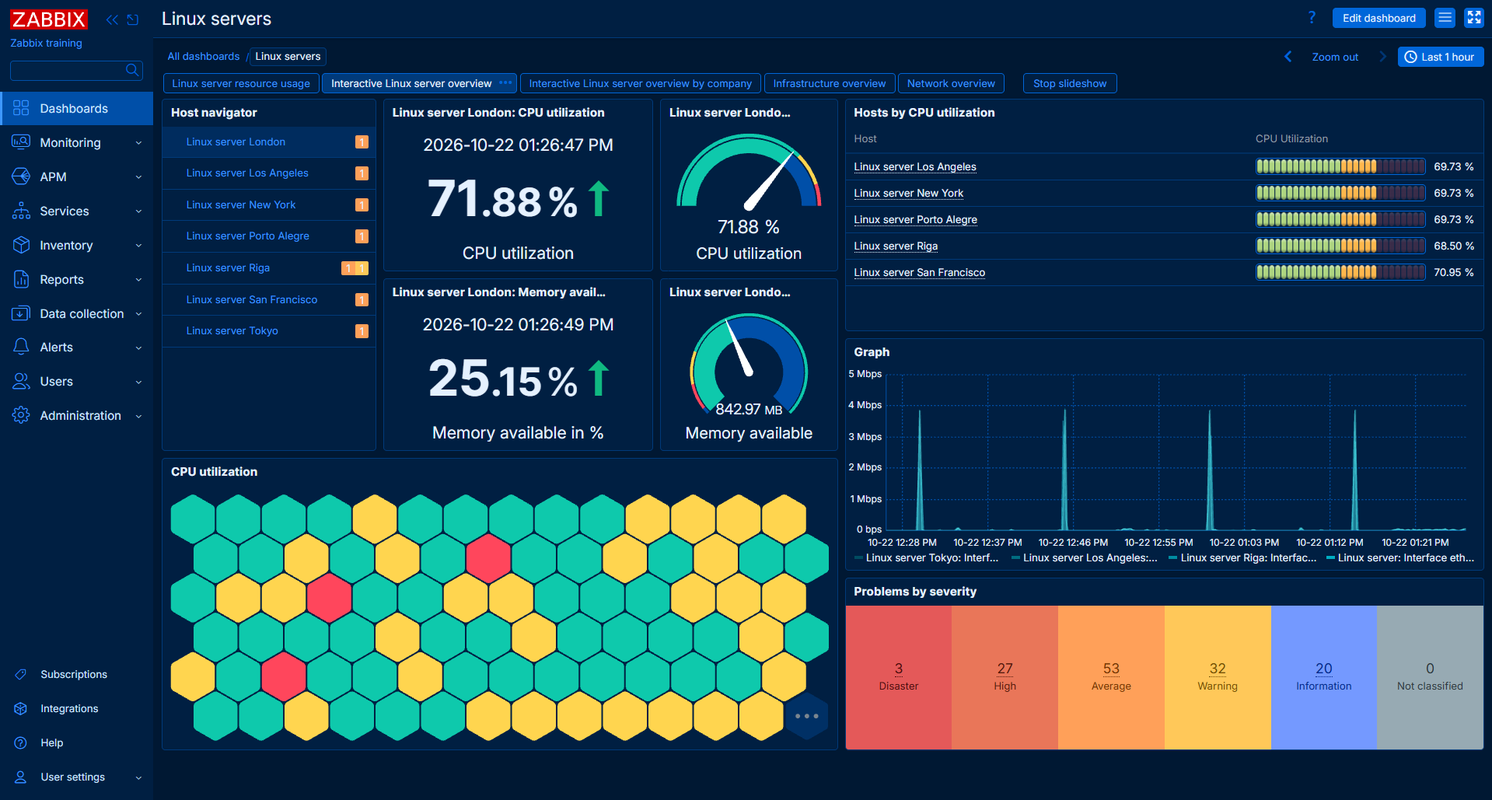
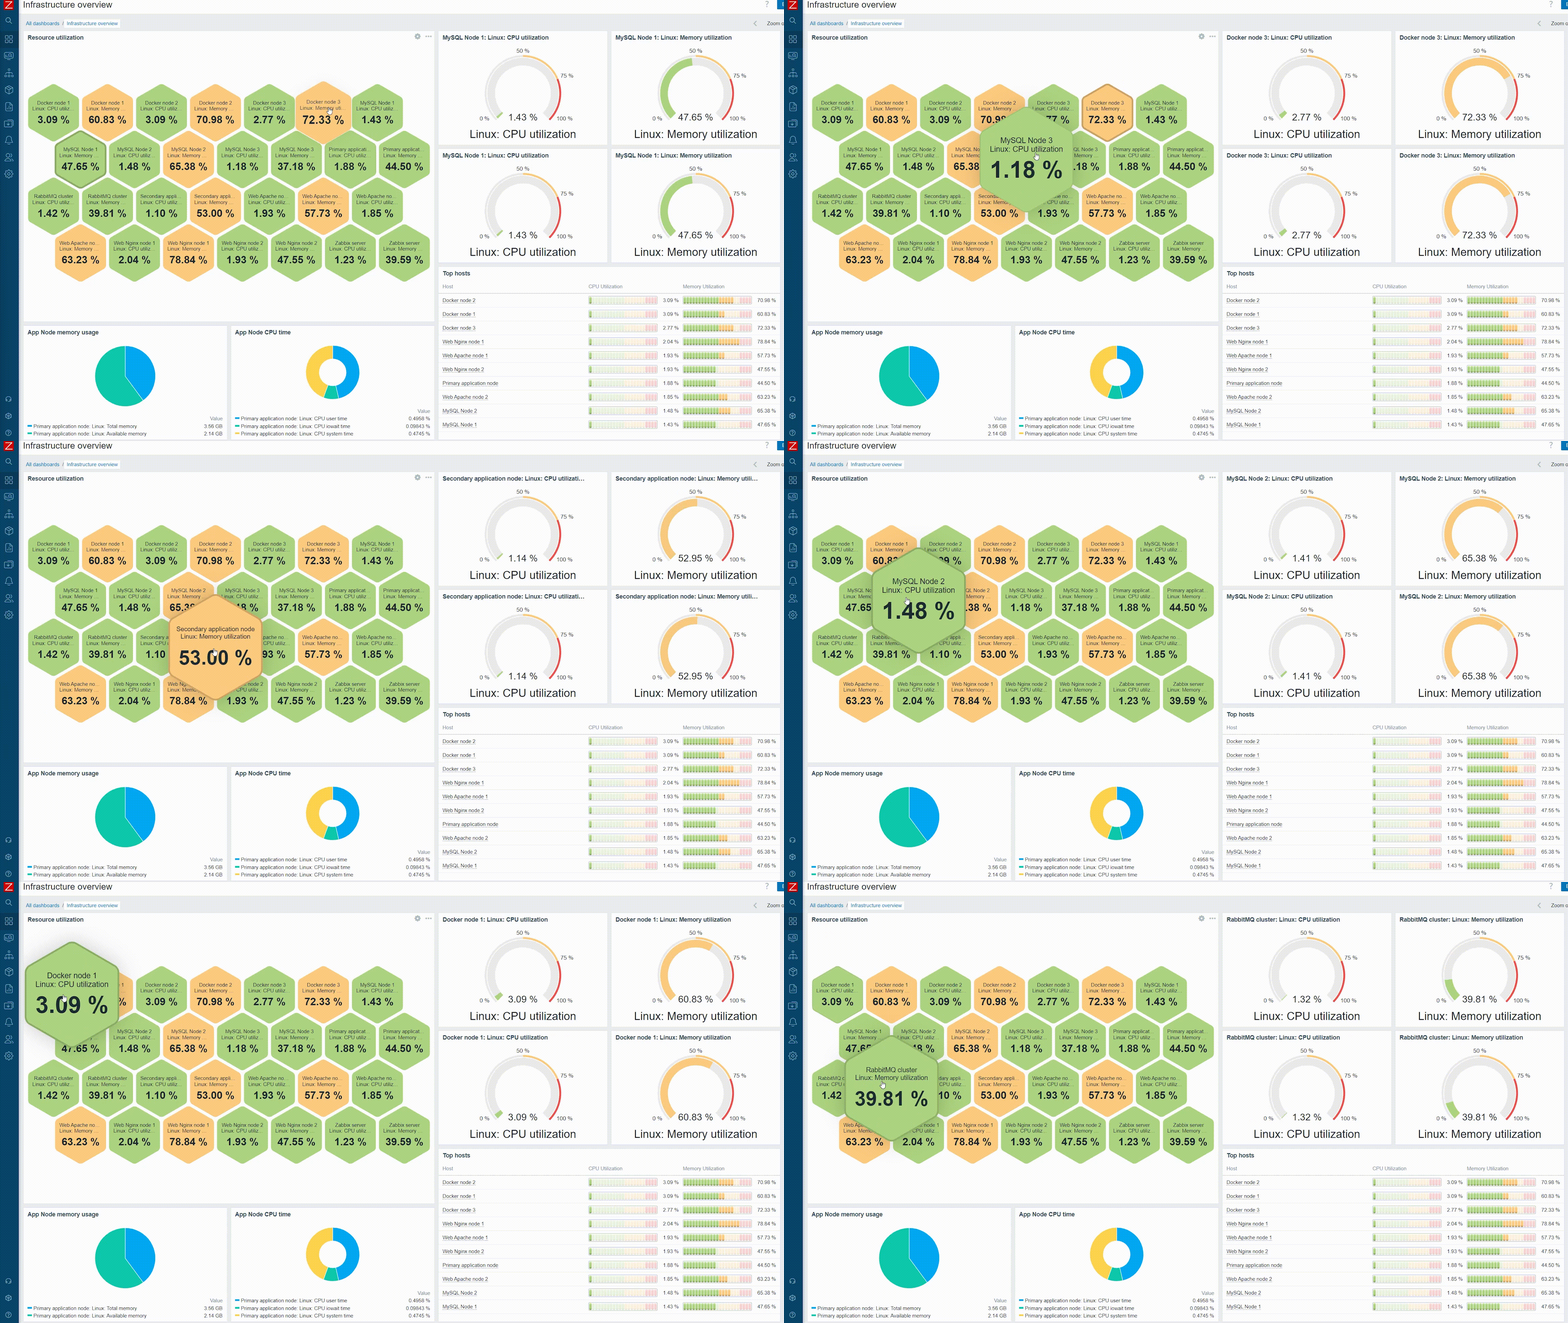
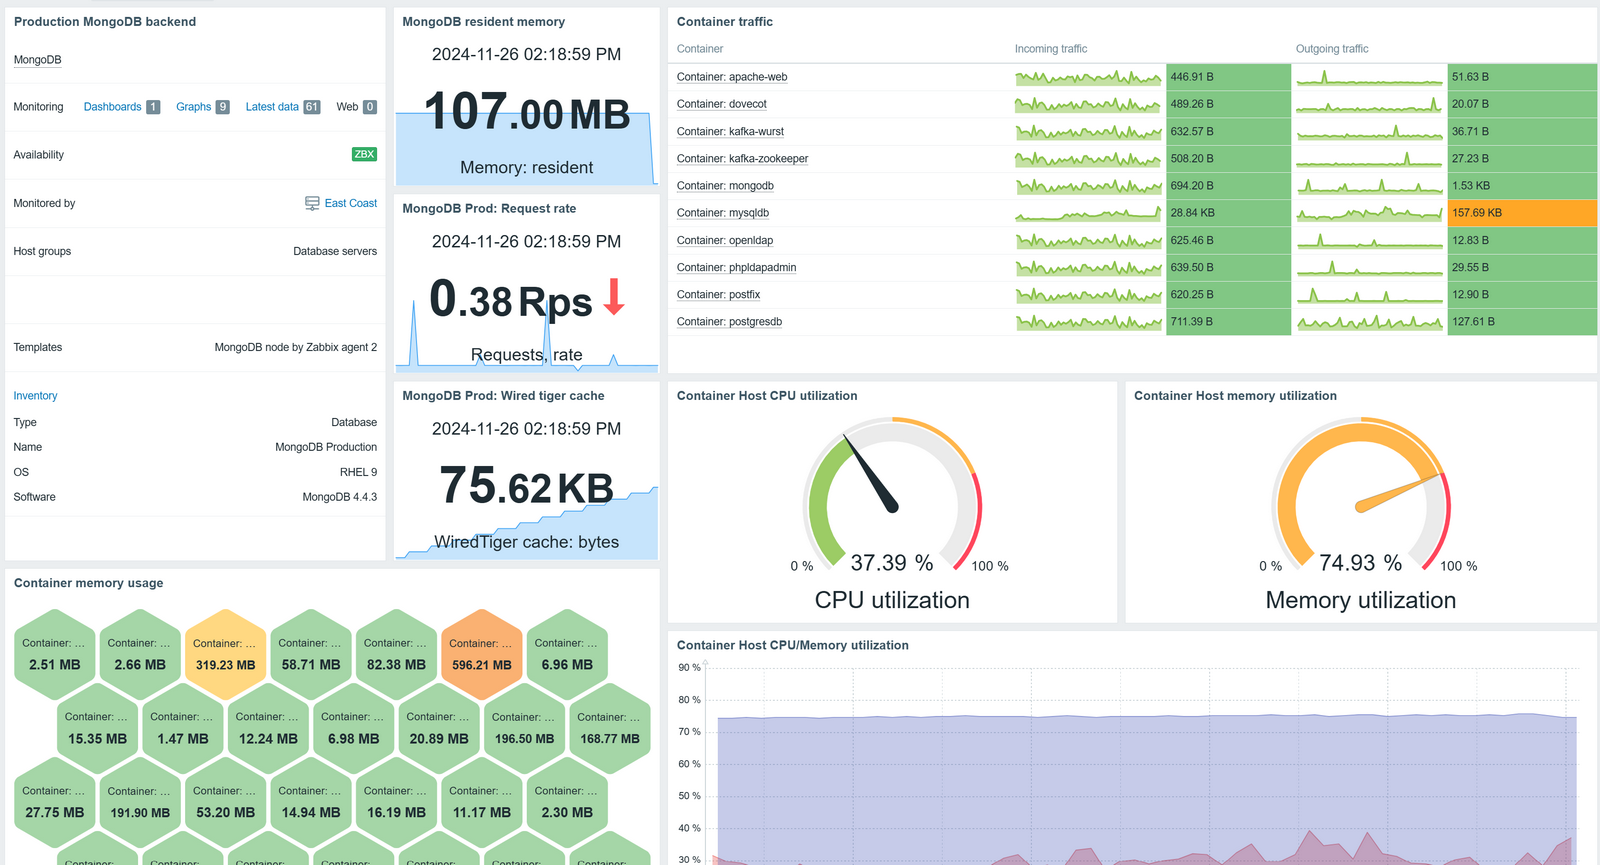
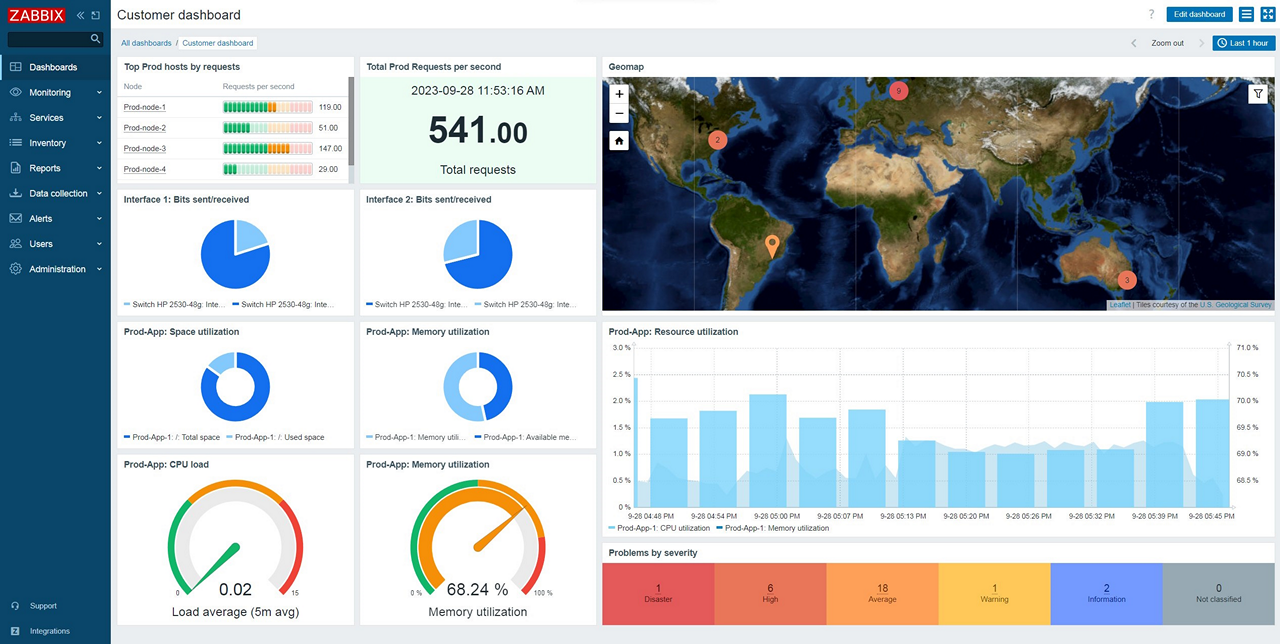
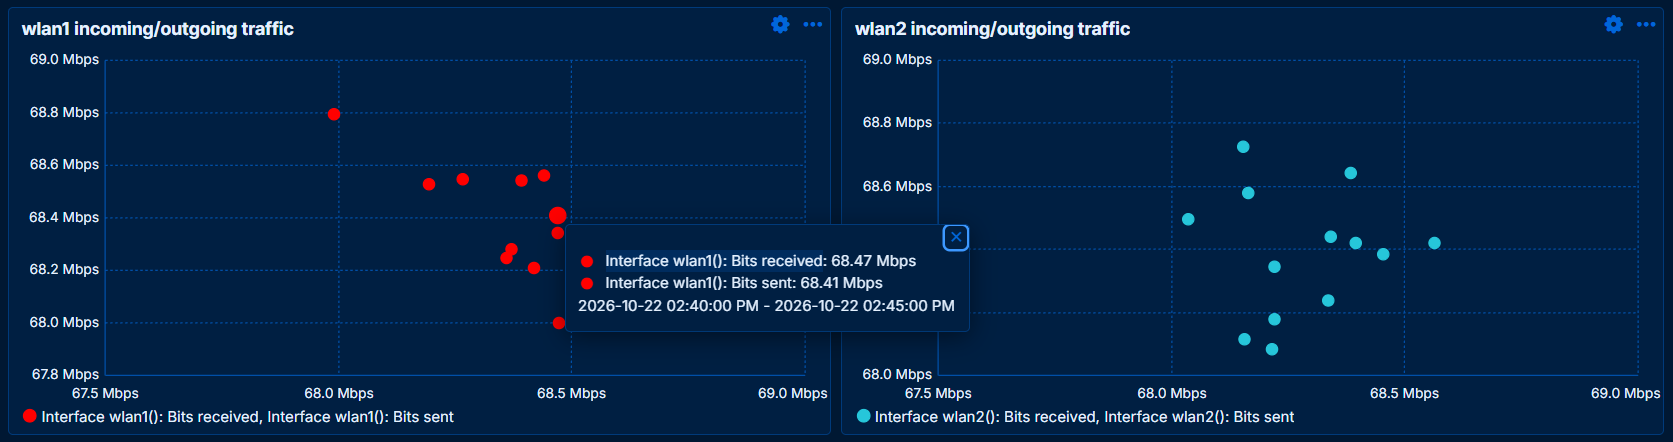
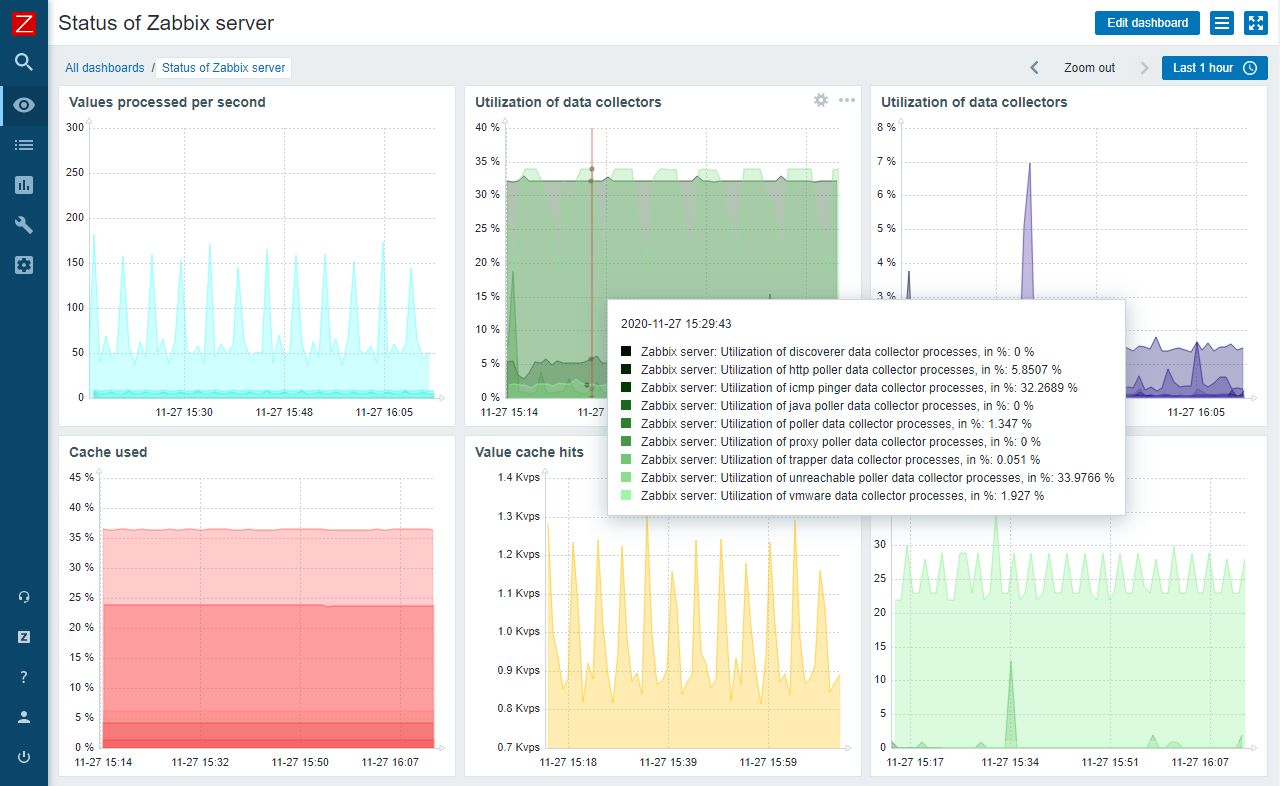
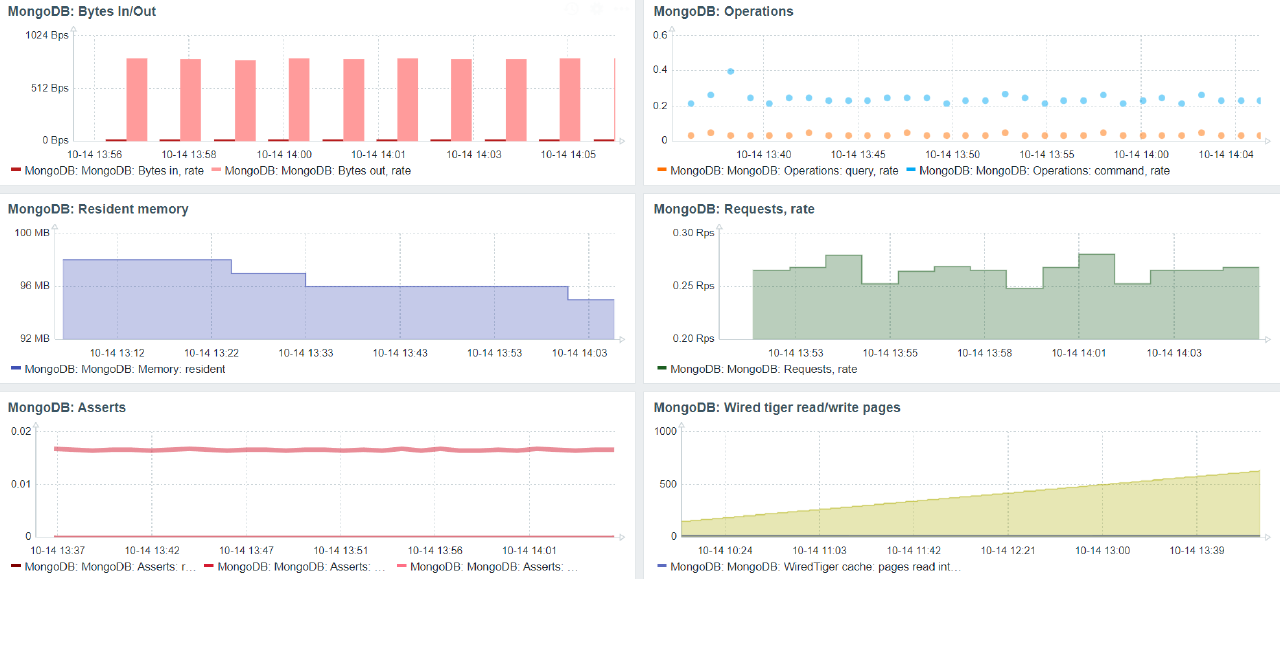
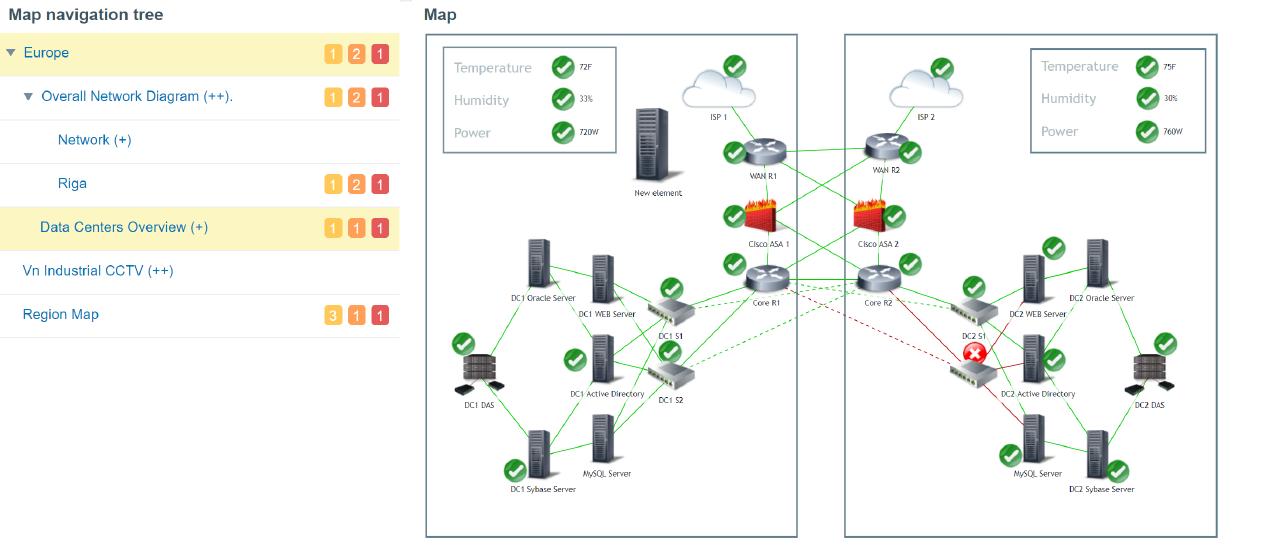
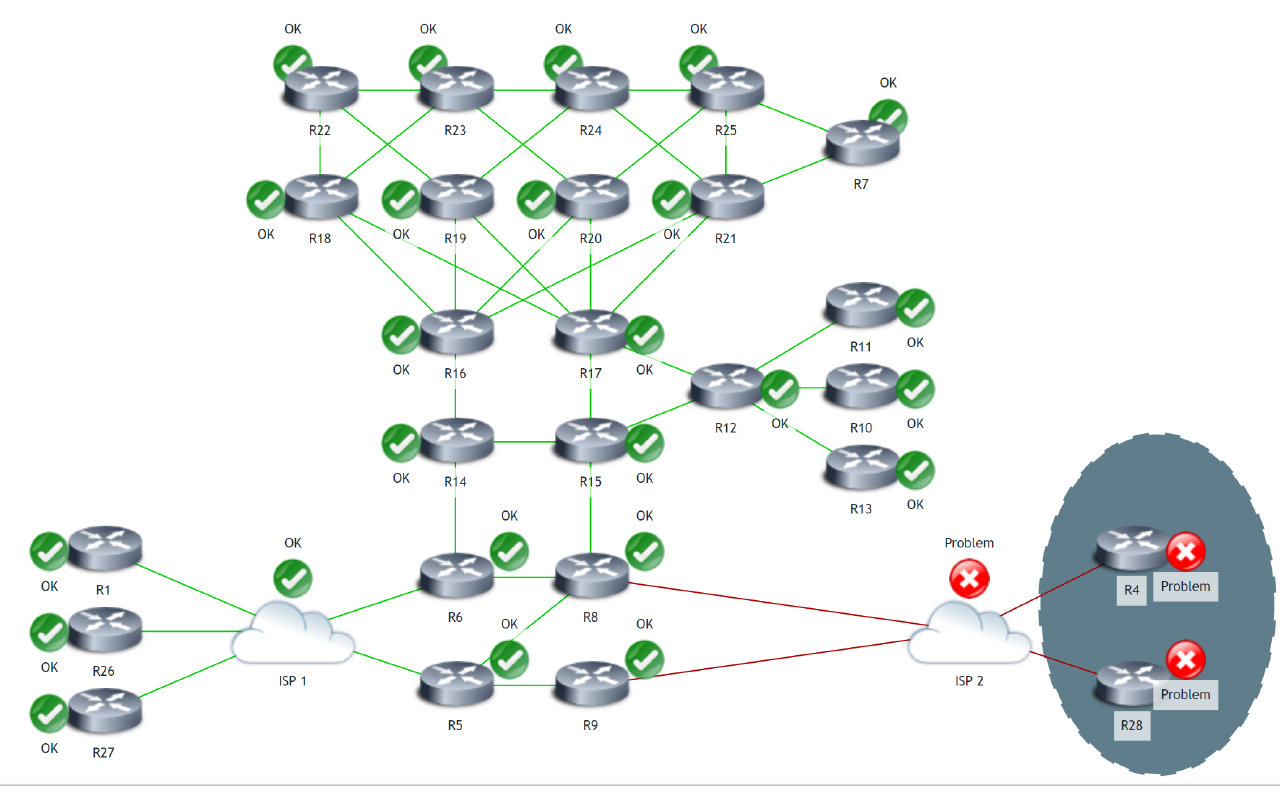
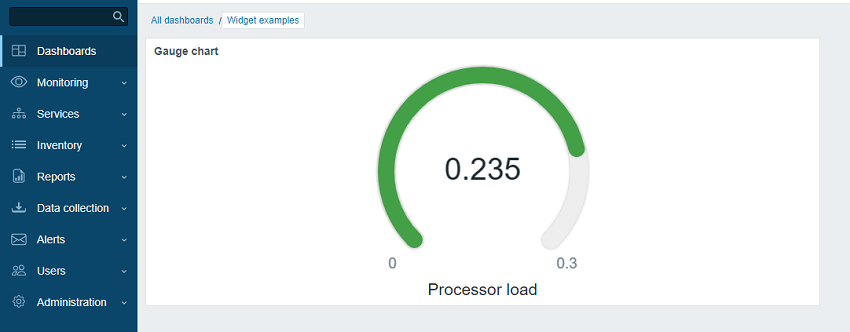
See your entire environment at a glance, with flexible dashboards that turn raw data into clear, actionable insight.
自定义基于构件的仪表盘显示相关信息
点击按钮即可访问指标、问题、报告和拓扑图。
Secure by default, and ready for the strictest compliance requirements.
Zabbix提供了一个灵活的用户权限模式,可以在安装一个Zabbix实例或分布式环境中有效管理用户权限。
可定义三个级别的权限:
用户类型用于定义对管理功能的访问并指定默认权限:
MSPs and organizations with segregated access permission logic can make use of allow and deny lists for Zabbix proxy administration, thus restricting access to individual parts of the monitored infrastructure
Zabbix支持加密不同Zabbix组件之间的任何通信流:
为环境中的不同类型的用户创建自己的自定义用户角色,并为其提供一套精细化的权限。
用户角色还能隐藏或显示Zabbix UI元素,以满足用户和客户的需求。
使用用户角色,可以:
将Zabbix与现有的身份验证机制集成在一起。Zabbix支持多种身份验证方法:
通过对HTTP、LDAP和SAML身份验证的本地支持,可以提供额外的安全层,并在使用Zabbix时改善用户体验。
Out-of-the-box support of multi-factor authentication enables enterprise-grade security and more flexibility for configuring user authentication methods:
输入后可以选择隐藏敏感信息,以防被窥探:
部署外部保险库vault以严格保密:
利用审计日志跟踪环境中的更改:
Integrate Zabbix with your existing tools - from legacy systems to cutting edge technologies.
Kubernetes监控还能帮助您监控Kubernetes组件,例如:
Gain additional insights from your metrics and events by streaming them to an external AI engine, or stream them to a data lake or data warehouse for long-term storage and analytics.
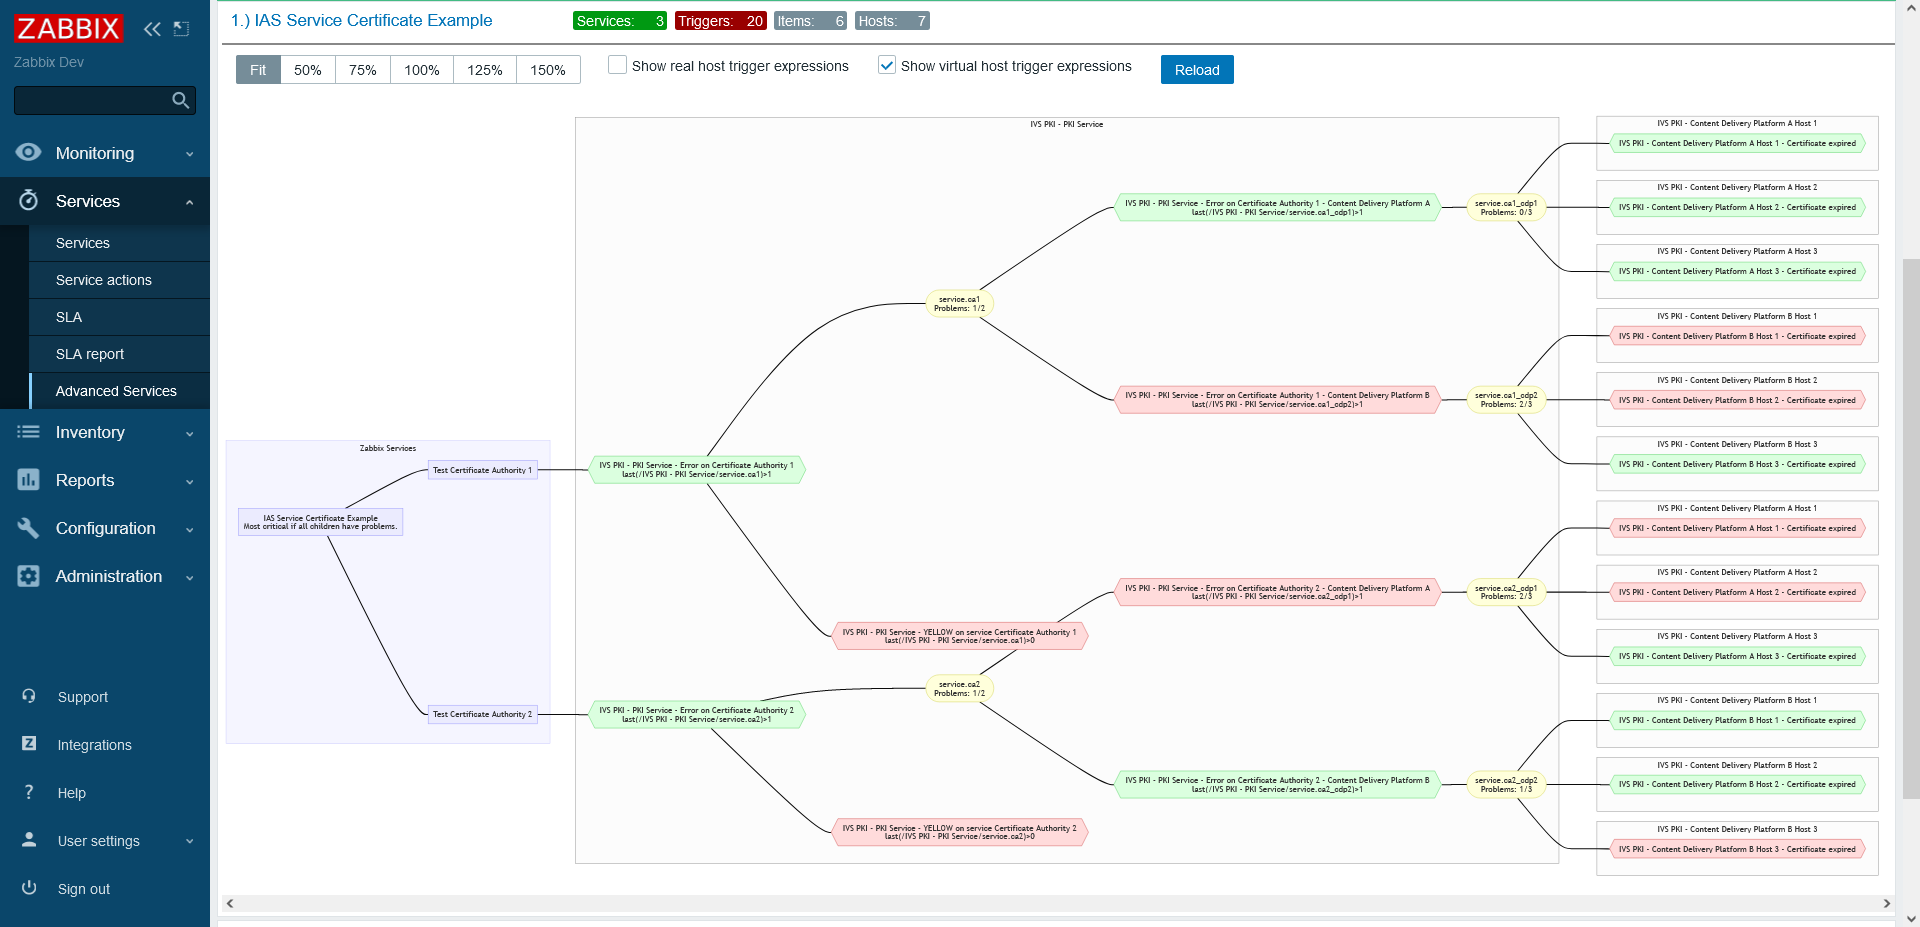
See how IT or OT issues affect your business, and track SLAs to prove you deliver on your commitments.
使用自定义SLA计算逻辑定义服务和服务组件:
Run Zabbix wherever your business needs it, from your own environment to any public cloud.
资源发现使Zabbix能够自动发现监控端点上的指标:
资源发现实际上是无限的。发现实体,例如:
大量out-of-the-box templates 能够立即开始监控您的基础架构:
The Host Wizard will guide users through host creation and configuration:
监控您自己的基础设施,还可以使用Zabbix进行更多的操作!使用Zabbix,您可以在多租户环境中为多个客户提供监控服务
Zabbix定位是Linux监控工具。Zabbix是100%免费和开源的,遵循GNU通用公共许可证(GPL)版本2协议。这提供了许多闭源软件无法提供的独特优势:
Zabbix前端和文档以多种不同语言提供。我们的目标是使Zabbix易于全球用户使用。借助Zabbix社区本地化工具,欢迎加入翻译团队,将Zabbix翻译成中文。
点击了解Zabbix社区翻译的信息,欢迎参与其中
Zabbix完全开源免费,没有任何限制和隐藏费用。