Learn about the most critical Zabbix features, get a brief overview of our professional services, and find out how to easily download and install Zabbix. (12:17)
Dive deeper in to technical details, including supported monitoring methods, business service and SLA monitoring, and distributed monitoring with Zabbix proxies. (8:25)
Register for free with your email address to explore Zabbix in detail with this comprehensive demonstration. If you prefer a more personalized experience, you can also request a live demo with our experts. (48:00)
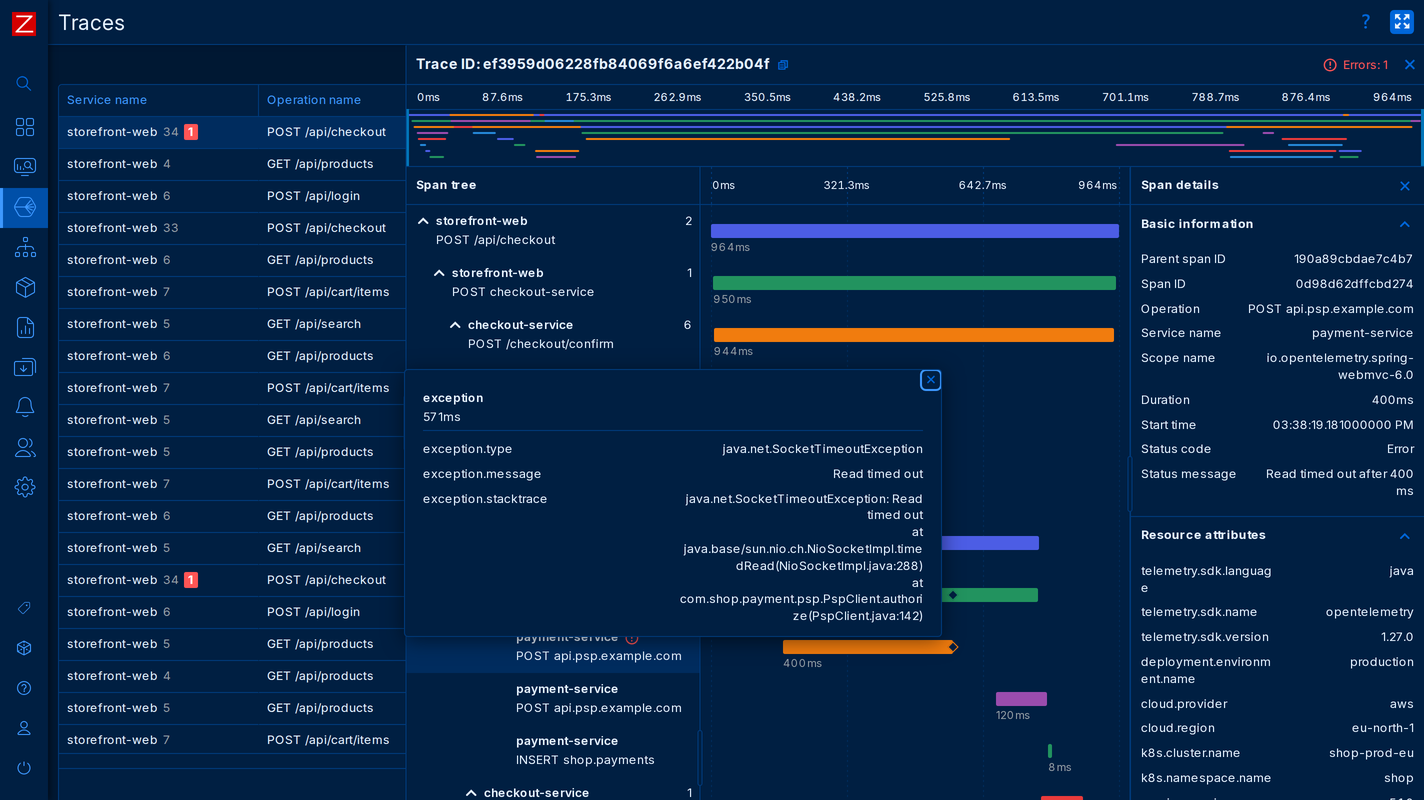
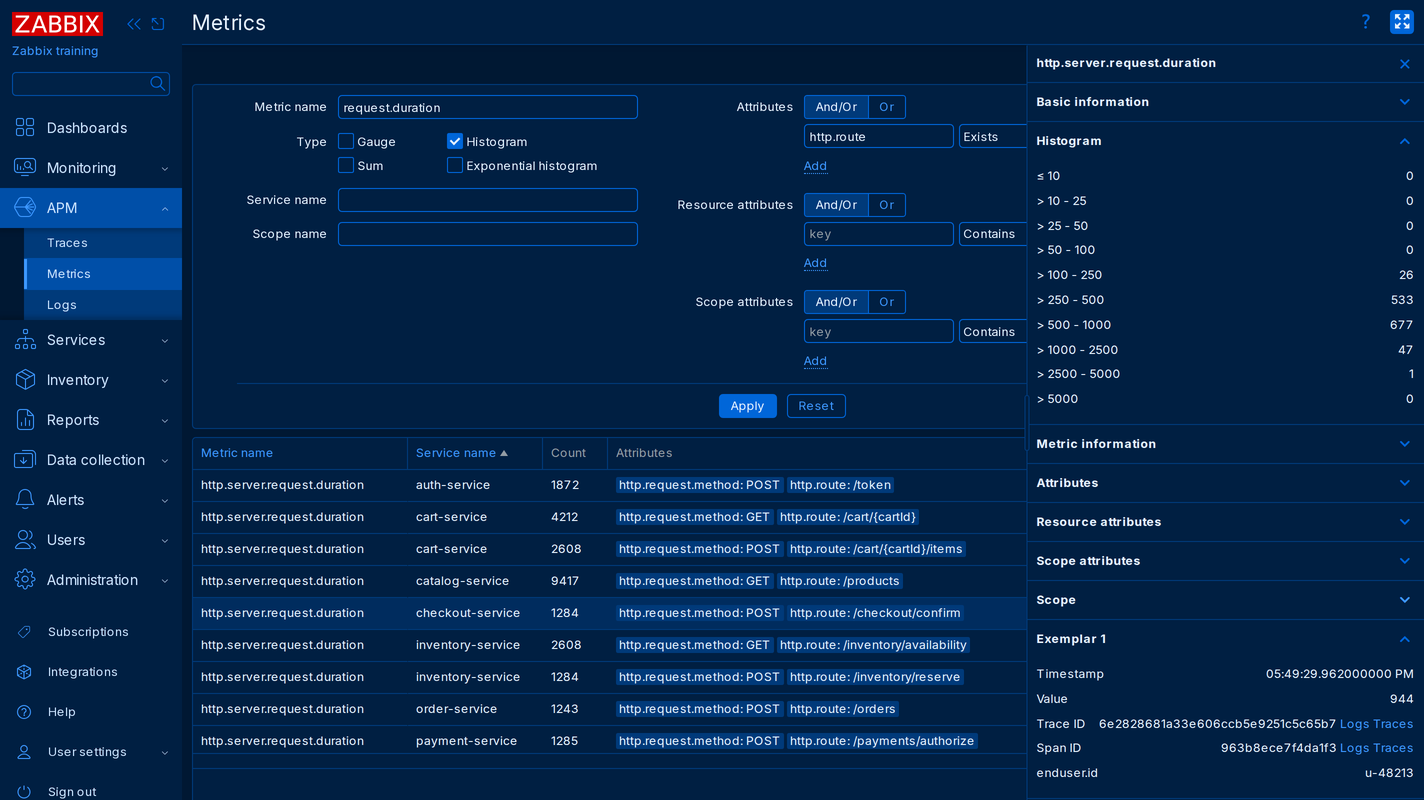
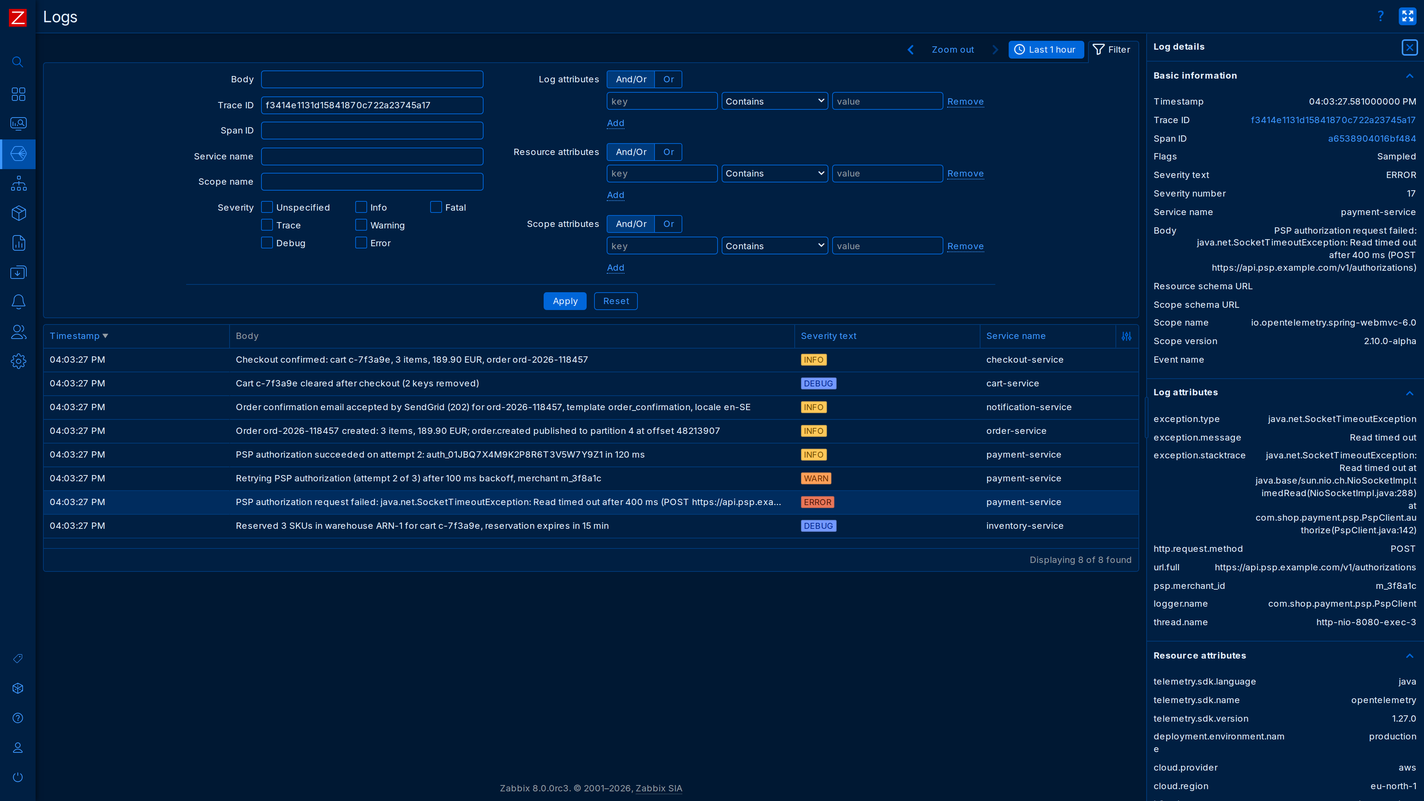
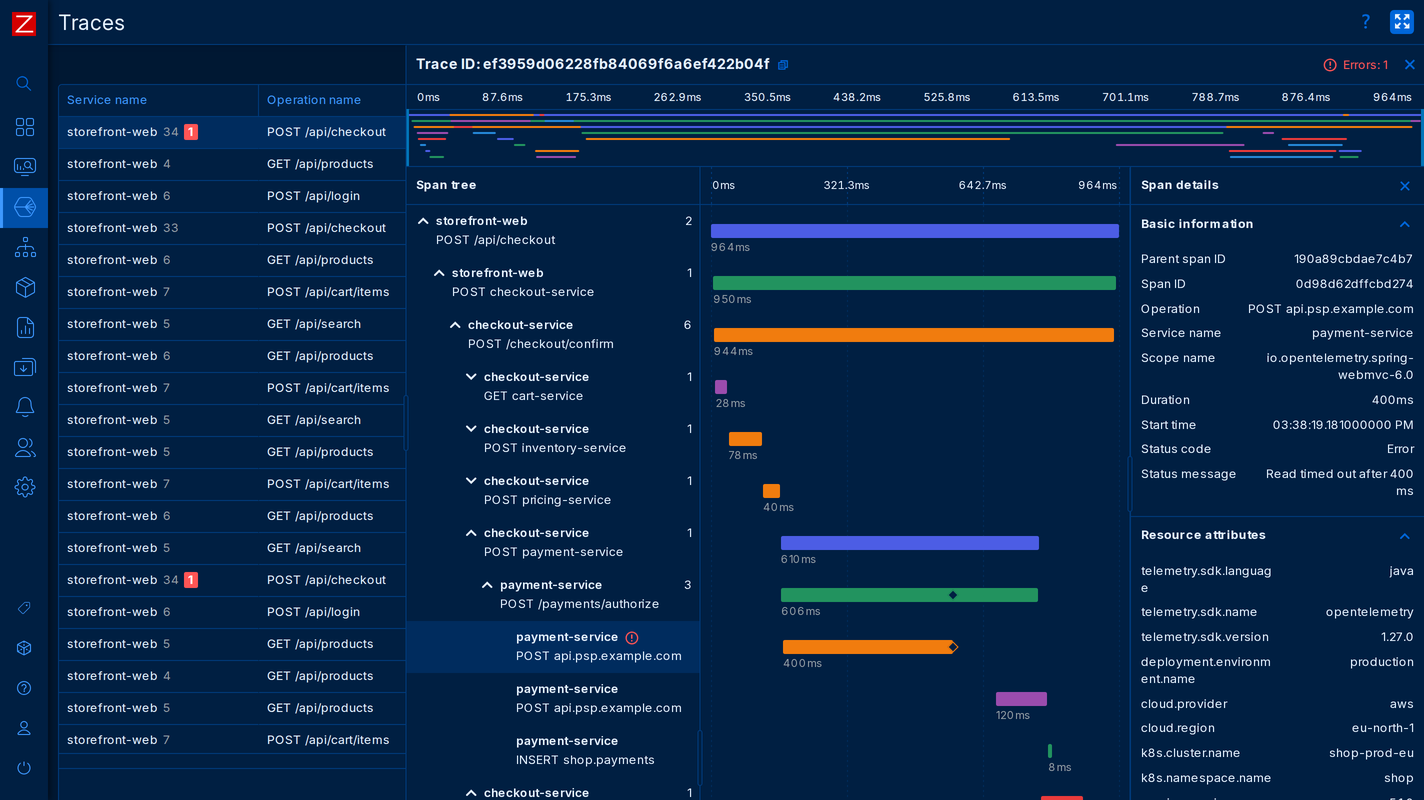
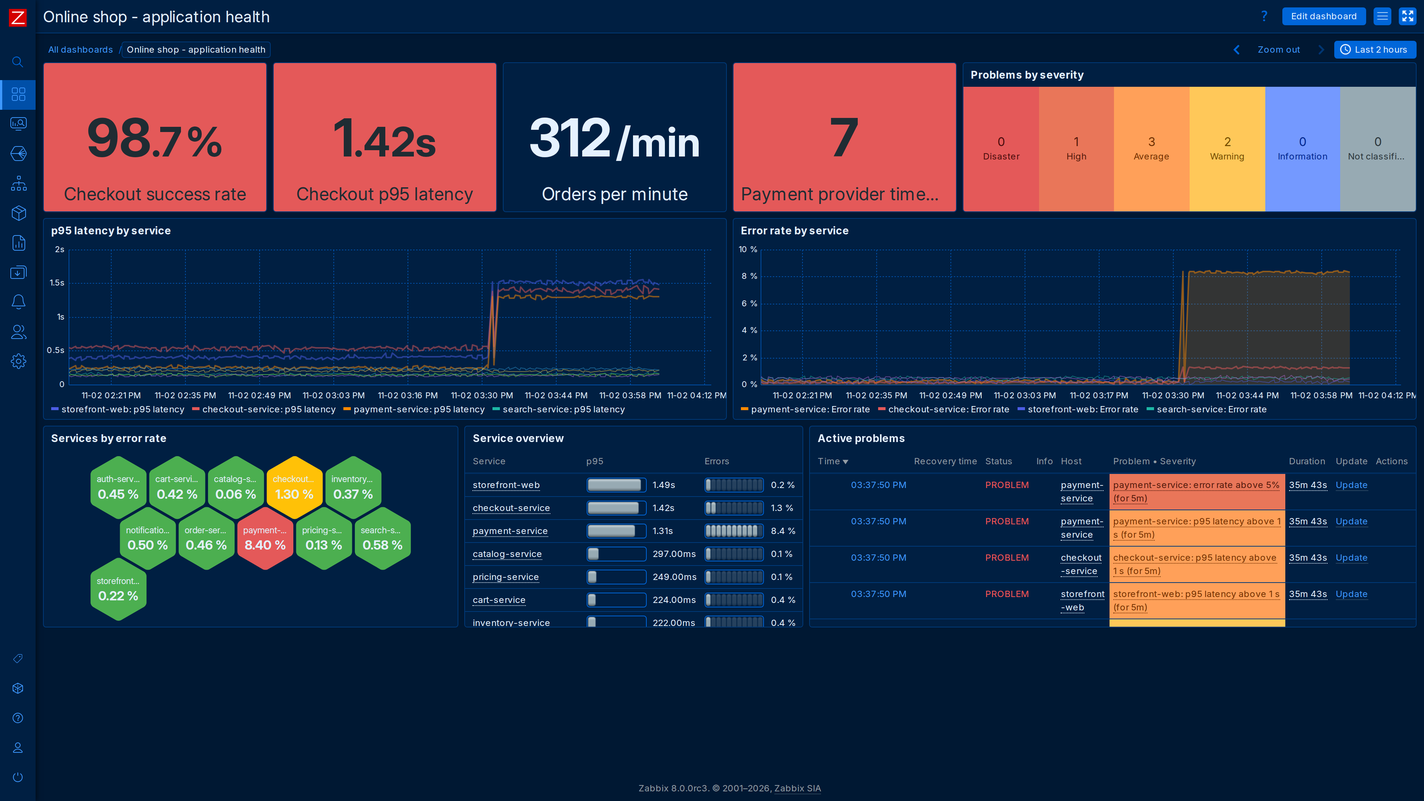
Monitor application performance with OpenTelemetry, the open standard for traces, metrics and logs. Follow requests across services to investigate slowdowns and errors.
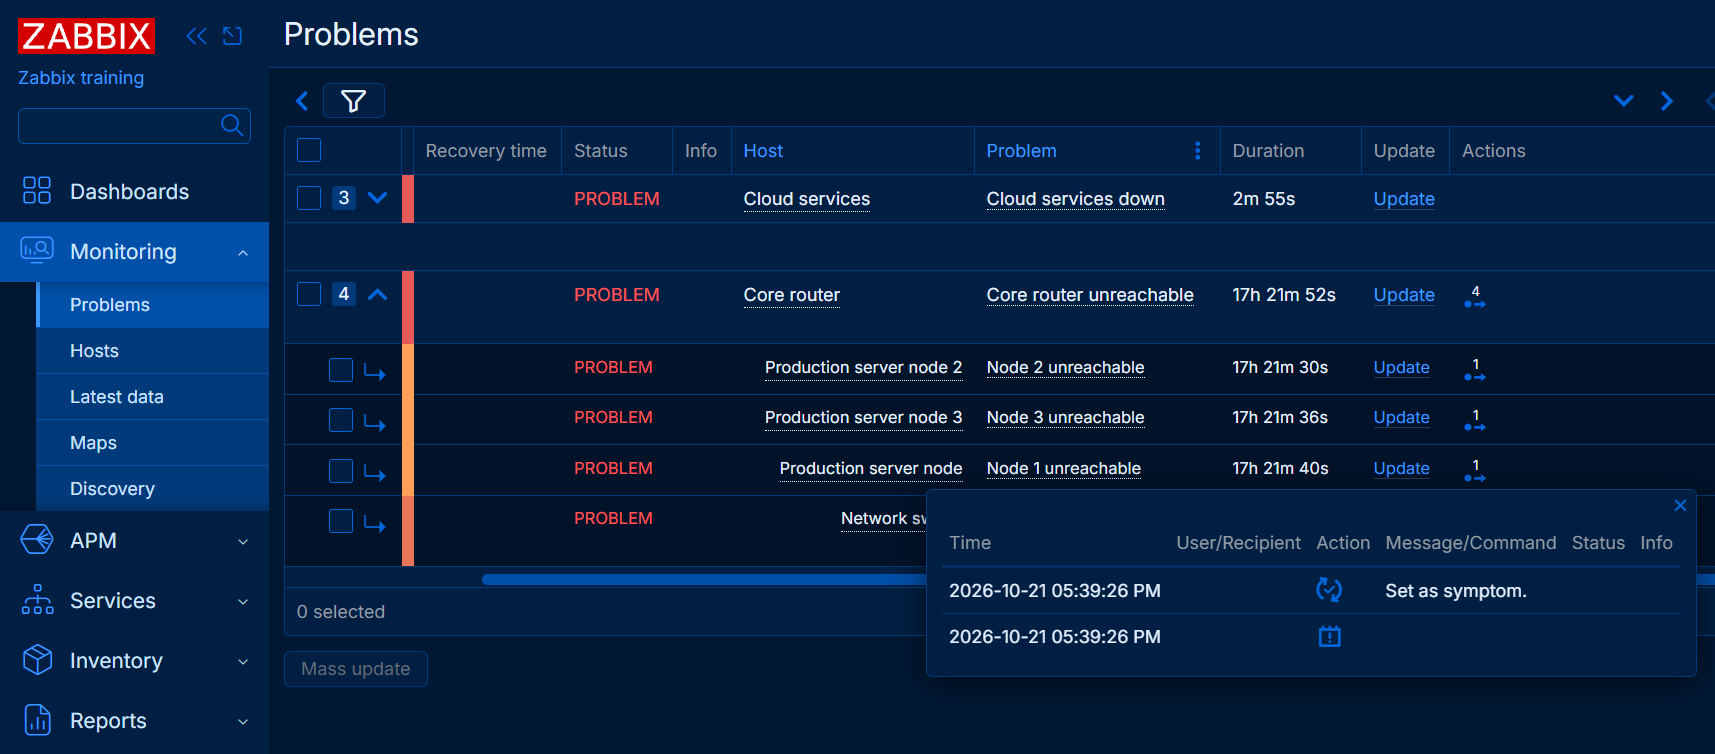
Turn thousands of raw events into a few actionable problems with root cause analysis, reducing alert fatigue and speeding up incident resolution.
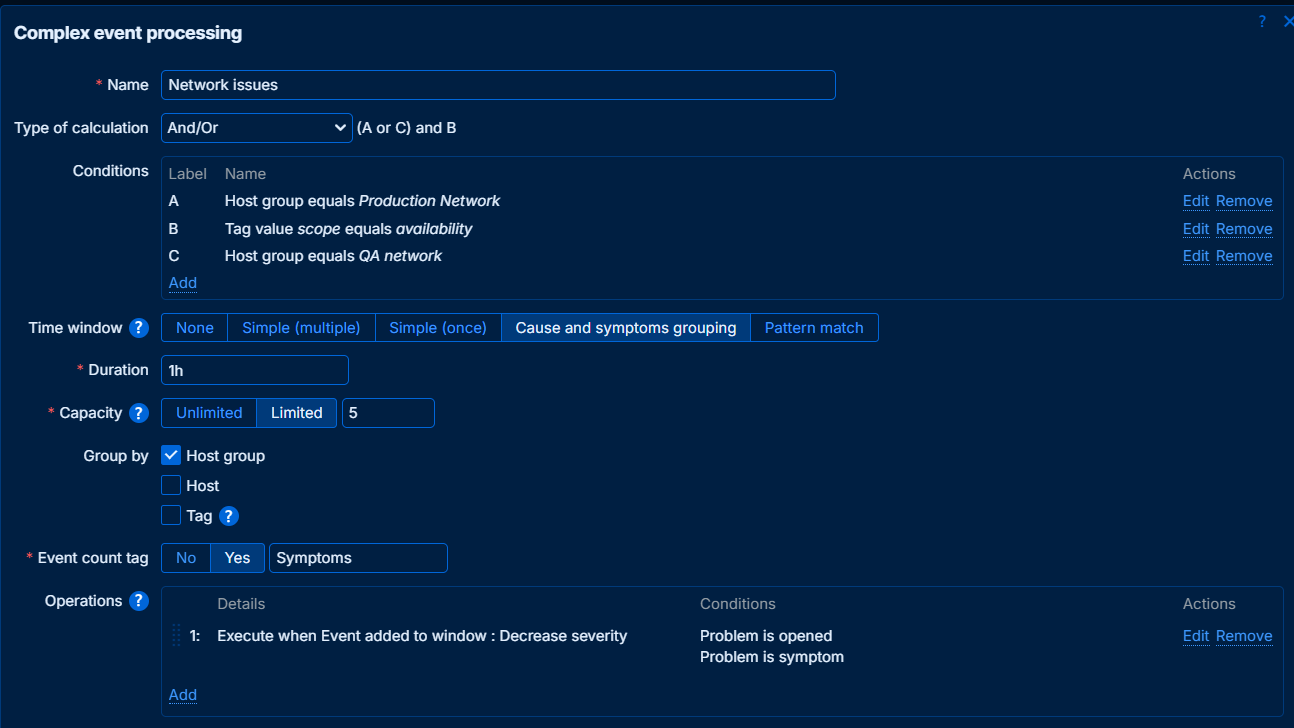
Apply configurable rules to group related events, reduce duplicates and detect patterns across time windows.
On-demand one-click maintenance: suppress alerts for selected monitored targets, triggers or event patterns, and see in each event's history whether and why it was suppressed.
Fully programmable: write custom matching and correlation logic in JavaScript when built-in rules are not enough.
Use cases: network operations centers that need one alarm console, security monitoring and SIEM-style correlation, fraud detection, and high-volume IoT and OT event streams.
Zabbixでは閾値の手動設定だけではなく、収集したデータから閾値を動的に生成することができます。
Zabbixは非常に柔軟かつ高度な閾値定義オプションを提供しています。「X以上」のような単純な閾値の指定だけではなく、データの統計解析のために提供されているすべての関数と演算子を利用して指定することができます。
閾値として固定値を定義することは必ずしも効率的なアプローチではありません。基準値が定期的に変化するような環境では閾値を計算する基準点を自動的に計算することが重要であり、Zabbixのベースライン監視ではこれを可能にします。
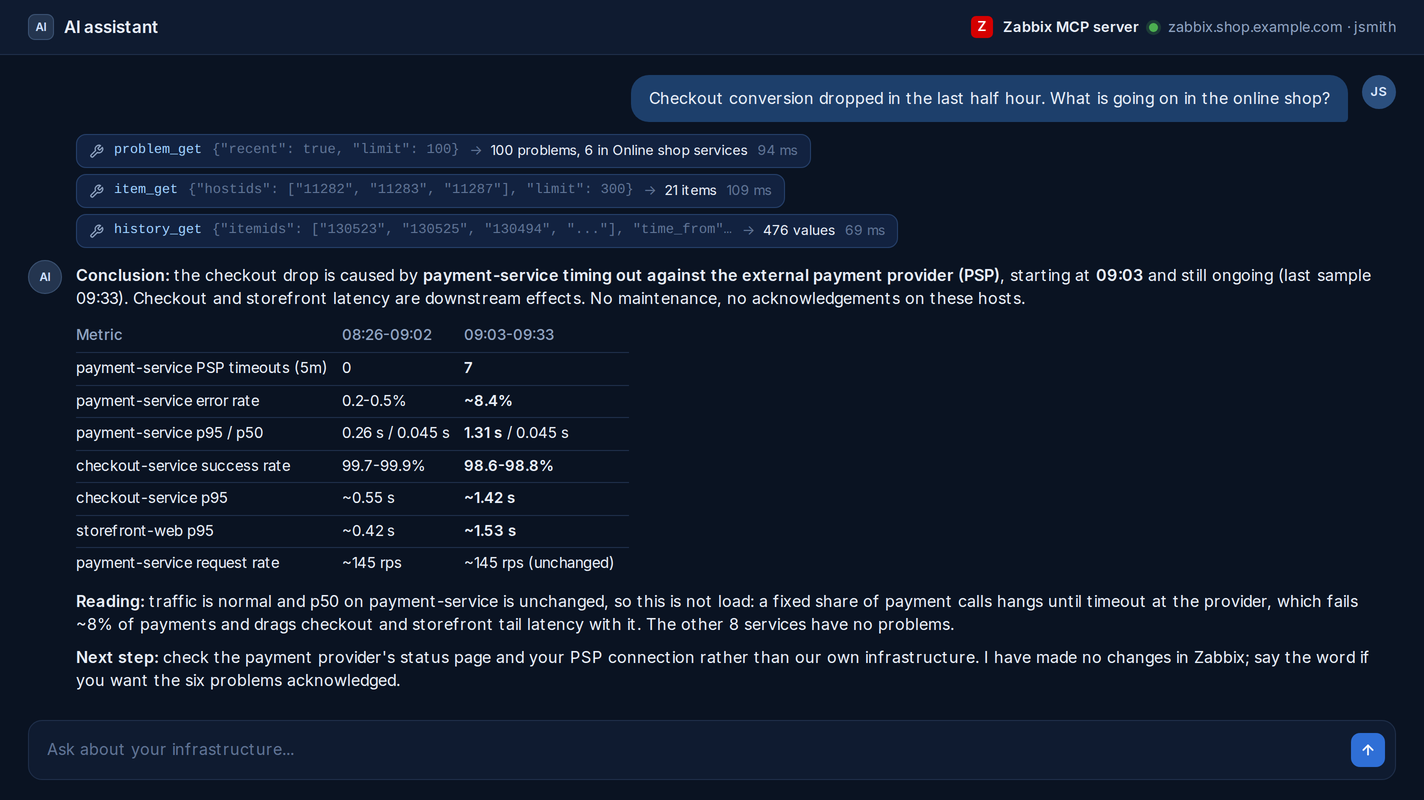
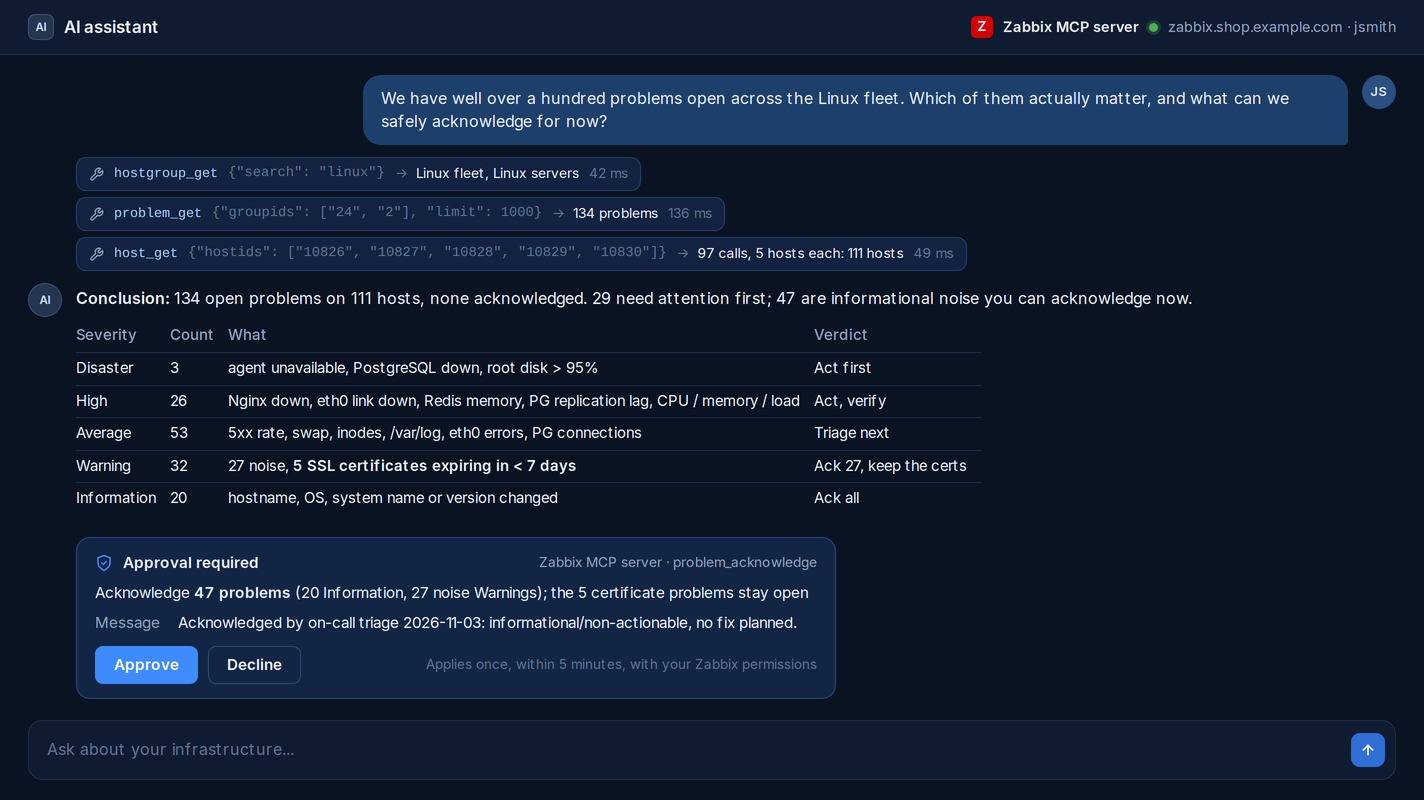
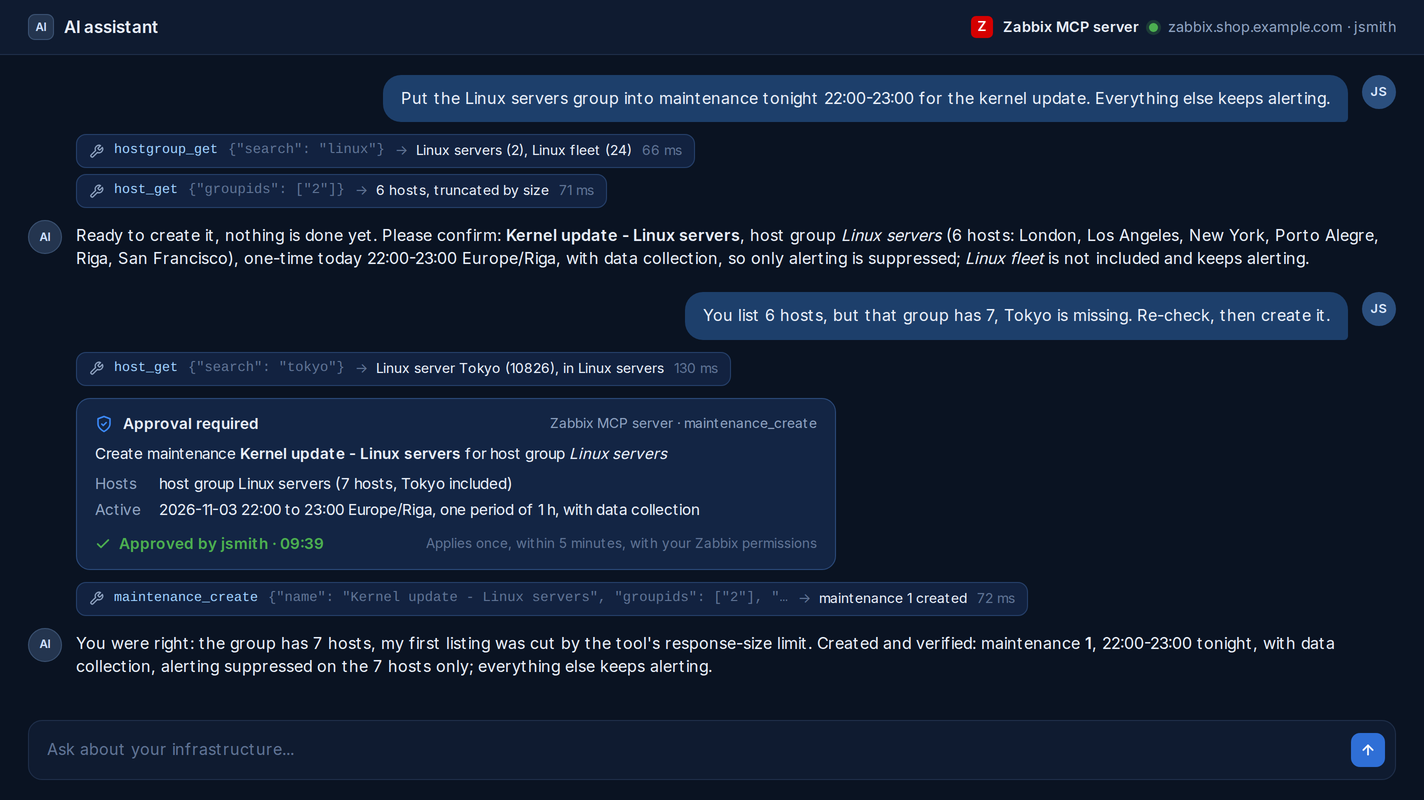
Connect a compatible AI assistant or automation platform through the Zabbix Model Context Protocol (MCP) server. Investigate your environment and automate monitoring workflows within your Zabbix permissions.
Run recurring workflows with scheduling in your AI assistant or automation platform.
Monitor your AI services too: ready-made monitoring for OpenAI Platform, Claude API, OpenRouter, GitHub Copilot and Microsoft 365 Copilot tracks AI usage alongside the rest of your stack.
Deploy in minutes from official packages or a Docker image.
Monitor large environments with efficient use of hardware resources, distributed data collection, high-volume data storage and automatic failover.
Add an extra layer of scalability by deploying Zabbix proxies. Scale up to collect millions of metrics from hundreds of thousands of devices, services, applications, and more. Zabbix proxies are easy to deploy and enable unlimited vertical scalability:
世界中のあらゆるリモート拠点から安全にデータを収集し、ネットワークに問題が生じた場合でもデータ欠損を防ぎます。Zabbixプロキシを利用することで以下を実現します。
Zabbixプロキシの利用により、Zabbixプロキシ自身またはZabbixプロキシを介して監視しているZabbixエージェントに対して、遠隔地からリモートコマンドを実行することができます。
Zabbixはヒストリデータの保存と1時間単位のトレンドデータを収集することができます。
データベースのディスク容量を確保するために、ヒストリデータを6ヶ月、トレンドデータを2年間保持するといったことも可能です。Monitor anything, without limits. If the data exists, Zabbix can collect it.
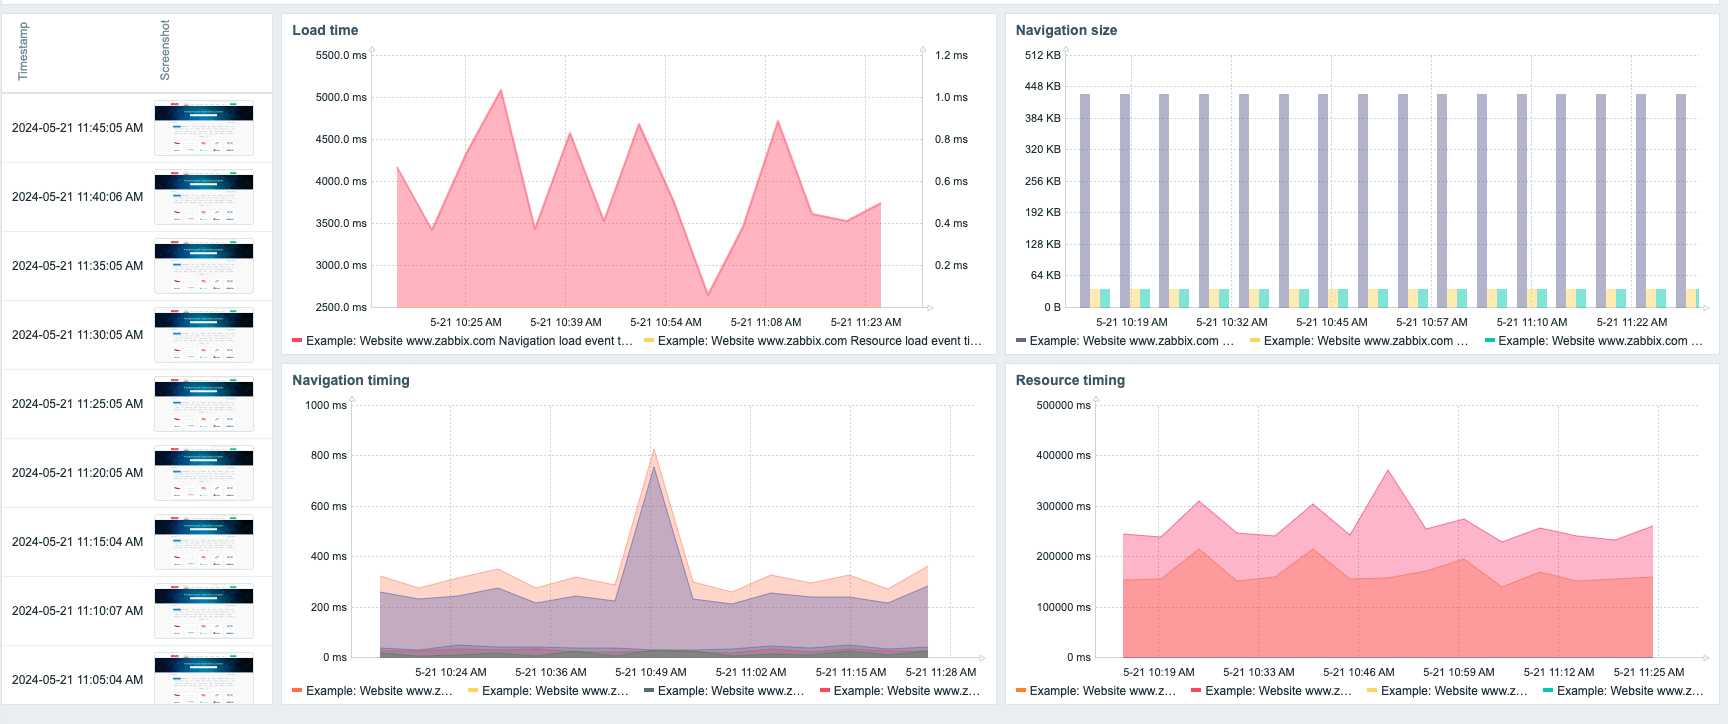
複雑なシナリオを作成し、WebアプリケーションやAPIの実際の実際の操作を模擬した監視を行うことができます。
Monitor websites and web applications by defining flexible multi-step browser based scenarios:
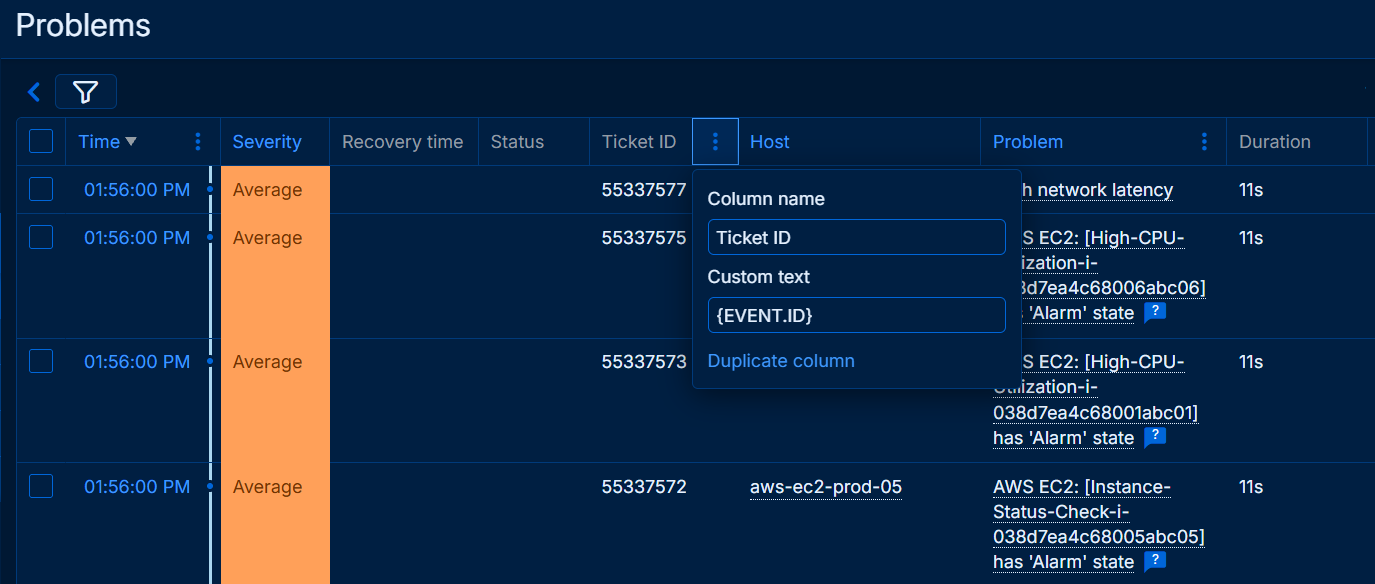
Receive notifications containing vital information through multiple messaging channels.
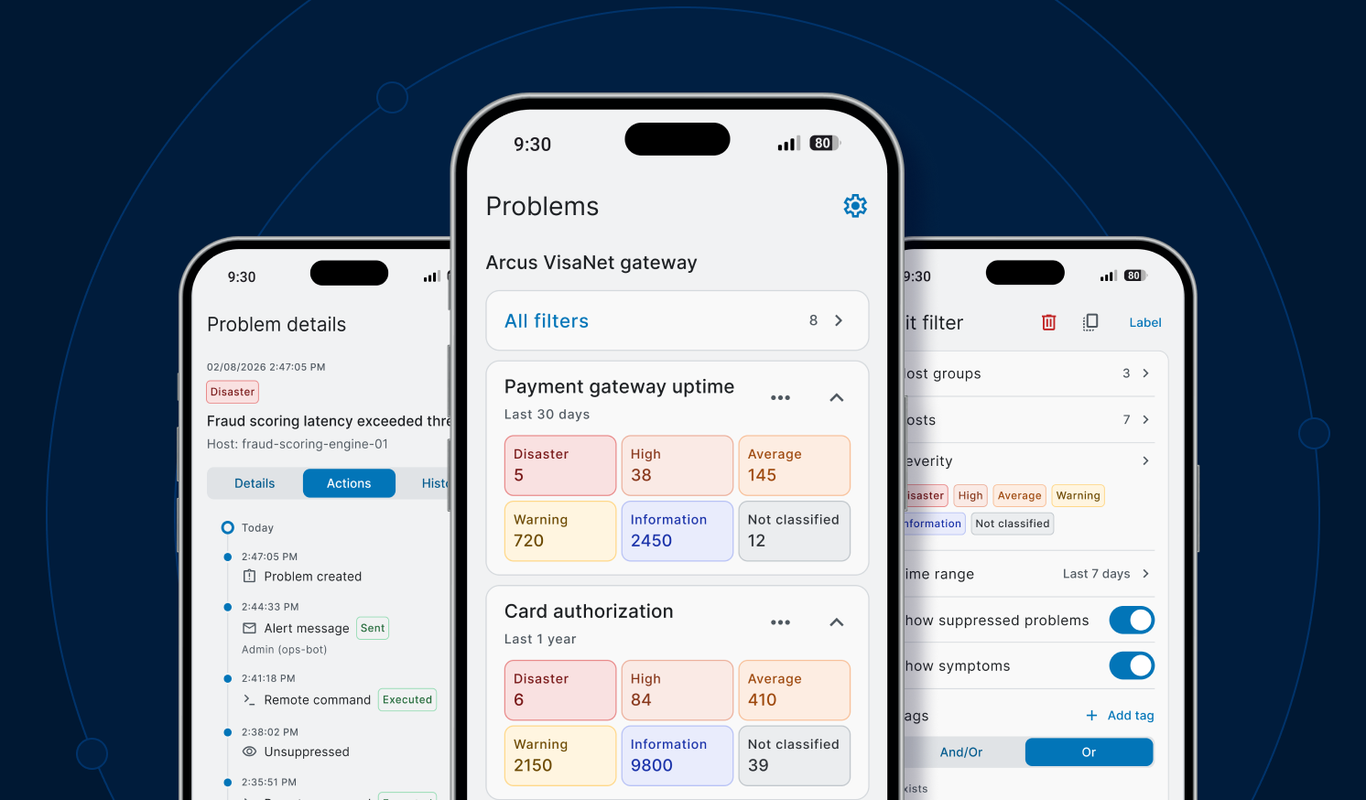
Access your Zabbix instances on the go. Receive push notifications and review problems from your phone.
様々な通知方法を利用して、検知した問題を管理者や担当者へ通知することができます。
必要なワークフローに応じて、様々なエスカレーションシナリオを定義することができます。単純な通知、様々なユーザーへのエスカレーション、通知タイミングの指定、自動での問題解決といったことが可能です。
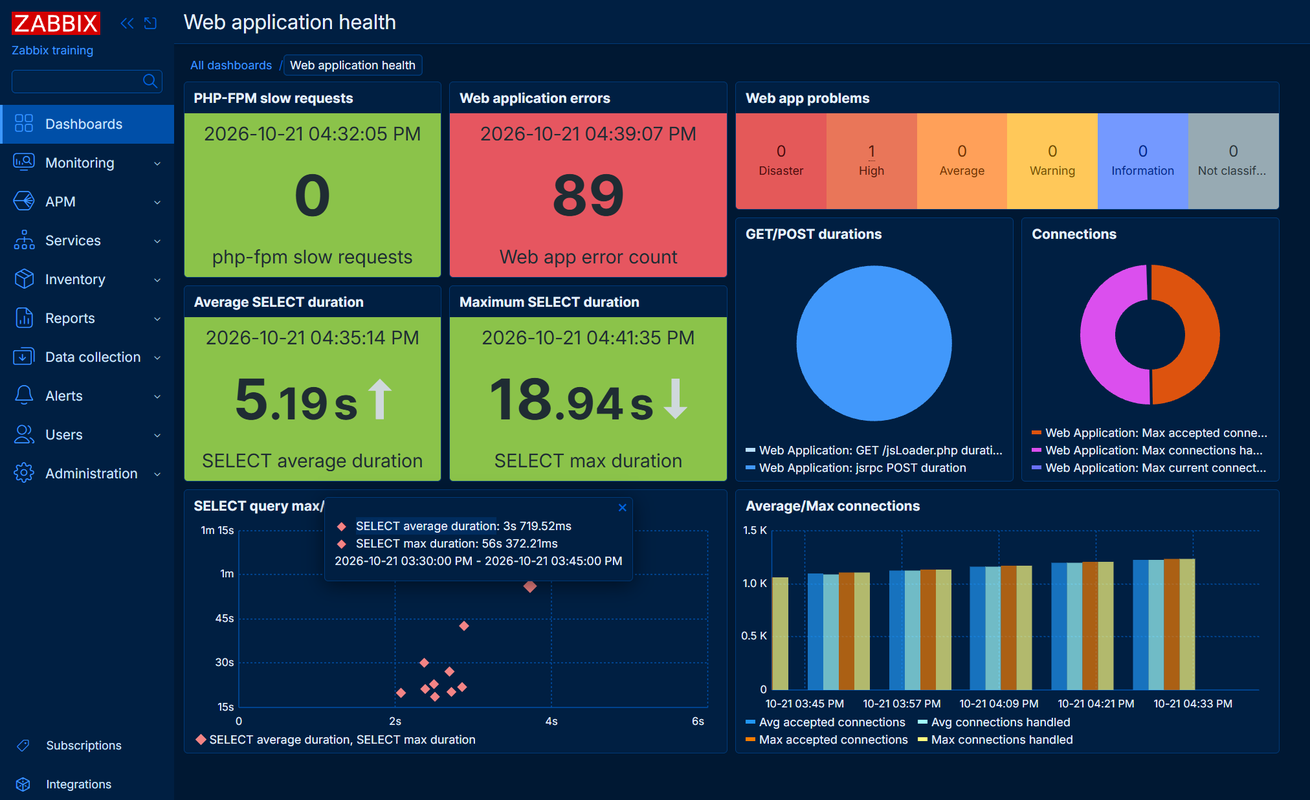
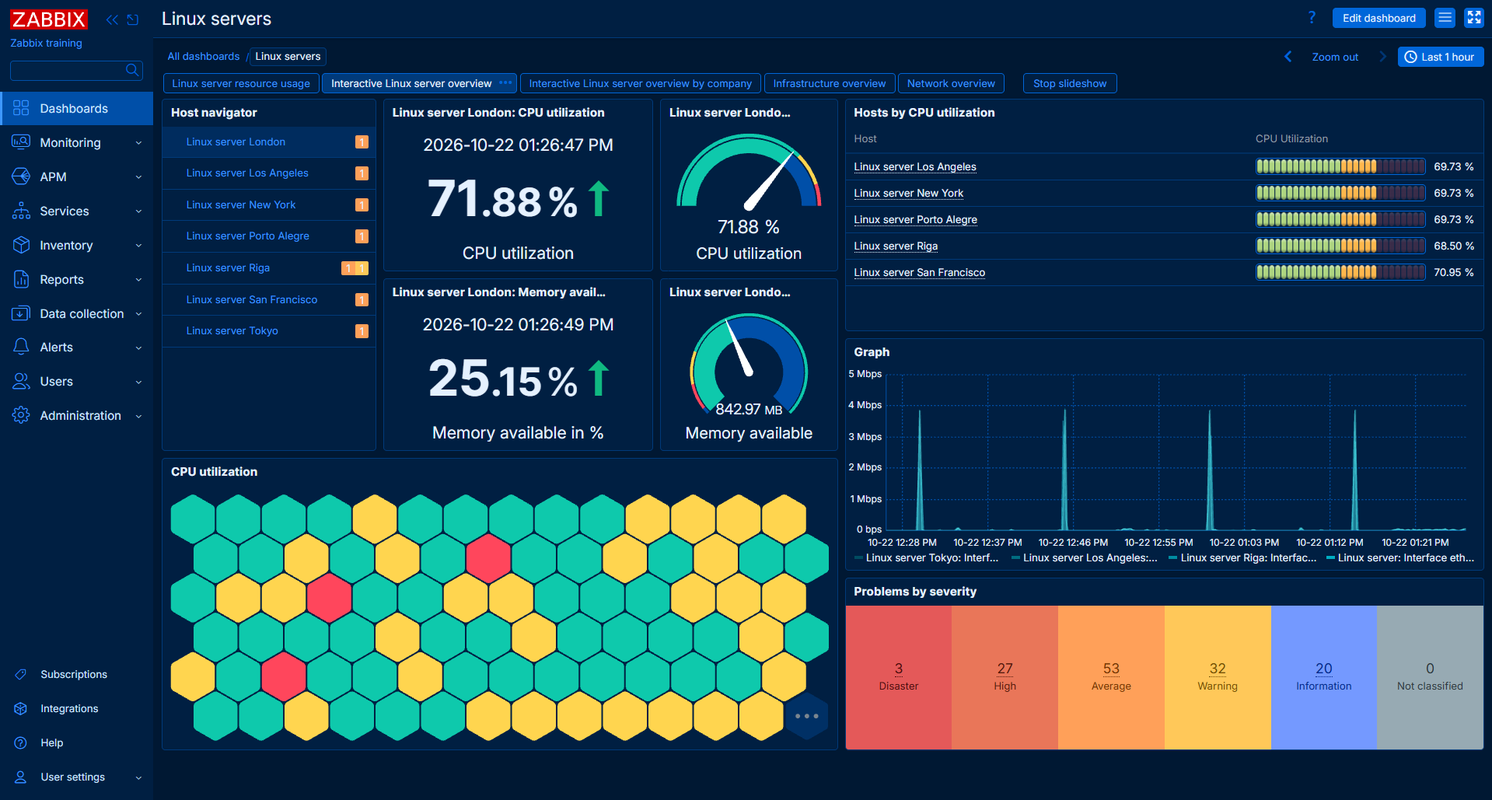
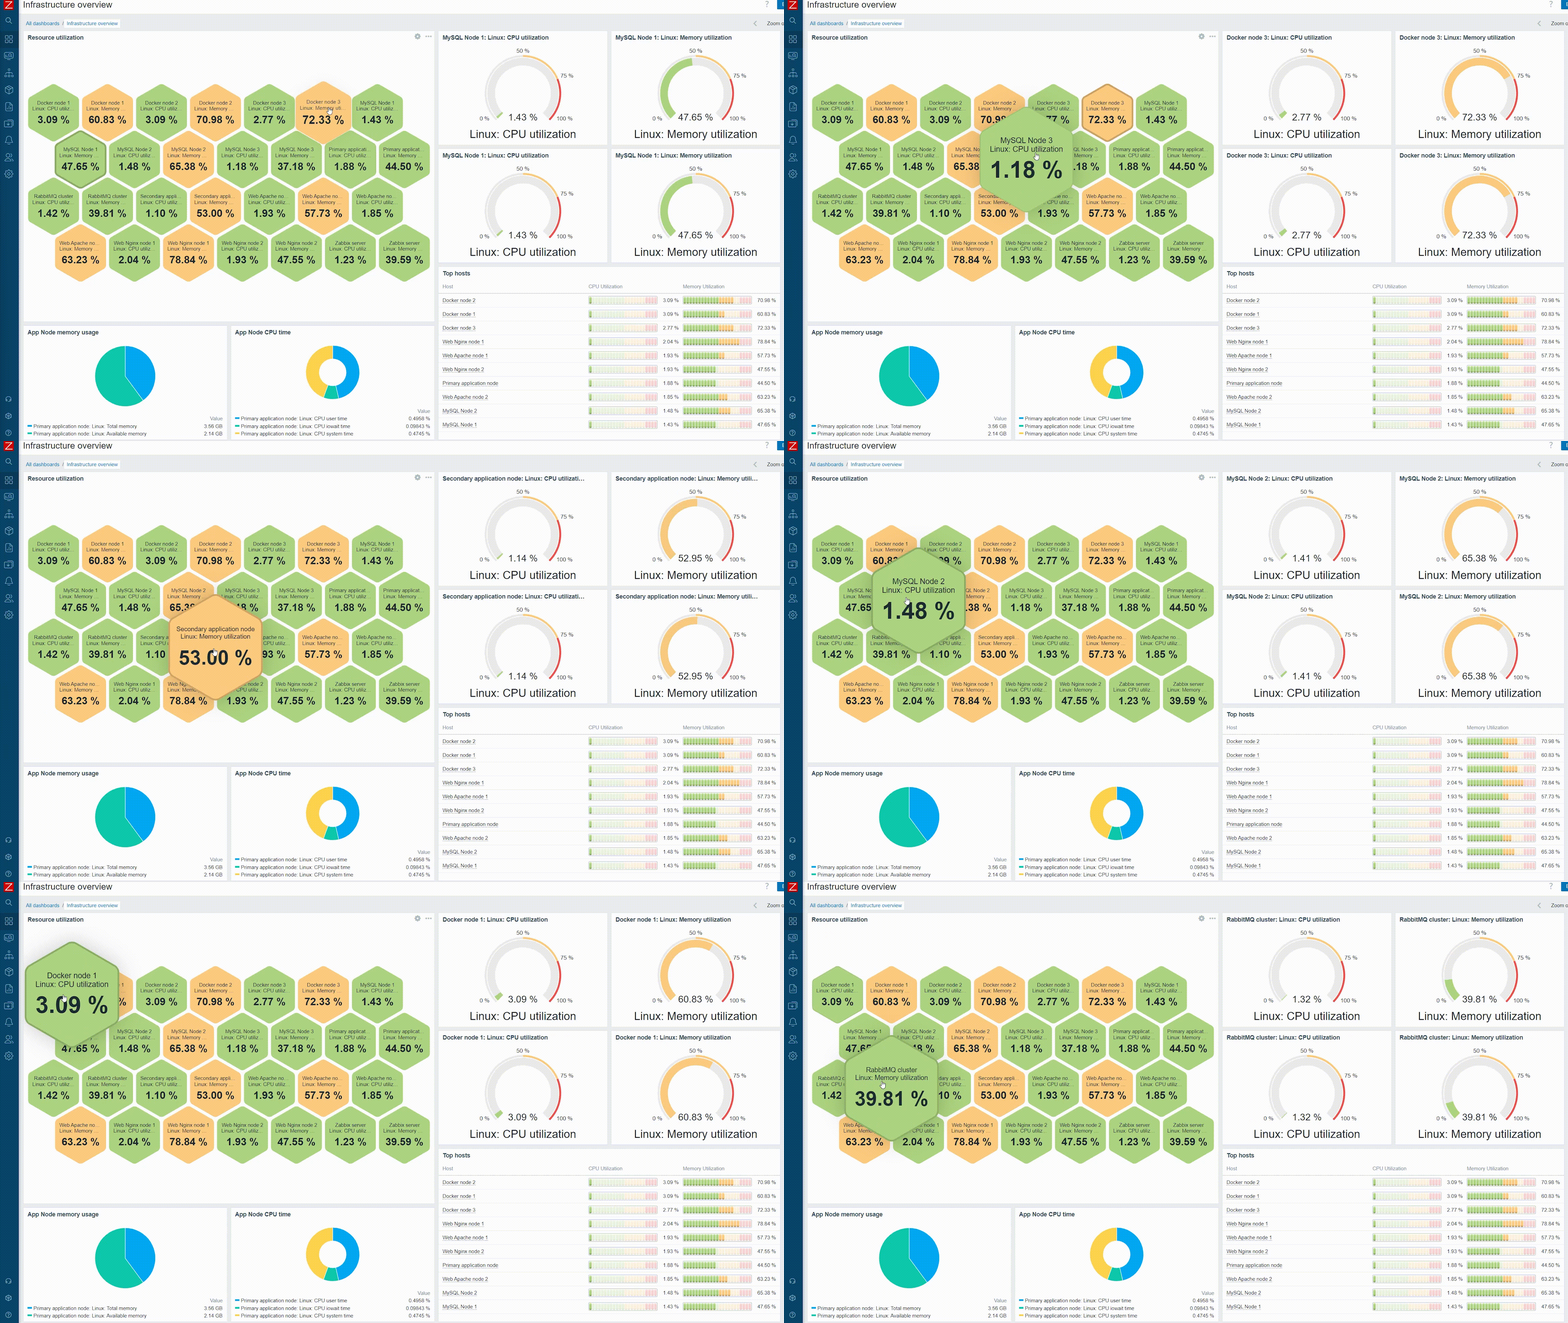
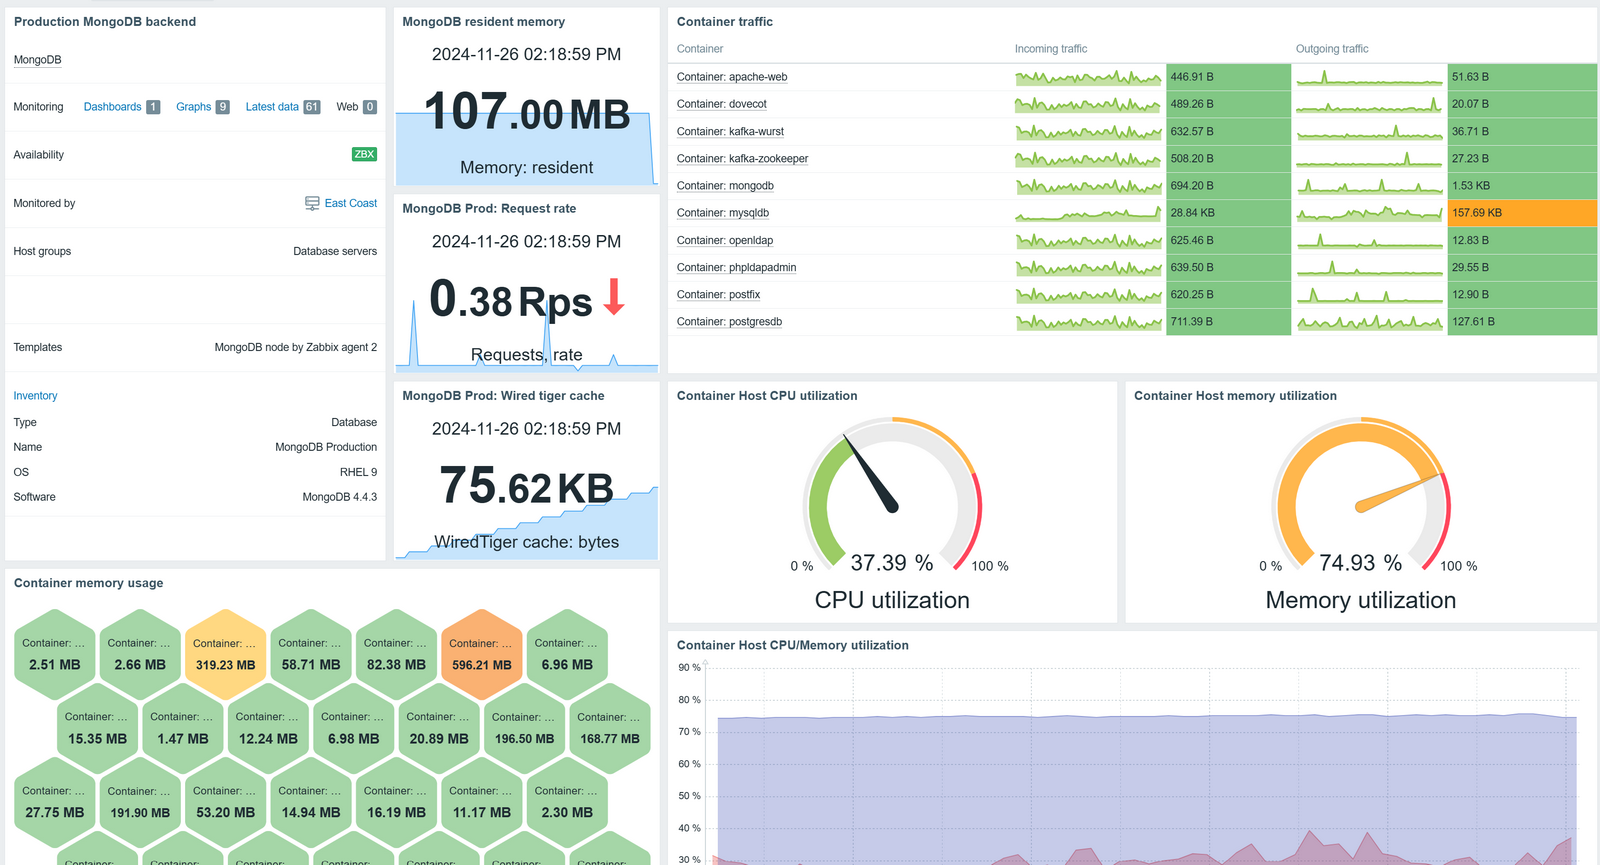
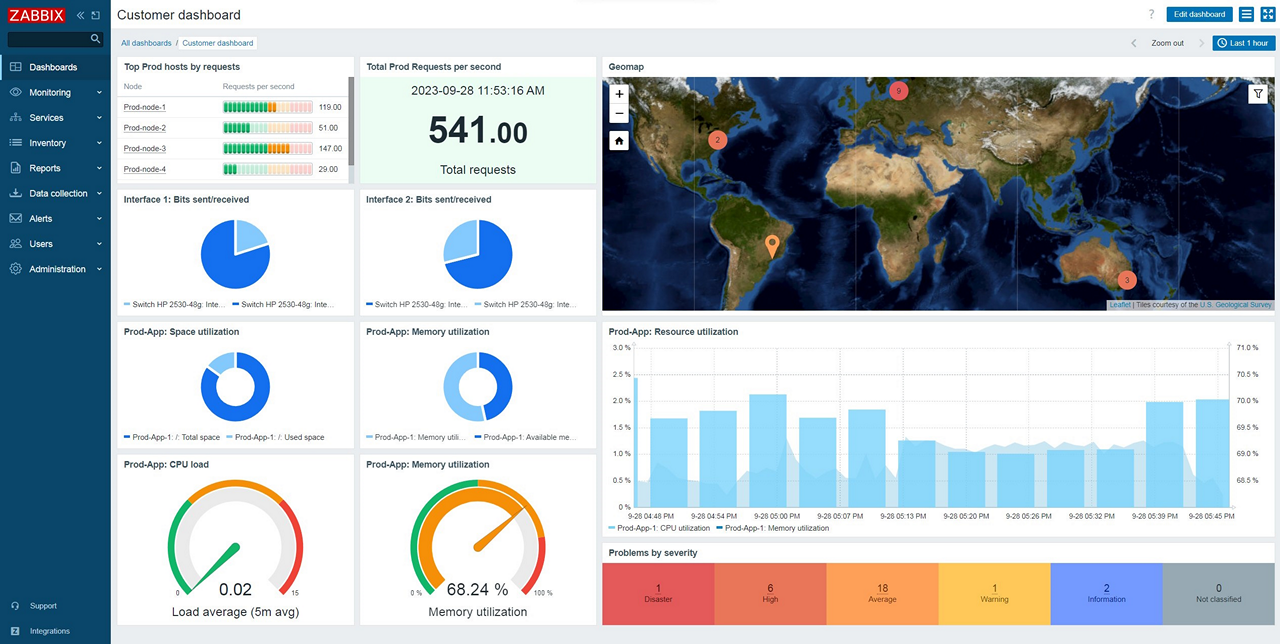
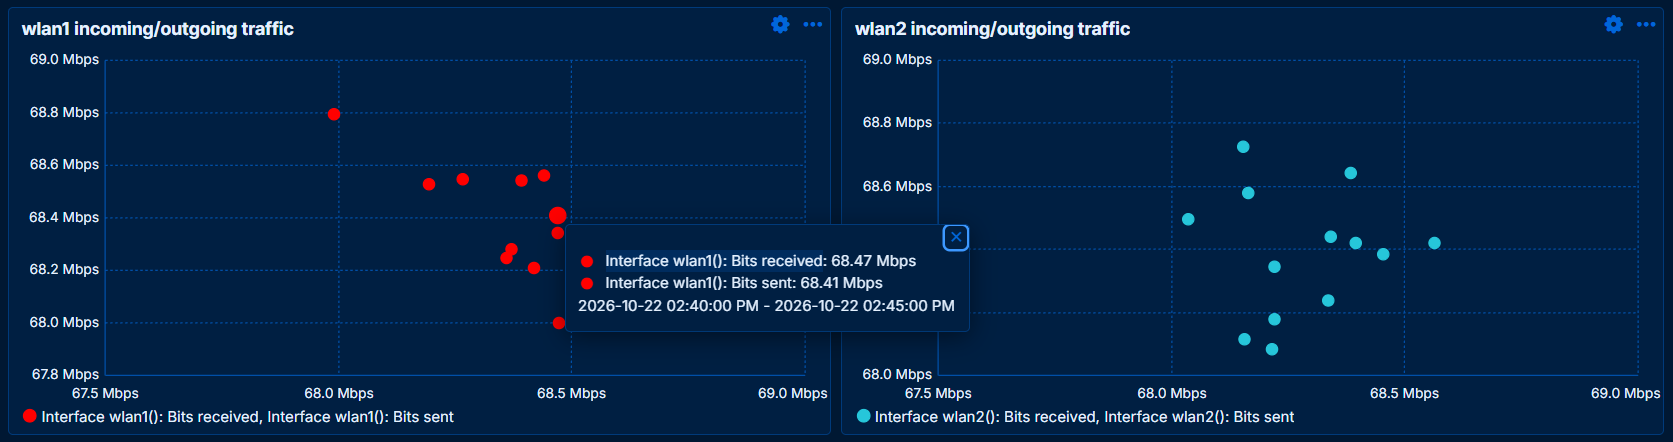
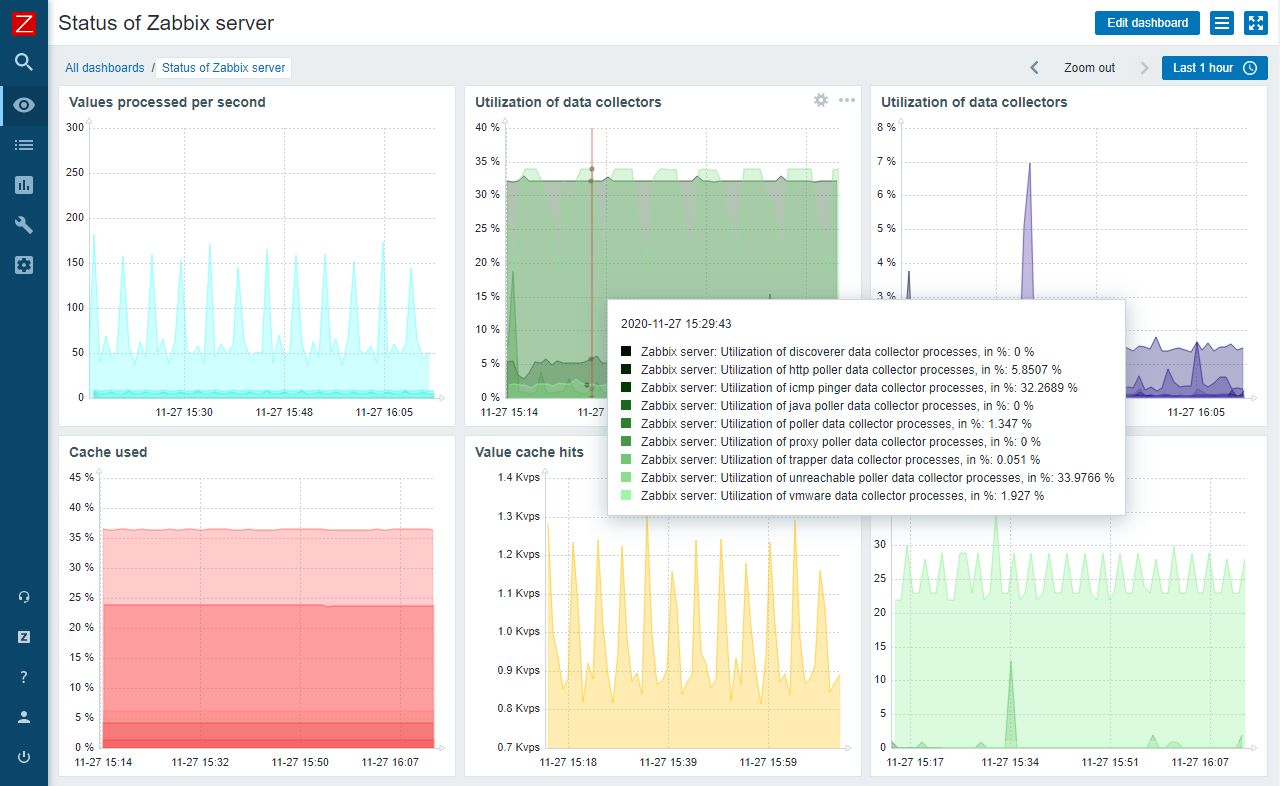
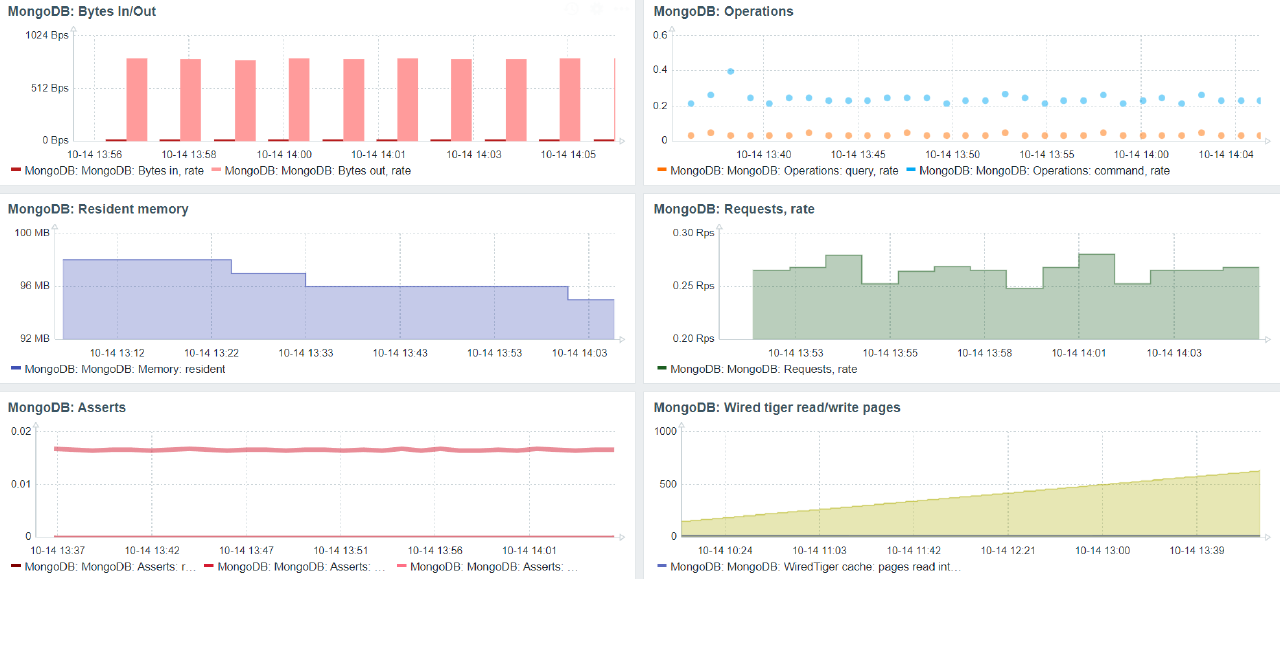
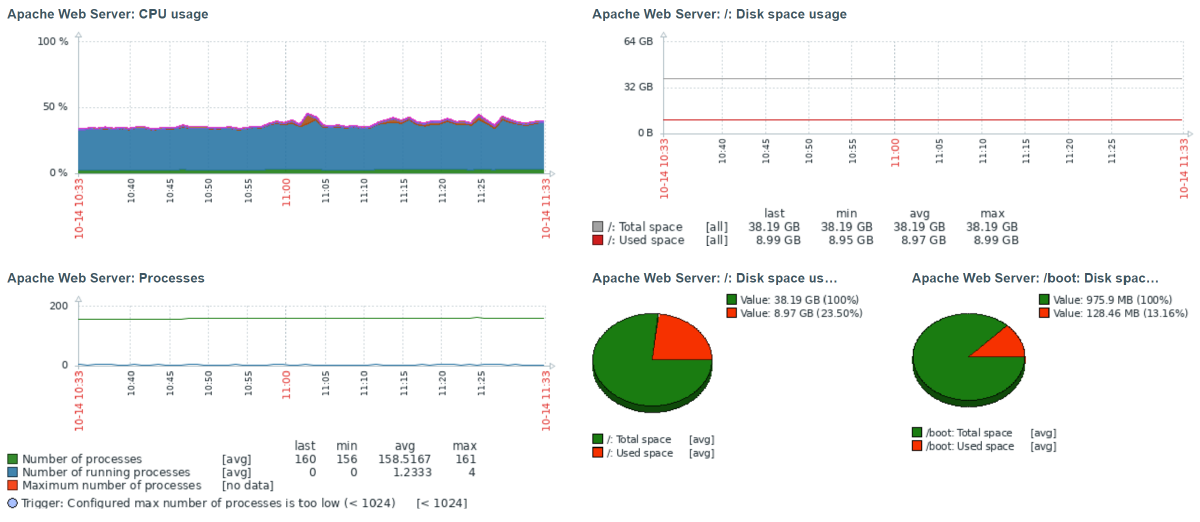
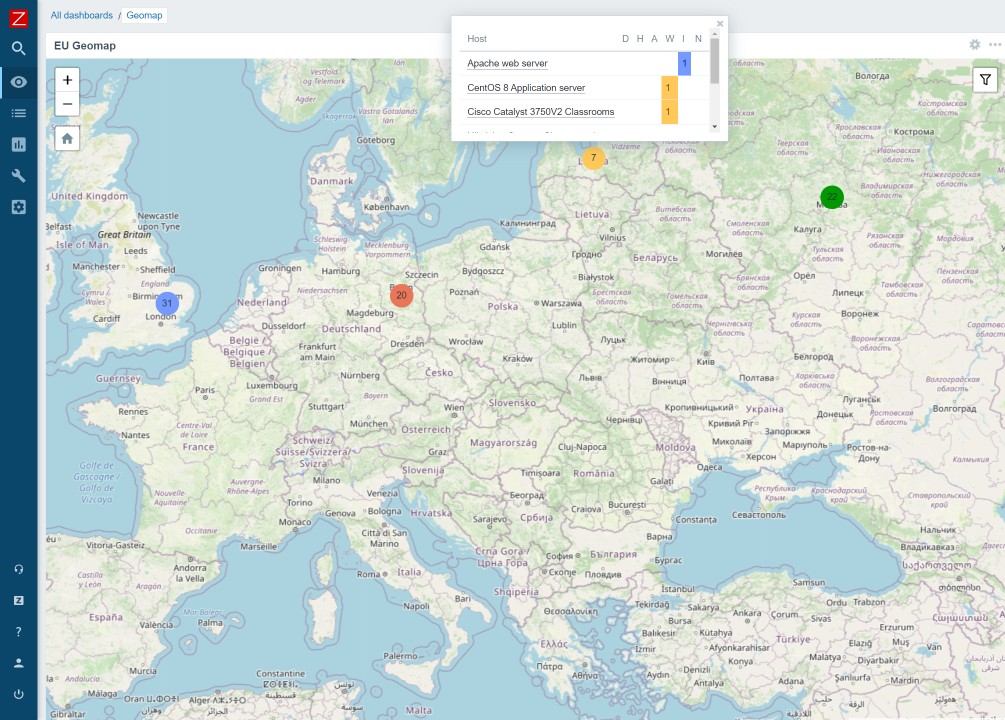
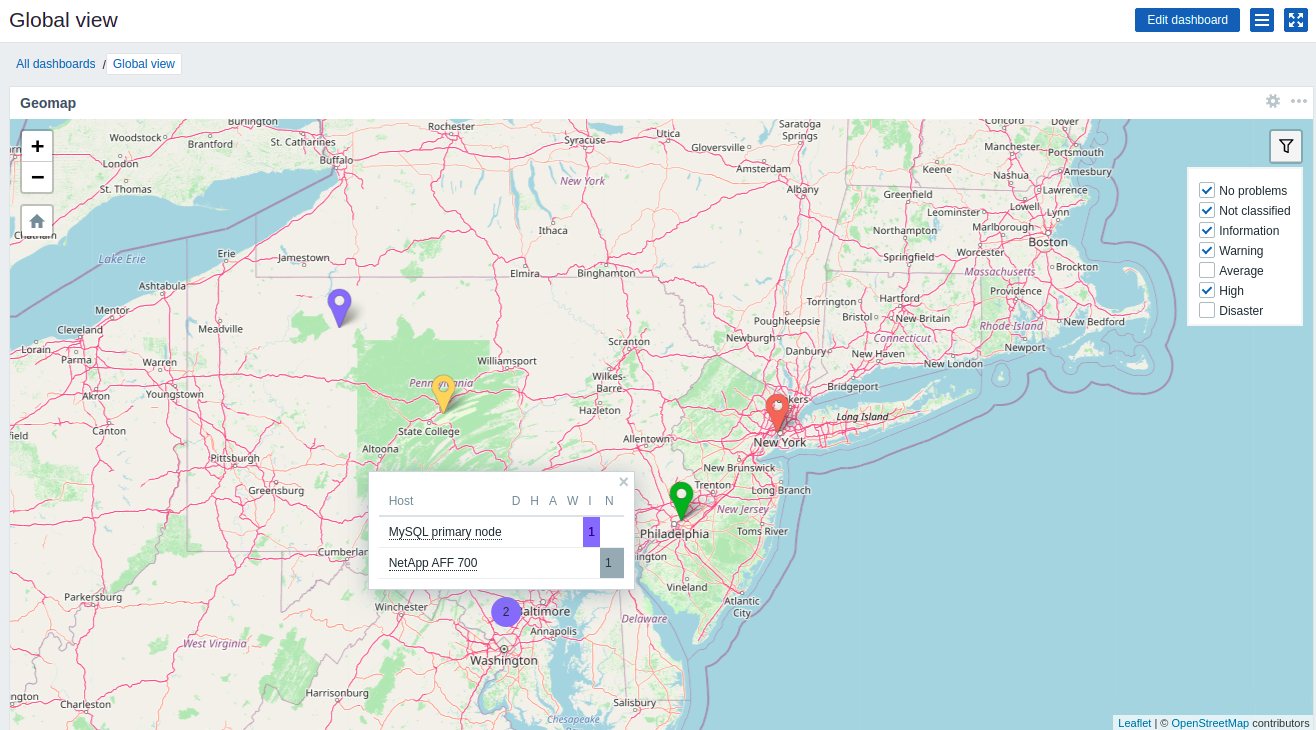
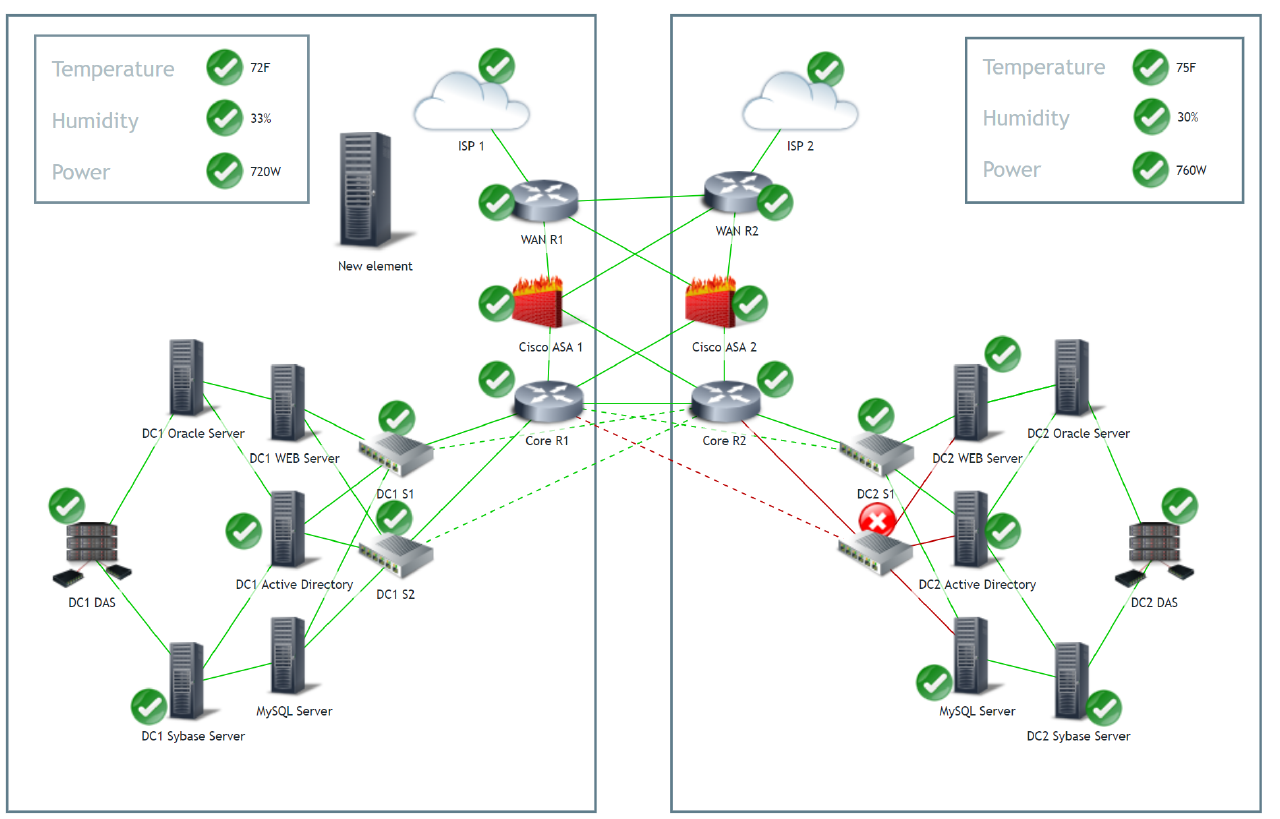
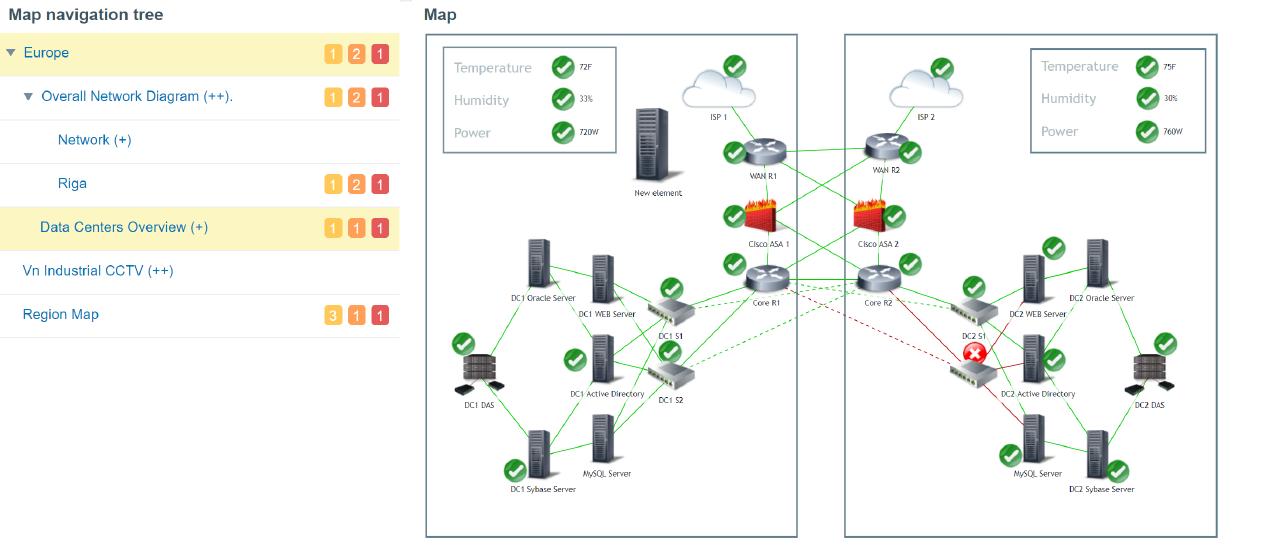
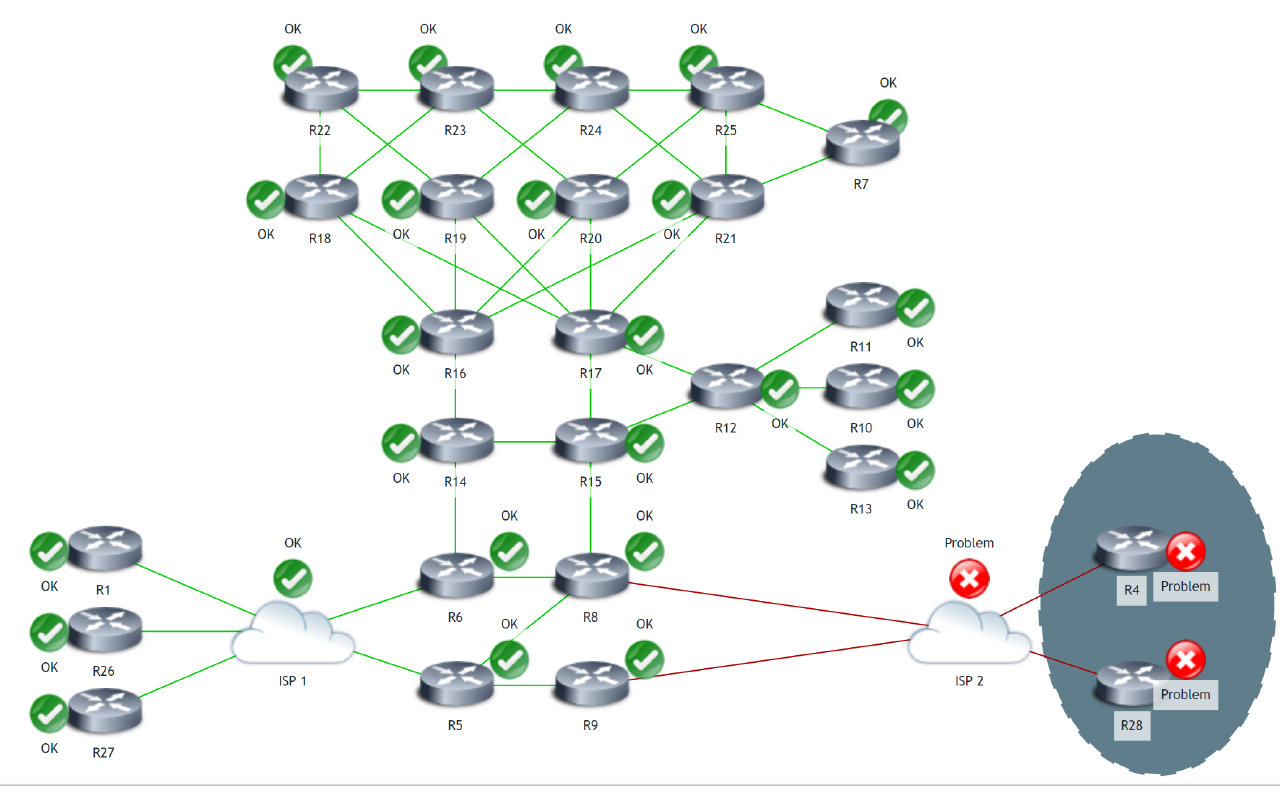
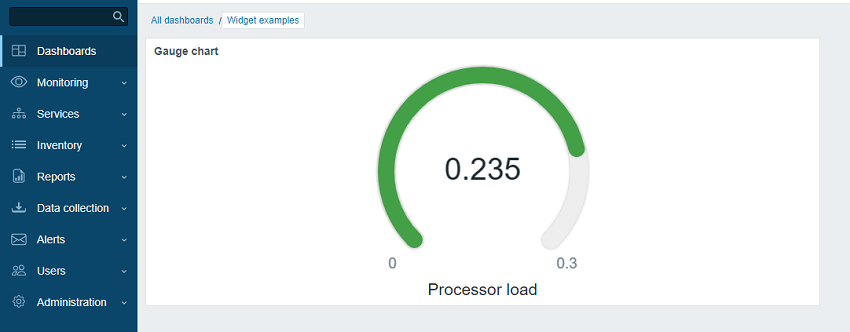
See your entire environment at a glance, with flexible dashboards that turn raw data into clear, actionable insight.
関連情報を表示するウィジェットベースのダッシュボードを定義することができます。
ボタンをクリックするだけでデータ、障害、レポート、マップへアクセスすることができます。
有用な統計情報を定期的にPDF形式のレポートとして送付することができます。
ダッシュボードをPDFレポートとして出力することができます。
Secure by default, and ready for the strictest compliance requirements.
Zabbixはユーザー権限を効率的に管理するための柔軟なユーザー権限スキーマを提供しており、分散環境でも効率的にユーザー権限を管理することができます。
以下の3つのレベルの権限を設定することができます。
ユーザーの種類は設定や管理機能へのアクセス権限を定義し、デフォルトの権限を指定するために使用されます。
MSPs and organizations with segregated access permission logic can make use of allow and deny lists for Zabbix proxy administration, thus restricting access to individual parts of the monitored infrastructure
Zabbixコンポーネント間のあらゆる通信を暗号化することができます。
様々なタイプのユーザーに対してきめ細やかに権限を設定した独自のユーザーの役割を作成することができます。
ユーザーの役割を利用することにより、ユーザーや顧客の要望にあわせてZabbixのUI要素の表示、非表示を切り替えることができます。
ユーザーの役割により以下を行うことができます。
Zabbixは既存の認証システムと統合することができ、様々な認証方式に対応しています。
HTTP、LDAP、SAML認証のネイティブサポートにより、Zabbixで作業する際に追加のセキュリティレイヤーを提供し、ユーザーエクスペリエンスを向上させることができます。
多要素認証(MFA)に対応し、エンタープライズレベルのセキュリティを実現し、ユーザー認証方法をより柔軟に設定できます:
入力した機密情報を保護するためのオプションを提供しています。
機密情報を厳重に管理するために外部にVaultをデプロイすることができます。
監査ログを利用して設定の変更を追跡することができます。
Integrate Zabbix with your existing tools - from legacy systems to cutting edge technologies.
インテグレーションはカスタマイズ可能なJavaScript Webhookとして提供されます。
以下のようなKubernetesコンポーネントも監視することができます。
監視データやイベントを外部のAIエンジンにストリーミングしたり、データレイクやデータウェアハウスにストリーミングして長期保存や分析を行うことで、さらなるデータ分析が可能です。
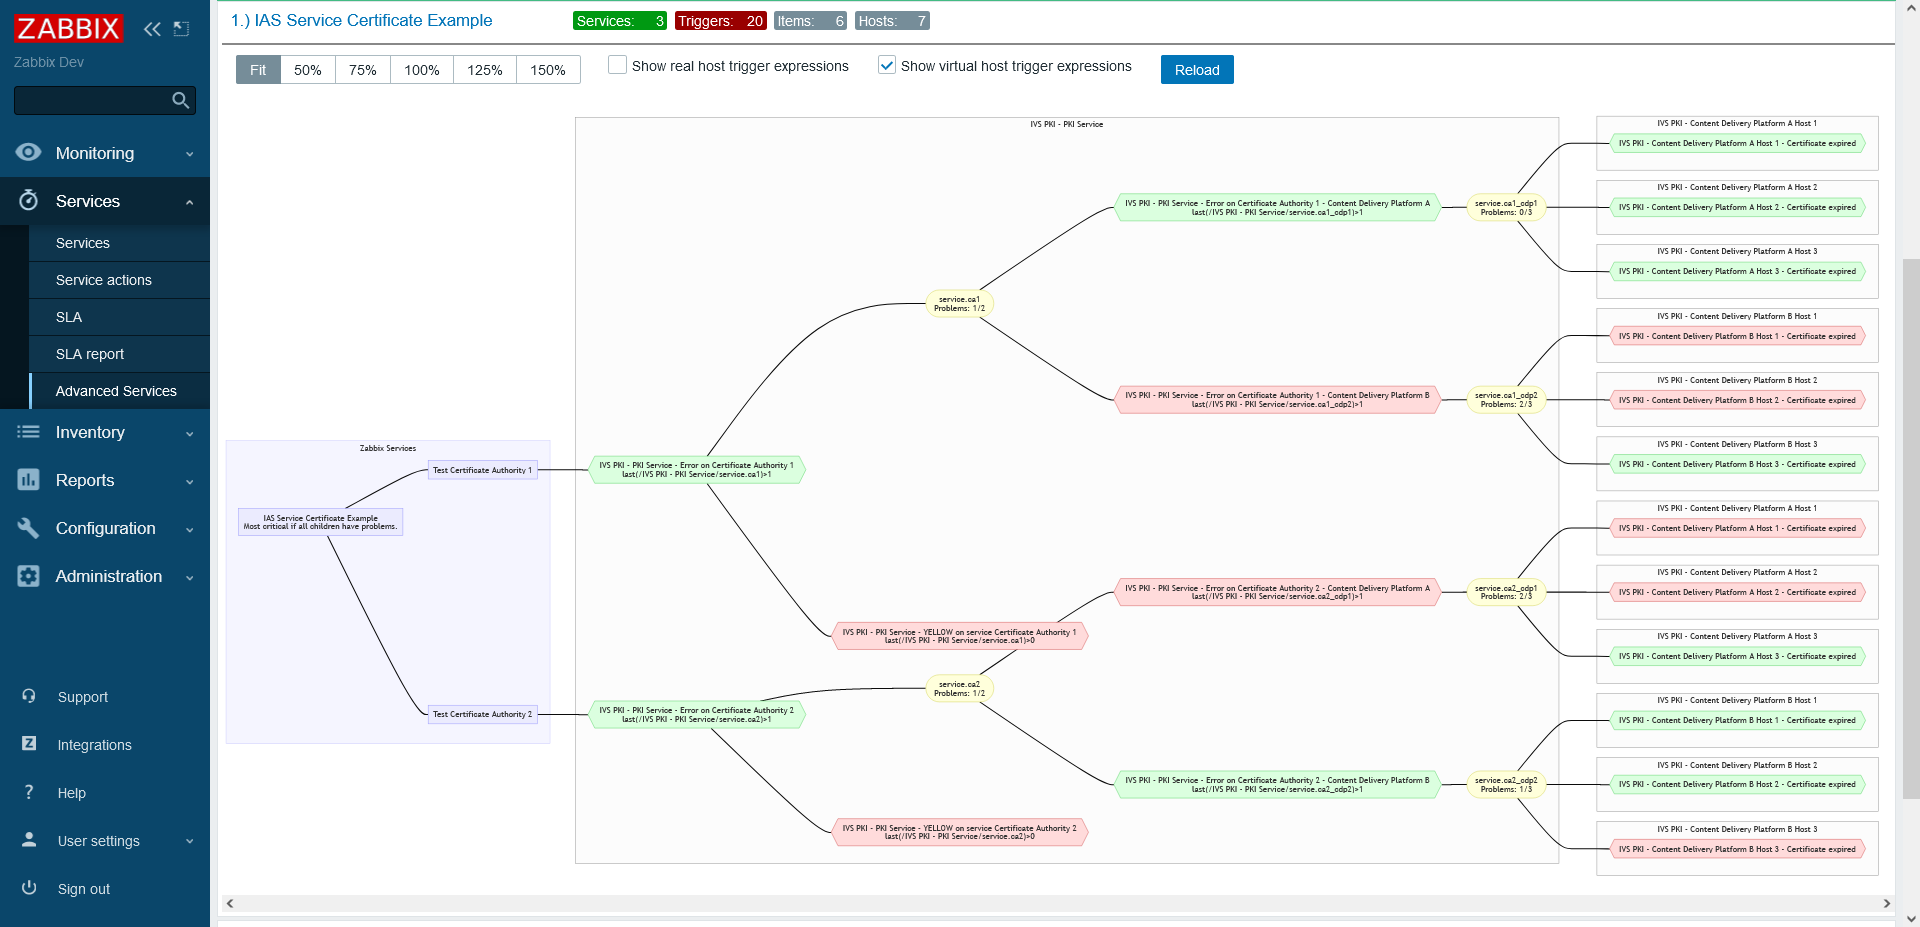
See how IT or OT issues affect your business, and track SLAs to prove you deliver on your commitments.
独自のSLA計算ロジックを使用してサービスと子サービスを定義します。
Run Zabbix wherever your business needs it, from your own environment to any public cloud.
個々のZabbixコンポーネントをデプロイするための様々な方法を提供しています。
リソースの検出により、監視対象エンドポイント上のメトリックを自動検出を可能にします。
リソースディスカバリには制限はなく、以下のようなエンティティを検出することができます。
豊富なテンプレートにより、すぐにインフラストラクチャの監視を開始することができます。
Zabbixは自動的にネットワークをスキャンし、検出されたデバイスを監視対象として追加します。
様々なサービスをスキャンし、監視対象が利用可能かどうかを確認します。
The Host Wizard will guide users through host creation and configuration:
Zabbixは自社インフラの監視だけでなく、さまざまな用途に利用することができます。Zabbixを使えば、マルチテナント環境で複数のお客様に監視サービスを提供することができます。
Zabbixはあらゆるユースケースに対応するユニバーサルな監視ソリューションとして位置づけられています。Zabbixはhttps://www.zabbix.com/license、オープンソースソフトウェアライセンスであるGNU Affero General Public License version 3 (AGPLv3)に基づいてリリースされた100%フリーのオープンソースです。これは非公開のソフトウェアにはない多くの利点を提供します:
Zabbixの画面とドキュメントは様々な言語に対応しています。私たちの目標は世界中の人々がZabbixを使いやすくすることです。Zabbixコミュニティ翻訳ツールでは、Zabbixをあなたの言語に翻訳するお手伝いをすることができます。
Zabbixコミュニティ翻訳作業の詳細と参加はこちらからご覧いただけます。
Zabbixはすべての機能を制限なく利用できるオープンソースの監視ソフトウェアです