
- 5 What's new in Zabbix 2.4.0
- Defining multiple filters for low level discovery
- Node-based distributed monitoring removed
- Ad-hoc graphs for several items
- Custom calculation of action conditions
- Support of new trigger operators
- Web monitoring improvements
- Optional SNMP bulk requests
- Graph prototypes supported in screens
- Option to remove missing resources when importing
- Frontend improvements
- Unified date and time format
- Global search by technical name
- Application filter for maps
- URL as dynamic screen element
- Responsible action shown in action log
- Description field added
- Trigger dependencies shown as links
- Option to see problems only in trigger status page
- More options for trigger filtering
- Maintenance period sorting
- Host menu changes
- Regular expression validation
- Dropping green status icons in listings
- Changing uploaded image type disallowed
- Changes regarding multibyte string support
- Miscellaneous improvements
- Macro improvements
- Daemon improvements
- Item changes/improvements
- API improvements
5 What's new in Zabbix 2.4.0
Defining multiple filters for low level discovery
The filter section in low level discovery rule definition has been split out into a separate tab and, most importantly, allows to define several filters as well as to define the calculation rules between the filters.
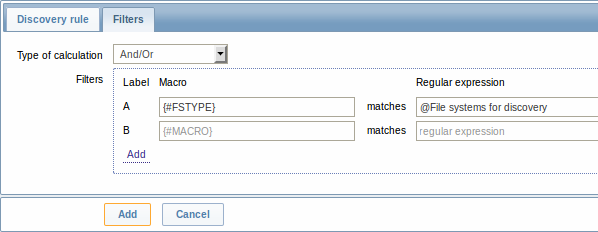
For more information, see low level discovery documentation.
Node-based distributed monitoring removed
Previously Zabbix supported two options for distributed monitoring - using nodes and proxies. In Zabbix 2.4.0 the support of node-based distributed monitoring has been discontinued due to existing limitations and potential problems with reliability in large environments.
While a new version of distributed monitoring may be considered and developed in the future, for the time being using proxies becomes the main distributed monitoring option in Zabbix. Furthermore, the proxy solution has proven itself over time as reliable, while also being easier in configuration and maintenance. Many users who initially had node-based distributed monitoring have switched to proxy-based setups.
For the remaining node-based DM users, during an upgrade to Zabbix 2.4.0, each upgraded node will be switched to a standalone Zabbix server keeping all configuration and history information from the local node and from the child nodes as well.
To maintain uniqueness of data from non-local nodes, all the fields will be prefixed with N<nodeid>_. If the length of the new value exceeds max field size, it will be trimmed. Highly unlikely, but if the new value already exists in the database, the situation will be caught by a check on duplicates. Global macros will be processed in a special way by adding N<nodeid>_ after the dollar sign, for example, {$N123_MACRO}.
Ad-hoc graphs for several items
New in Zabbix is the ability to create instant ad-hoc graphs for several items. If previously it was possible to access a simple graph for one item at any time in the latest data page, creating custom graphs with several items took a little more effort.
While offering quite a bit of flexibility, creating custom graphs was not particularly quick or easy to maintain, especially, if you wanted to compare a handful of items where their respective hosts were created and then deleted after a while. To address this issue it has now been made possible in Zabbix to create ad-hoc graphs for several items in a very quick way.
For that, similarly as for accessing simple graphs, you go to Monitoring → Latest data.
The section no longer has the host and host group selection dropdowns. Instead, those two choices can be made within an expanded filter section, which can be used flexibly for displaying the exact set of items you want. Additonally, items now have checkboxes in the listing.
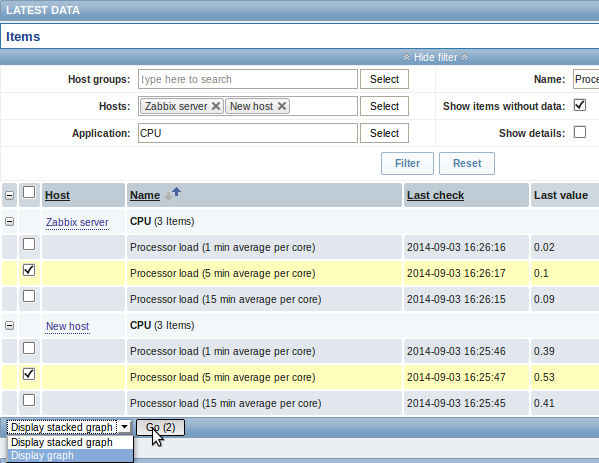
To get a quick graph at any time, select the desired items, choose Display stacked graph or Display graph in the dropdown below, click on Go and have the respective graph created instantly.
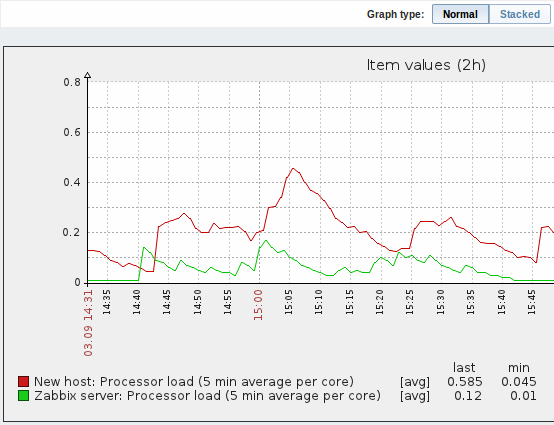
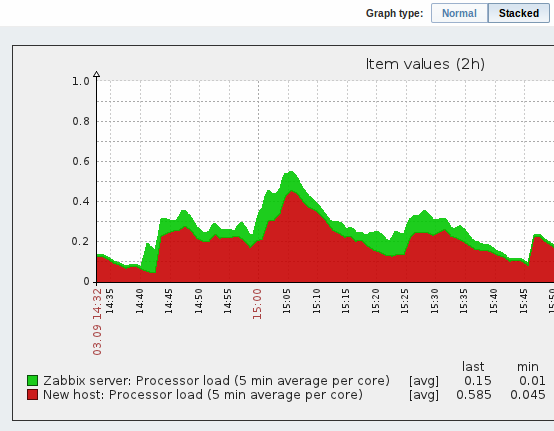
Note that in the created graph window you have the time period selector available and the possibility to switch from the "normal" line graph to a stacked one (and back).
Custom calculation of action conditions
While the previous ways of
calculating
action conditions (And, Or, And/Or) offered some flexibility, there were
clear limitations as well. In a simple case of using And/Or, if you had
two groups of the same condition type, you could not use AND within
one group and OR within the other.
To lift such limitations, action conditions now can be calculated using a completely custom formula, such as
(A and B) and (C or D)
(A and B) or (C and D)
((A or B) and C) or D
etc.
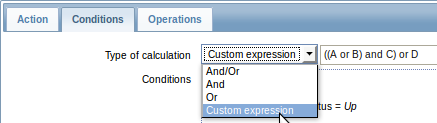
The formula must include all conditions (represented as uppercase letters A, B, C, ...) and may include spaces, tabs, brackets ( ), and (case sensitive), or (case sensitive).
The custom calculation option is available for action conditions as well as for multiple filters in low-level discovery where it was first introduced.
Support of new trigger operators
The list of operators supported in trigger expressions has been extended with three new ones:
- >= - greater than or equal
- <= - less than or equal
- not - logical NOT
In additional development, the syntax of three existing operators has been changed with the aim of making trigger expressions easier to read. Thus:
#(not equal) is now expressed with <>&(logical AND) is now expressed with and|(logical OR) is now expressed with or
Note that the old operators are no longer supported, so the new ones have to be used instead. Note also that the new and, or, not operators are case-sensitive and must be surrounded by spaces or parentheses. For more details, refer to the trigger operator section.
In a related development, the support for newlines and tabs in trigger expressions has been added.
Web monitoring improvements
Ability to specify custom headers
It is now possible to specify custom headers for HTTP requests in web monitoring:
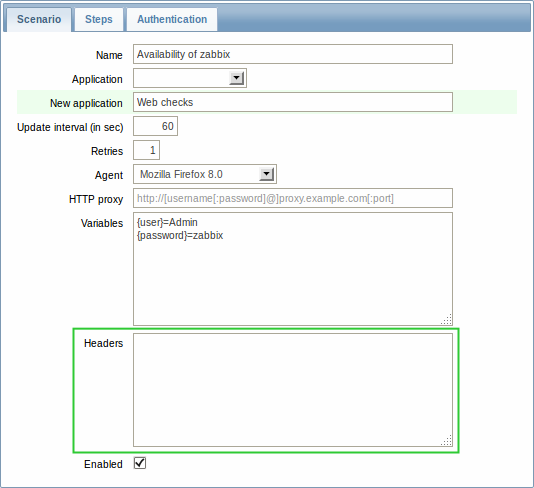
Custom headers are available on both the web scenario and scenario step levels. You can also request a page header only and optionally disable follow redirect functionality on the scenario step level.
In a related development, the maximum URL size limit has been increased from 255 to 2048 characters.
SSL verification and authentication options
A new Authentication tab has been added to the web scenario configuration form holding the already familiar Authentication dropdown and several new fields all related to SSL options:
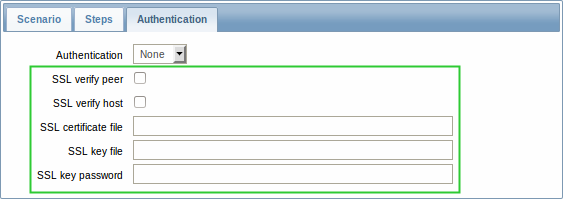
Two of these options help authenticate the server to the client:
- SSL verify peer - will check that the certificate provided by the server is valid (trusted by a known certificate authority, not revoked, expired, etc.)
- SSL verify host - will check that the server name actually matches the name in the certificate
With the new SSLCALocation server parameter Zabbix also provides an option of specifying a separate directory for the certificates, which, if set, will override the system-wide directory.
Using SSL certificates is also a way of authenticating the client to the server. For this purpose three new options are available:
- SSL certificate file - you may specify the client certificate that is sent to the web server when establishing an SSL connection. Unless it contains the client private key the client private key file must be specified separately in the following field
- SSL key file - specify the client private key
- SSL key password - specify the client private key password if the key is encrypted
The new SSLCertLocation and SSLKeyLocation server parameters determine the path to client certificate and private key files.
Clearing history and trend data
A Clear history and trends button has been added to the web scenario configuration form.
Optional SNMP bulk requests
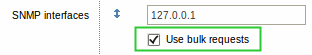
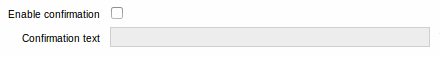
Bulk processing of SNMP requests was first introduced in Zabbix 2.2.3. While providing benefits in terms of reduced network traffic and load on SNMP devices, it also encountered problems with a number of devices that did not respond to these requests as expected.
As a result, SNMP bulk processing has been made optional in Zabbix 2.4.0. Enabled by default, it can be disabled per interface in host configuration by unchecking the respective option:
Graph prototypes supported in screens
Zabbix screens have gained two new resources:
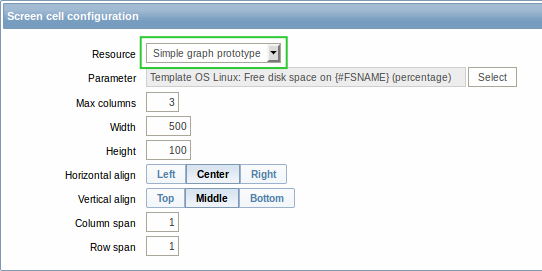
- Graph prototype;
- Simple graph prototype.
The Graph prototype resource is based on custom graph prototypes created in low-level discovery (LLD) rules.
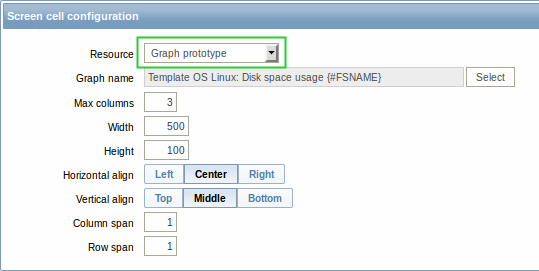
In monitoring, the screen cell will display an LLD-generated graph as soon as it is generated. If the graph is not generated, nothing will be displayed.
A Simple graph prototype is based on item prototypes in low-level discovery. In monitoring, the screen cell will display a graph created from an LLD-generated item. If the item is not generated, nothing will be displayed.
The functionality is supported for host and template screens. With template screens, graph prototypes can be selected from the respective template only.
Option to remove missing resources when importing
When using the XML import function before, it was possible to create new elements and update those that already existed. While that seemed to cover most needs, one option was missing.
For example, you would export a template, then update it by removing some items and triggers from it. However, when importing the same template back, the removed items and triggers would again be there since they are still on the original template. For this situation, Zabbix 2.4 offers a new Delete missing option for deleting resources that are not in the imported XML file. This option is implemented for host and template import.
Note that the host/template macros not present in the imported XML file will be deleted too.
Additionally, the Add missing option has been renamed to Create new, to avoid confusion with the new option.
Frontend improvements
Unified date and time format
Date and time format has been unified across Zabbix frontend according to the ISO 8601 standard of YYYY-MM-DD hh:mm:ss. The new format is implemented everywhere except graphs.
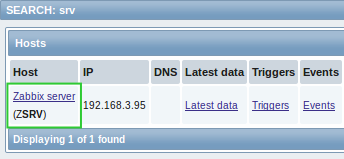
Global search by technical name
In recent Zabbix versions, hosts and templates could only be searched for by their visible name. Now they can be searched by technical name as well. If a match is found for the technical name, it is displayed in parenthesis below the visible name.
Application filter for maps
A new "Application" filter has been added for host and host group map elements in maps.
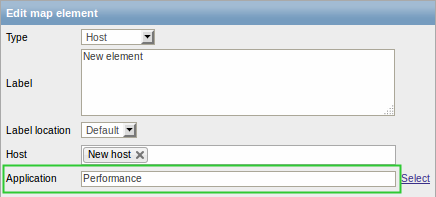
The field can contain a name of an application and allows to only display problems of triggers that belong to the given application.
URL as dynamic screen element
In screens, URL now is a dynamic screen element:
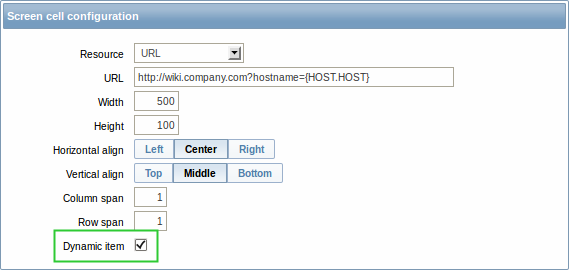
To support the new functionality, several macros are supported in the
URL field: {HOST.CONN}, {HOST.DNS}, {HOST.ID}, {HOST.IP},
{HOST.HOST}, {HOST.NAME} and {$MACRO} user macro.
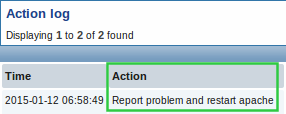
Responsible action shown in action log
The action log (displayed in the Administration → Audit section and in the History of actions screen element) would previously display various details about action operations (such as notifications sent, commands executed), however, the name of the responsible action was not displayed.
Now the Action log/Action log screen element have gained a new Action column showing the name of the responsible action as well.
Other improvements include:
- renaming page titles in Administration → Audit:
- 'Actions' to 'Action log'
- 'Logs' to 'Audit log'
- renaming 'History of actions' screen element to 'Action log'
- showing user alias, name and surname with notification recipient information (in addition to the previously displayed e-mail address)
- merging action operation Status and Retries left columns into one Status column.
For more information, see the audit section documentation.
Description field added
A new description field has been added to host, template and proxy configuration. The field may be used to provide details on how to install and use a template, have links to external resources, list user parameters, etc.
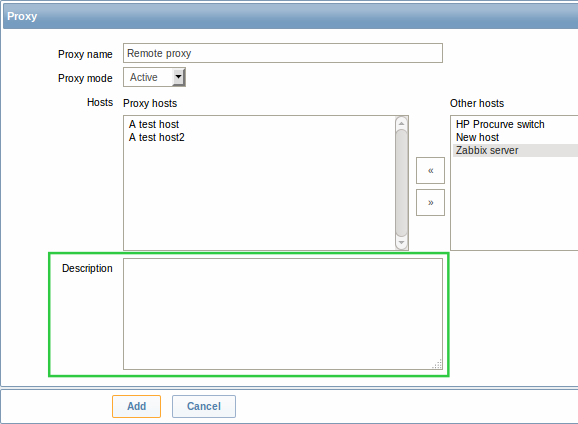
For hosts, the description field content is also visible in host inventory overview.
Trigger dependencies shown as links
Trigger dependencies previously were displayed as just plain text listing of trigger names. Now the trigger names are displayed as links leading to the trigger configuration. Links are green for enabled triggers, while red indicates that the trigger is disabled.
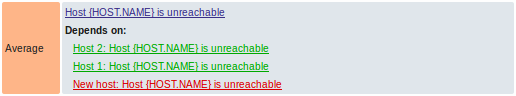
Dependencies are also shown as links (in blue) in trigger configuration and mass update forms. Additionally, a comma separated host list is displayed there if a trigger belongs to multiple hosts.
Option to see problems only in trigger status page
Filtering options in Monitoring → Triggers previously allowed to either show all triggers regardless of status, or to show problem triggers, which included those that have recently switched to OK.
The second option meant that if many triggers were switching to OK simultaneously, it became difficult to spot triggers that still remained in problem status. To deal with this situation, a third specific filtering option is now available showing only those triggers that still remain in problem status - this option now is called Problem.
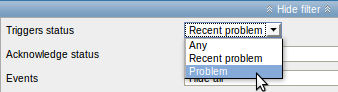
The first two options remain in place, however, the one that used to be called Problem now is called Recent problem.
More options for trigger filtering
Filtering in Monitoring → Triggers has gained a couple of new options:
- Filter by application
- Filter by host inventory (multiple values can be used)
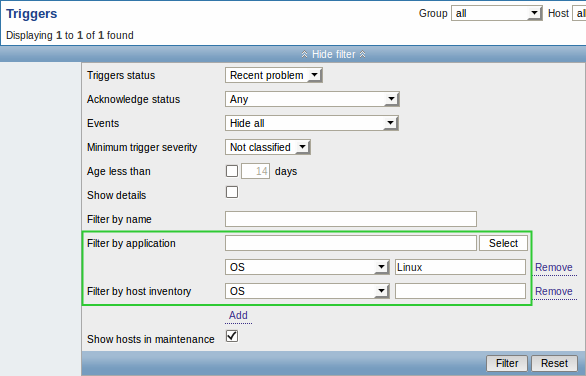
Additionally, the fairly large trigger filter now features in two frontend sections:
- Monitoring → Triggers
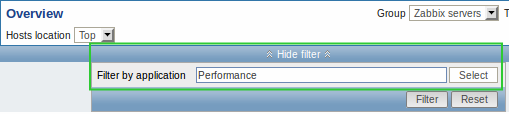
- Monitoring → Overview (with Triggers selected in the Type dropdown)
Note that in Monitoring → Overview, with Data selected in the Type dropdown, a small filter is displayed offering the possibility to filter data by application (an option, which was introduced in 2.2 version as an additional dropdown in the title bar).
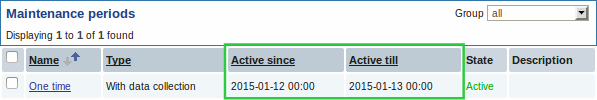
Maintenance period sorting
Maintenance periods can now be sorted by two new columns added to the list - Active since and Active till:
Host menu changes
Linking to graphs
The host menu has gained a new entry for quickly accessing host graphs.
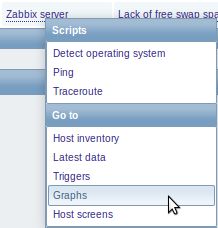
Unavailable links shown
Unavailable links that previously were hidden now are shown as disabled
- meaning greyed out and not clickable.
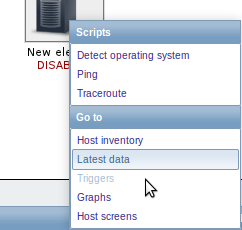
Synchronized in maps
The menu available for hosts in Monitoring → Maps has been synchronized with other host menus to display the same selection of links.
The host menu is accessible by clicking on a host in several frontend sections. See more details about the host menu.
Regular expression validation
Regular expressions are now validated before saving a global regular expression. For incorrect regular expressions errors are also displayed when testing.
Dropping green status icons in listings
Previously, green status icons were displayed in the last Error column of the item and trigger listings, for error-free entries, which could be misunderstood as if, on the contrary, the entries had errors. Now the green icons are displayed no more and, additionally, the column is renamed to Info.
 |
 |
| Before Zabbix 2.4.0. | In Zabbix 2.4.0. |
For items/triggers with problems, as before, a red square icon is displayed in this column.
Changing uploaded image type disallowed
The type of uploaded images previously could be freely changed from Icon to Background in the Images section of Administration → General.
That could be potentially dangerous since an icon, used in a network map, could be changed to background thus making the map unsaveable in the future. To avoid this situation, the option of changing image type has been removed and the image upload form has been separated into two forms - one for icon and one for background upload.
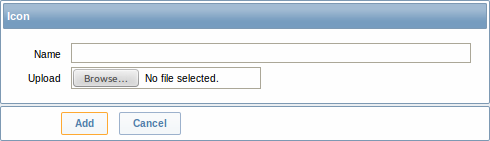
This is also indicated by different names of the upload buttons - Create icon and Create background.
Changes regarding multibyte string support
Zabbix frontend now displays fatal error if mbstring PHP functions are
not enabled. There are no string wrapper functions anymore; they have
been replaced by string and/or mbstring functions accordingly.
Additionally, the mbstring.func_overload option from php.ini is
required to be off, and a warning will be displayed in Status of
Zabbix if it is enabled.
Miscellaneous improvements
- Save buttons have been replaced by Add or Update depending on whether a new entry is created or an existing one updated.
- More intuitive naming for the use of filter has been introduced. If previously Filter stood for both show and hide functions (with only very tiny icons indicating the direction), now separate Show filter and Hide filter names have been introduced.
 |
 |
 |
 |
| Before Zabbix 2.4.0. | In Zabbix 2.4.0. |
- Disabled input fields previously were not distinguished much, which could create confusion as to why they were not available for editing. Now these fields are distinguished with a grey background, for example, in host inventory, web scenario step or global script definition forms.
 |
Before Zabbix 2.4.0. |
 |
In Zabbix 2.4.0. |
- The Rows per page setting from User profile previously was not applied to the Availability report section of the frontend, leading to difficulties when loading the page on installations with a lot of triggers. Now the setting is in force and can be used to limit the number of records displayed in one page.
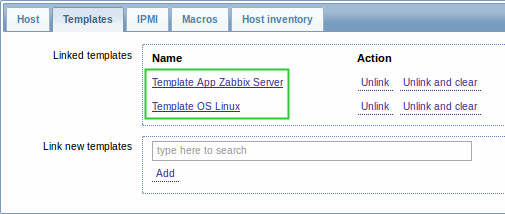
- Templates listed in the host configuration have been made clickable. Clicking on a template name opens the template configuration form.
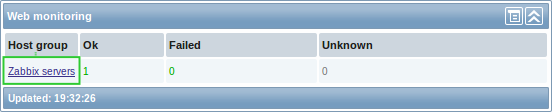
- Host groups listed in the Web monitoring widget of the frontend have been made clickable. The link leads to Monitoring → Web with scenarios of the respective host group selected.
- Previously, only one host was listed in event details, even if the trigger expression contained several. Now, all hosts from the expression are listed.
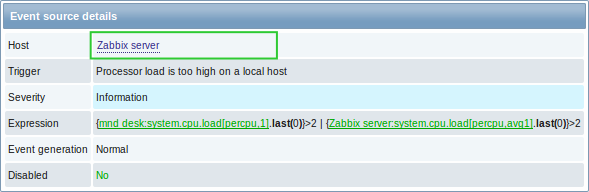 |
Before Zabbix 2.4.0. |
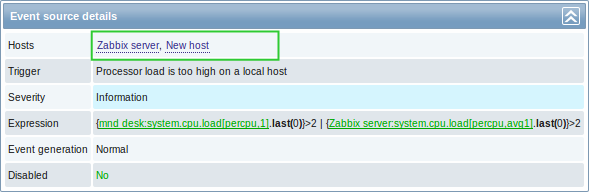 |
In Zabbix 2.4.0. |
- Monitoring → Latest data filter option Show items without data is now enabled by default
- Cancel button has been added to Monitoring → Dashboard filter
- In the user list, disabled groups in the Group column are now displayed in red
- In the user group list, Status column has been moved to the end
- The value of
Max count of elements to show inside table cellfrom Administration → General → GUI now also applies to templates listed in the host list, users listed in the user group list and user groups listed in the user list - When a trigger belongs to many hosts, hosts are now displayed in alphabetical order
- For numeric items with disabled history ('history' and 'trends' set to 0), the Graph link is hidden from view in Monitoring → Latest data. If history and trends are set to '0' globally in Administration → General → Housekeeping, then all Graph/History links are hidden in Latest data.
- Hyperlinks in the first column of Inventory → Overview now are displayed properly as links, not plain text.
- If evaluation for nodata() function fails due to lack of data on the server, a more informative message is displayed. Previous vague message of Evaluation failed for function... has been expanded to include item does not have enough data after server start or item creation.
- Auto-login and Auto-logout controls have been removed from 'guest' user profile, as unnecessary.
- Saving global regular expressions with a leading space (like " 1") now works correctly. Moreover, spaces and tabs are dealt with correctly before, after and within expression text.
- A forward slash (/) in global regular expressions is treated literally, rather than a delimiter. This way it is possible to save expressions containing a slash, whereas previously it would produce an error.
- Proxy name is now displayed as host prefix in the item queue details page.
- The trigger filter will no longer be reset when selecting all hosts on the Monitoring → Events page.
- IT services in pop-up windows are now sorted by name.
- IT service dependencies in the configuration window are now sorted by name.
Macro improvements
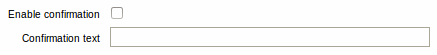
User macros {$MACRO} now are available in notifications and commands.
Two new macros - {HOST.DESCRIPTION} and {PROXY.DESCRIPTION} are
supported for use in notifications and commands. {HOST.DESCRIPTION}
can also be used in map labels.
Host level macros - {HOST.HOST}, {HOST.NAME}, {HOST.IP},
{HOST.DNS} and {HOST.CONN} along with user macros {$MACRO} are
available in simple low-level discovery rule filter regexps.
For more details, see Macros supported by location.
Daemon improvements
Zabbix application names appearing in syslog have been corrected. The
new names are: zabbix_server, zabbix_proxy, zabbix_agentd, and
zabbix_agent.
** Low-level discovery **
A new item key has been introduced (system.cpu.discovery) that allows enumerating processors and their states on the target machine. On *nix systems, the processors (or cores) will be reported in two states - as being "online" or "offline". On Windows a third, "unknown" state, is possible. A processor is considered to be in an unknown state when it has been detected, but no data has been collected from the performance counter.
** Internal items always processed **
Internal items previously were not processed if a host went into maintenance with 'no data collection'. Now internal items are always processed by server or proxy regardless of host maintenance status.
** Config file handling **
Any problem in the config file is checked for and reported before writing to the logfile. Error message is printed in the terminal window now.
zabbix_agentd no longer requires a configuration file to be present,
loaded or specified when launched with options that don't require a
configured setup on the Windows platform.
Alias parameter keys in the agent configuration file are now validated to be proper Zabbix item keys. These keys now also support colon symbols in their parameters.
A new configuration parameter (User) has been introduced for daemons which allows dropping privileges to the specified user if the daemon has been started by the root account.
When using the Include parameter in the agent configuration file for Windows it is now possible to include all files from a directory.
Server and proxy now refuse to start if StartPollersUnreachable configuration parameter is 0, but regular, IPMI or Java pollers are started. Otherwise, hosts that become unreachable would never be checked again.
** Ability to include specific files from Include directory **
Pattern matching has been introduced in the Include directives of Zabbix
daemon configuration files, using the asterisk wildcard character. Thus,
to only include relevant files in the specified directory, something
like /path/to/config/files/*.conf may be used.
** JSON formatting **
The formatting of JSON objects (with tabs and new lines) has been removed, which allows the traffic to be reduced by 20-30% when data is sent between Zabbix services. Additionally, the escaping of forward slash or solidus (/) has also been removed.
** Log file handling **
At DebugLevel=0 only basic information is printed to the logfile/syslog. For agents it is Zabbix version, used config file, started/stopped Zabbix processes. For proxy and server - Zabbix version, enabled features, used config file, DB version, started/stopped Zabbix processes. The logging is also consistent on Linux and Windows machines now.
** Handling automatically discovered hosts **
Hosts discovered by a network discovery rule will be removed automatically from Monitoring → Discovery if a discovered entity is not in the rule's IP range any more. Hosts are removed immediately.
** More details about unsupported agent items **
Zabbix agents now provide detailed information on why items become not
supported, instead of the generic "Not supported by Zabbix Agent". This
was achieved by extending the passive agent and active agent protocols
(see protocol documentation).
However, new agents are compatible with older server and proxy, except
the error message for passive agents will not be visible in the
frontend. Querying values with zabbix_get, testing with
zabbix_agentd -p and zabbix_agentd -t now also provides a detailed
error message.
As a result, in Configuration → Hosts → Items of the frontend, when rolling the mouse over the error icon, you may expect to see more specific messages about why an item went unsuported.
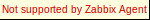 |
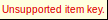 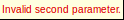  ... |
| A single message before Zabbix 2.4.0. | More informative messages in Zabbix 2.4.0. |
Additionally, maximum message length has been increased from 128 to 2048 symbols. This should reduce the possibility of error message being trimmed.
** Database related changes **
The DBSchema configuration parameter in both the zabbix_server and
zabbix_proxy configuration now also applies to PostgreSQL databases in
addition to IBM DB2. If this parameter is left undefinied, a default of
public is used as the name of the DBSchema.
A check that prevents starting the proxy with a server database and vice versa has been added.
Support for PHP mutexes has been removed on the server side due to licensing issues. While it was not recommended to use Zabbix server and frontend with SQLite3 database before, this change makes it even less recommended, because simultaneous database access with Zabbix server and frontend may now corrupt the database. Note that using Zabbix proxy with SQLite3 database is still a perfectly valid solution.
** Housekeeper changes **
On zabbix_server and zabbix_proxy startup housekeeping is postponed
for 30 minutes instead of running at once. This will lower startup load
for both these processes.
** Script result changes **
User parameters, global scripts, system.run[] items and external
checks now return standard error along with standard output. Previously
only standard output was returned (standard error was discarded).
Note: Windows agents have this functionality since 1.8.5
Empty result is now allowed for system.run[] items configured with
textual value type (character, log or text).
** Log level change at runtime **
Two additional runtime control options have been added on all Zabbix services - log_level_increase and log_level_decrease. Now, it is possible to change the log level of all or certain process(-es) without restarting a service. These two runtime control options accept parameters for target process selection. A target process can be selected by specifying PID or process type and process number.
Item changes/improvements
zabbix[host,,maintenance] is a new internal item that returns the current maintenance status of a host. It is always processed by the server regardless of host location (on server or proxy).
The existing zabbix[proxy,<proxyname>,"lastaccess"] internal item is now always processed by the server, which means that the item will work correctly in cases when a host is monitored by proxy.
vfs.dev.read and vfs.dev.write agent items are now supported on AIX.
system.swap.size agent items on Windows now support a percentage free parameter (system.swap.size[,pfree]). The way swap sizes are calculated has changed due to issues discovered in Windows APIs reporting of these metrics. Swap size is now calculated from the total memory space available (physical and virtual memory combined). Although these results are more accurate than they were before, they still may return inaccurate data depending on various circumstances and setups. Commentary on the issues has been added to src/libs/zbxsysinfo/win32/swap.c
API improvements
** Dropped support of output "refer" **
Support of the "refer" value for get method "output" parameter has been removed. Instead it's recommended to use arrays of specific properties.