
7 Graphs
Overview
In the Monitoring → Graphs section any custom graph that has been configured can be displayed.
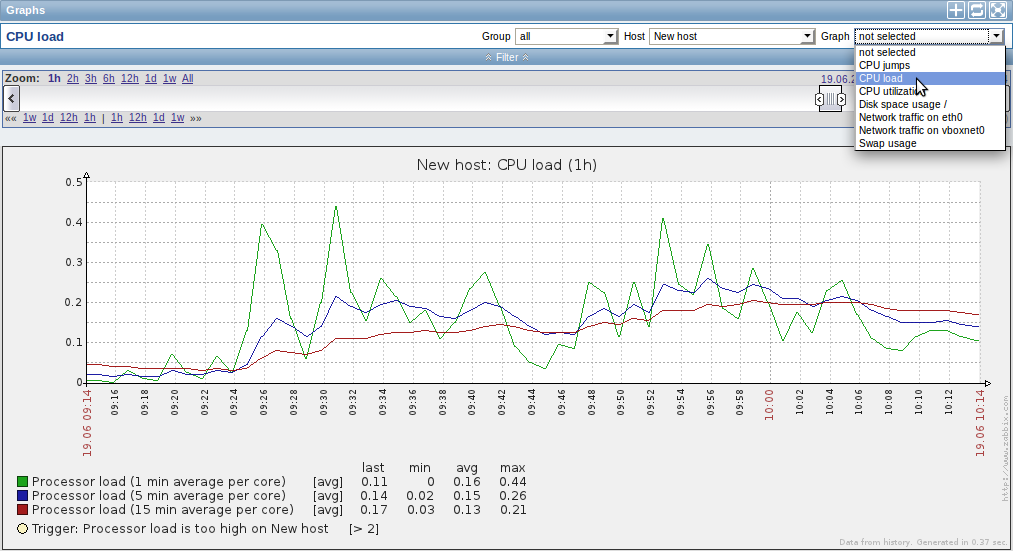
To display a graph, select the host group, host and then the graph from the dropdowns to the right.
Note: In the host dropdown, a disabled host is highlighted in red. Graphs for disabled hosts are accessible starting with Zabbix 2.2.0.
Time period selector
The filter section above the graph contains a time period selector. It allows you to select the desired time period easily.
The slider within the selector can be dragged back and forth, as well as resized, effectively changing the time period displayed. Links on the left hand side allow to choose some often-used predefined periods (above the slider area) and move them back and forth in time (below the slider area). The dates on the right hand side actually work as links, popping up a calendar and allowing to set a specific start/end time.
The fixed/dynamic link in the lower right hand corner has the following effects:
- controls whether the time period is kept constant when you change the start/end time in the calendar popup.
- when fixed, time moving controls (<< 6m 1m 7d 1d 12h 1h | 1h 12h 1d 7d 1m 6m >>) will move the slider, while not changing its size, whereas when dynamic, the control used will enlarge the slider in the respective direction.
- when fixed, pressing the larger < and > buttons will move the slider, while not changing its size, whereas when dynamic, < and > will enlarge the slider in the respective direction. The slider will move by the amount of its size, so, for example, if it is one month, it will move by a month; whereas the slider will enlarge by 1 day.
Another way of controlling the displayed time is to highlight an area in the graph with the left mouse button. The graph will zoom into the highlighted area once you release the left mouse button.
Controls
Three control buttons are available in the title bar:
 -
add graph to the favourites widget in the Dashboard
-
add graph to the favourites widget in the Dashboard -
reset graph display to the original setting of displaying the last
hour data
-
reset graph display to the original setting of displaying the last
hour data -
use the full browser window to display the graph
-
use the full browser window to display the graph