
On this page
2 Proxies
Overview
In the Administration → Proxies section proxies for distributed monitoring can be configured in the Zabbix frontend.
Proxies
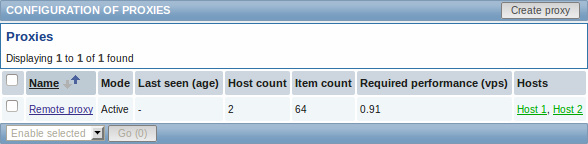
A listing of existing proxies with their details is displayed.
Displayed data:
| Column | Description |
|---|---|
| Name | Name of the proxy. Clicking on the proxy name opens the proxy configuration form. |
| Mode | Proxy mode is displayed - Active or Passive. |
| Last seen (age) | The time when the proxy was last seen by the server is displayed. |
| Host count | The number of hosts monitored by the proxy is displayed. |
| Item count | The number of items monitored by the proxy is displayed. |
| Required performance (vps) | Required proxy performance is displayed (the number of values that need to be collected per second). |
| Hosts | All hosts monitored by the proxy are listed. Clicking on the host name opens the host configuration form. |
To configure a new proxy, click on the Create proxy button in the top right-hand corner.
Mass editing options
A dropdown below the list offers some mass-editing options:
- Enable selected - change the status of hosts monitored by the proxy to Monitored
- Disable selected - change the status of hosts monitored by the proxy to Not monitored
- Delete selected - delete the proxies
To use these options, mark the check-boxes before the respective proxies, then select the required option and click on "Go".