
8 Queue
Overview
In the Administration → Queue section items that are waiting to be updated are displayed.
Ideally, when you open this section it should all be "green" meaning no items in the queue. If all items are updated without delay, there are none waiting. However, due to lacking server performance, connection problems or problems with agents, some items may get delayed and the information is displayed in this section. For more details, see the Queue section.
Queue is available only if Zabbix server is running.
From the dropdown in the upper right corner you can select:
- queue overview by item type
- queue overview by proxy
- list of delayed items
Overview by item type
In this screen it is easy to locate if the problem is related to one or several item types.
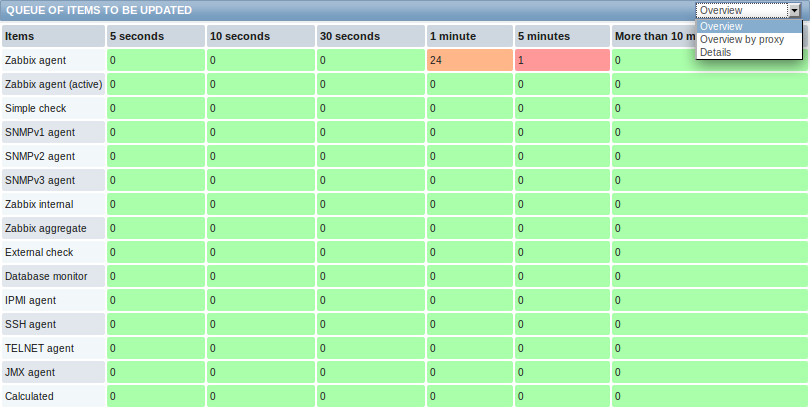
Each line contains an item type. Each column shows the number of waiting items - waiting for 5-10 seconds/10-30 seconds/30-60 seconds/1-5 minutes/5-10 minutes or over 10 minutes respectively.
Overview by proxy
In this screen it is easy to locate if the problem is related to one of the proxies or the server.
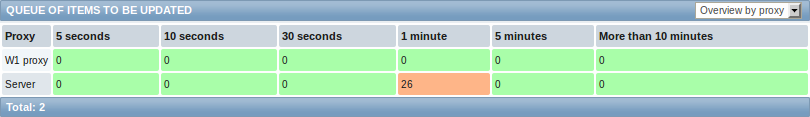
Each line contains a proxy, with the server last in the list. Each column shows the number of waiting items - waiting for 5-10 seconds/10-30 seconds/30-60 seconds/1-5 minutes/5-10 minutes or over 10 minutes respectively.
List of waiting items
In this screen, each waiting item is listed.
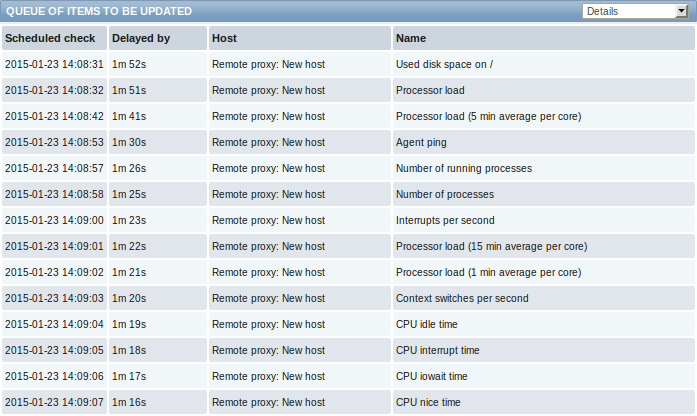
In the host column, hosts monitored by proxy are prefixed with the proxy name (since Zabbix 2.4.0).
Displayed data:
| Column | Description |
|---|---|
| Next check | The time when the check was due is displayed. |
| Delayed by | The length of the delay is displayed. |
| Host | Host of the item is displayed. |
| Name | Name of the waiting item is displayed. |