
4 概览
概览
在监视→概览部分可能显示以下任一内容:
- 触发器概述 - 触发器状态的概述
- 数据概述 - 一次比较多种主机数据
可用的附加显示选项:
- 在主机位置下拉菜单中选择主机名在表格顶端或表格左侧显示
请注意,显示记录固定限制为50条。没有分页。如果存在很多记录,表格底部会显示一条消息,要求提供更具体的过滤条件。
触发器概述
在下一个屏幕截图中,选择触发器概述。结果是,本地主机的触发状态以彩色块显示(问题触发器的颜色取决于问题严重性颜色,可以在 问题更新 屏幕中调整):
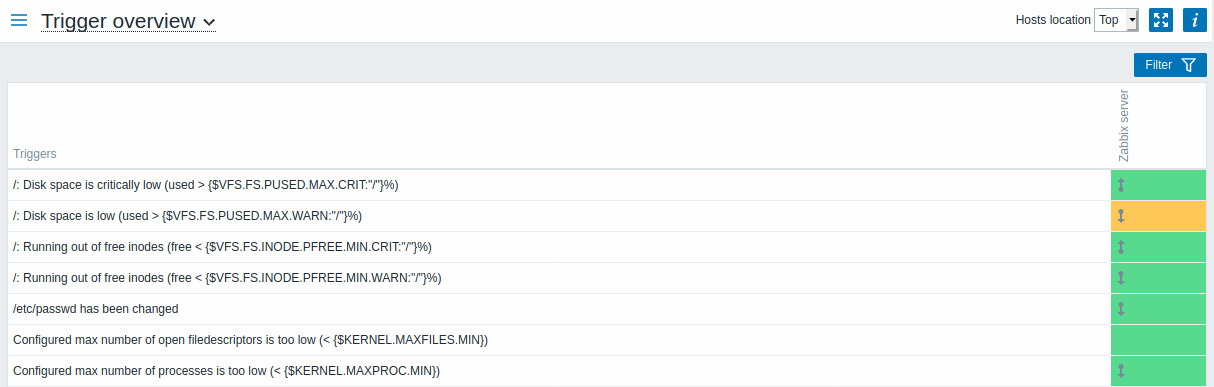
请注意,最近变化的触发器(最近2分钟内)会显示为闪烁的块。
蓝色的向上和向下箭头指示具有依赖性的触发器。 鼠标悬停时,将显示依赖项详细信息。
复选框图标表示已确认的问题。所有问题或已解决的问题的触发器必须确认,才能显示此图标。
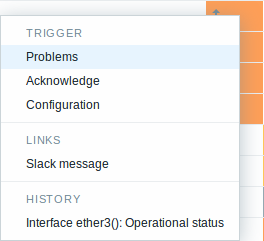
单击触发器块会提供与触发器的问题事件,问题确认屏幕,触发器配置,触发器URL或简单图表/最新值列表相关的具体情况链接。
按钮
右侧的按钮有以下选项:
 |
如果将鼠标悬停在此按钮上,则会显示显示页面内容的其他信息。 |
在文档检测中介绍了通用的显示模式按钮。
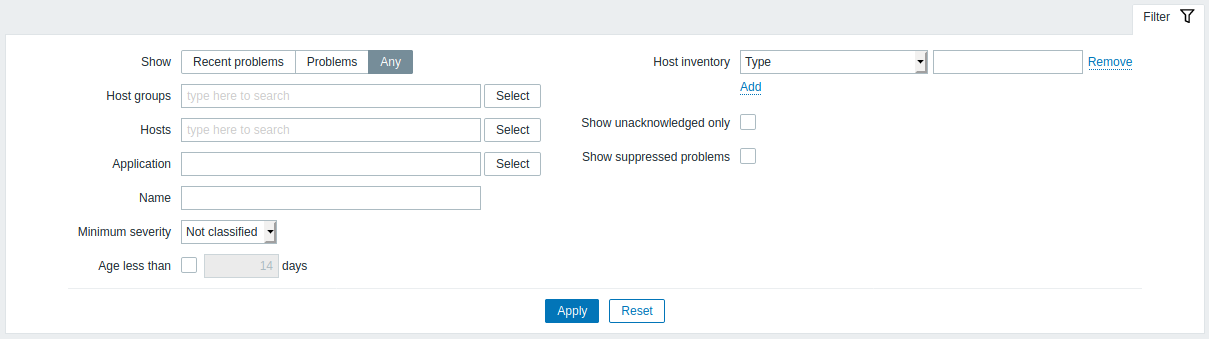
使用筛选器
您可以使用筛选器仅显示您感兴趣的问题。筛选器位于表格上方。
| 参数 描 | |
|---|---|
| 查看 按 | 题状态过滤: 最近的问题 - 显示未解决和最近解决的问题(默认) 问题 - 显示未解决的问题 任何 - 显示所有事件的历史记录 |
| 主机组 按主 | 组过滤。 |
| 主机 按 | 机过滤。 |
| 应用集 按应 | 集过滤。 |
| 名称 按 | 题名称过滤。 |
| 最低严重性 按最低问 | 严重性过滤。 |
| 持续时间小于 勾选复选框 | 问题持续时间过滤。 |
| 主机资产 按资产 | 型和值过滤。 |
| 仅显示未确认 勾选该复选 | 则仅显示未确认的问题。 |
| 显示处理的问题 选中该复选框 | 展示由于主机在维护期而被抑制(未显示)的问题。 |
数据概述
在下一个屏幕截图中,选择数据概述。结果是,显示本地主机的监控项数据。

问题项的颜色基于问题严重性颜色,可以在 问题更新 中调整.
默认情况下仅显示最近24小时内的数据。这样设置是为了优化页面加载数据的时间。 可以通过更改include/defines.inc.php 中ZBX_HISTORY_PERIOD常量的值来更改此限制。
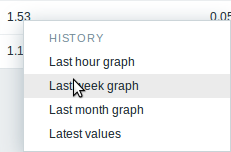
单击一条数据会出现指向某些预定义图形或最新值的链接。
使用筛选器
您可以使用筛选器仅显示您感兴趣的问题。筛选器位于表格上方。

| 参数 描 | |
|---|---|
| 主机组 按主 | 组过滤。 |
| 主机 按 | 机过滤。 |
| 应用集 按应 | 集过滤。 |
| 显示处理的问题 选中该复选框 | 展示由于主机在维护期而被抑制(未显示)的问题。 |
Overview of triggers
In the next screenshot Trigger overview is selected. As a result, the trigger states of a local host are displayed as colored blocks (the color of problem triggers depends on the problem severity color, which can be adjusted in the problem update screen):

Note that recent trigger changes (within the last 2 minutes) will be displayed as blinking blocks.
Blue up and down arrows indicate triggers that have dependencies. On mouseover, dependency details are revealed.
A checkbox icon indicates acknowledged problems. All problems or resolved problems of the trigger must be acknowledged for this icon to be displayed.
Clicking on a trigger block provides context-dependent links to problem events of the trigger, the problem acknowledgment screen, trigger configuration, trigger URL or a simple graph/latest values list.

Buttons
Button to the right offers the following option:
 |
Additional information on the page content is displayed if you roll the mouse over this button. |
View mode buttons being common for all sections are described on the Monitoring page.
Using filter
You can use the filter to display only the problems you are interested in. For better search performance, data is searched with macros unresolved.
The filter is located above the table.
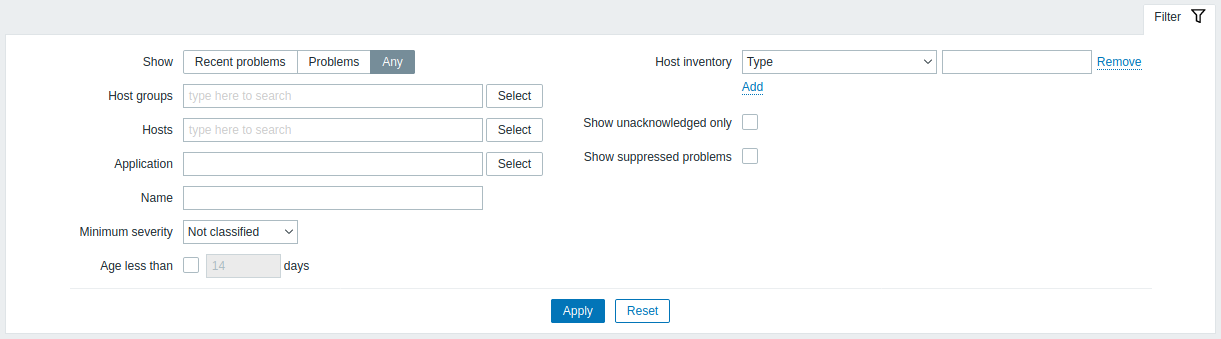
| Parameter | Description |
|---|---|
| Show | Filter by problem status: Recent problems - unresolved and recently resolved problems are displayed (default) Problems - unresolved problems are displayed Any - history of all events is displayed |
| Host groups | Filter by host group. |
| Hosts | Filter by host. |
| Application | Filter by application. |
| Name | Filter by problem name. |
| Minimum severity | Filter by minimum problem severity. |
| Age (less than) | Mark the checkbox to filter by problem age. |
| Host inventory | Filter by inventory type and value. |
| Show unacknowledged only | Mark the checkbox to only display problems which are unacknowledged. |
| Show suppressed problems | Mark the checkbox to display problems which would otherwise be suppressed (not shown) because of host maintenance. |
Overview of data
In the next screenshot Data overview is selected. As a result, item data of a local host is displayed.
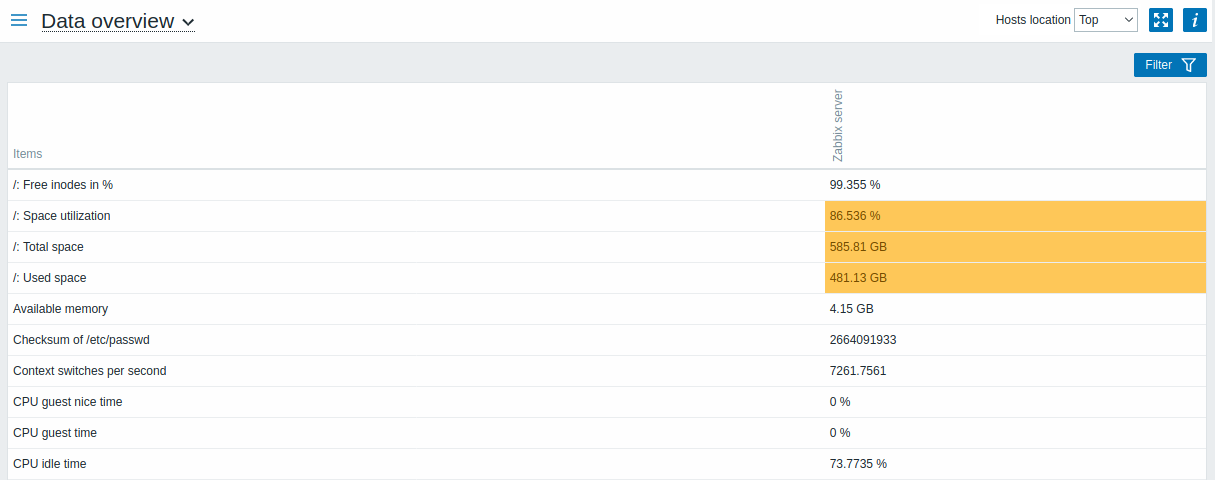
The color of problem items is based on the problem severity color, which can be adjusted in the problem update screen.
Only values that fall within the last 24 hours are displayed by default. This limit has been introduced with the aim of improving initial loading times for large pages of latest data. It is also possible to change this limitation by changing the value of ZBX_HISTORY_PERIOD constant in include/defines.inc.php.
Clicking on a piece of data offers links to some predefined graphs or latest values.

Using filter
You can use the filter to display only the data you are interested in. For better search performance, data is searched with macros unresolved.
The filter is located above the table.

| Parameter | Description |
|---|---|
| Host groups | Filter by host group. |
| Hosts | Filter by host. |
| Application | Filter by application. |
| Show suppressed problems | Mark the checkbox to display problems which would otherwise be suppressed (not shown) because of host maintenance. |