
- 5 What's new in Zabbix 4.0.0
- Improved dashboards
- Retrieve metrics immediately
- New HTTP item type
- New templates
- Item prototypes can depend on regular items
- Low-level discovery macros in item preprocessing
- Substring extraction of low-level discovery macro value
- Host maintenance on trigger level
- Single sign-on using webserver
- More flexible active agent auto-registration
- MySQL 8.0 supported
- Date-based indices setup for Elasticsearch
- More secure connections for proxies
- Problem severity can be changed
- Working with problems
- New graph widget
- Time selector redesign
- Kiosk mode for frontend pages
- Compact view of problems
- Monitoring → Triggers removed
- Inventory macro support in event tags
- Preventing unit conversion flexibly
- Multiple emails in one user media
- Real-time export of events, values, trends
- Tag-based permissions
- Compression for server-proxy communication
- Improved database down messages
- Use of "not" keyword
- Items
- Triggers
- Frontend
- Mandatory fields marked
- Keyboard navigation
- Date picker redesign
- Color picker redesign
- Popup windows replaced by overlay dialogs
- Filtering
- Trigger value shown in trigger configuration list
- Renamed operators
- Renamed widgets, screen elements and reports
- Multiple item support in plain text widget
- Event status color adjustment
- Changes in "Host mass update" form
- Changes in "User media" form
- Twin boxes replaced with auto-select
- Improved widget configuration
- Graph visual improvements in a widget
- Frontend top bar menu improvements
- Accessibility
- Configurable session cookie name
- Host column always displayed
- Miscellaneous
- Macros
- Daemons
- Performance
- Logging
- API improvements
- See also
5 What's new in Zabbix 4.0.0
Improved dashboards
Dashboards have seen further improvements in the new version to make them more appealing visually, more versatile and flexible to the user needs.
To achieve the new look and functionality, the following developments have been made:
- A new more versatile SVG-based graph widget has been added, while the classic design graph widget is also still available
- Widgets no longer contain a footer displaying widget details (e.g.
the Updated: hh:mm:ss message about the time they were updated),
achieving a much cleaner look of the dashboards. Note that:
- In the Problems widget the message "N of M problems are shown" will still be displayed if there are more problems than can be displayed according to the Show lines setting
- Digital clock will no longer be displayed in the Clock widget footer
- In the new Kiosk mode, widgets only can be displayed with no headers at all
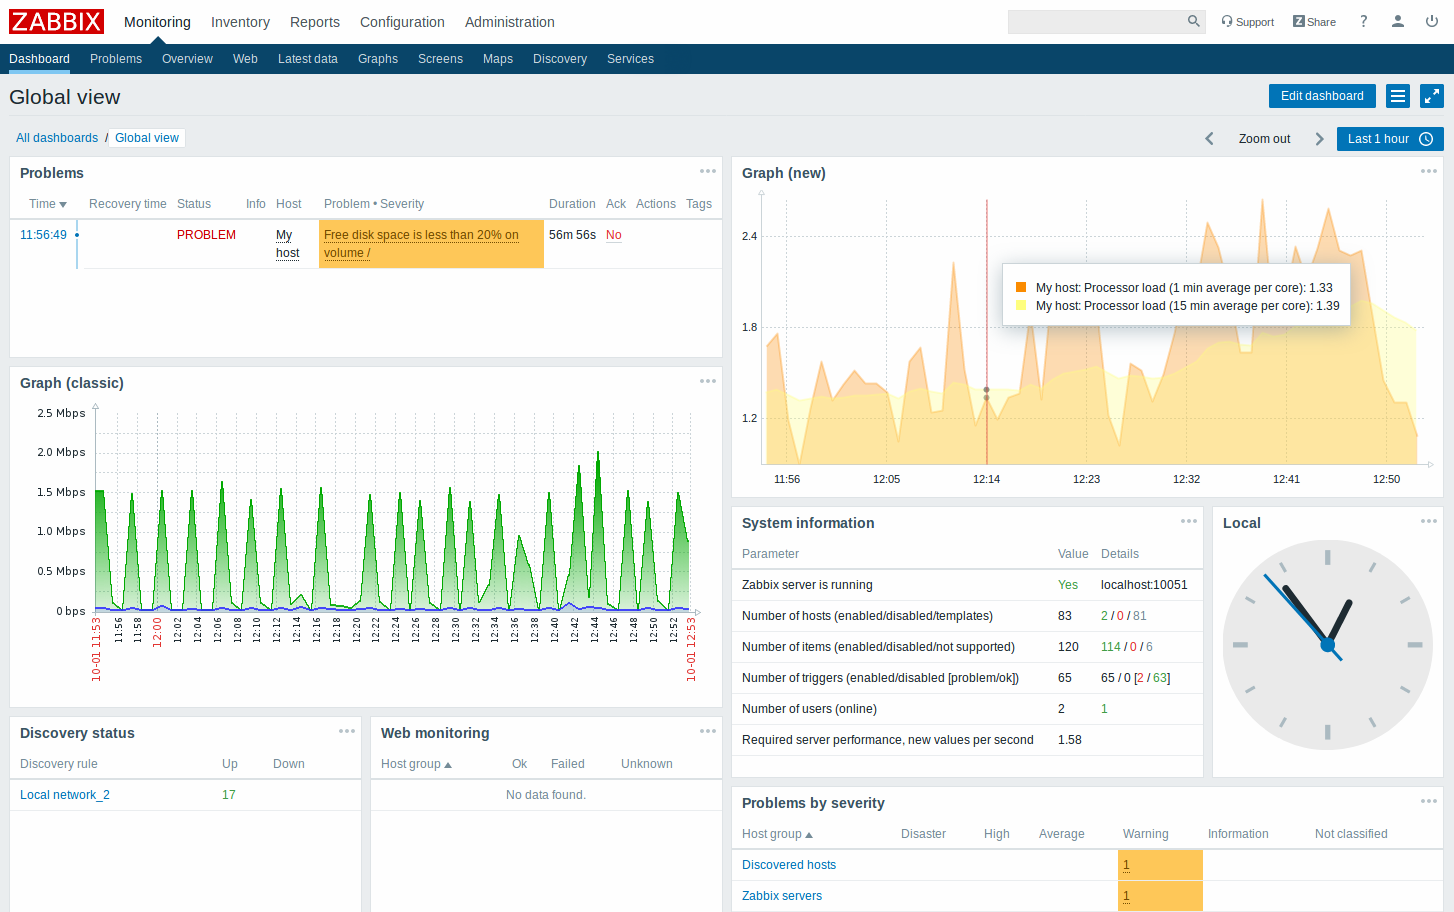
- A new Global view dashboard is now shipped with the default Zabbix dataset, replacing the main Dashboard of the previous version
- Another default dashboard has been added that focuses on displaying Zabbix server performance: Zabbix server health:
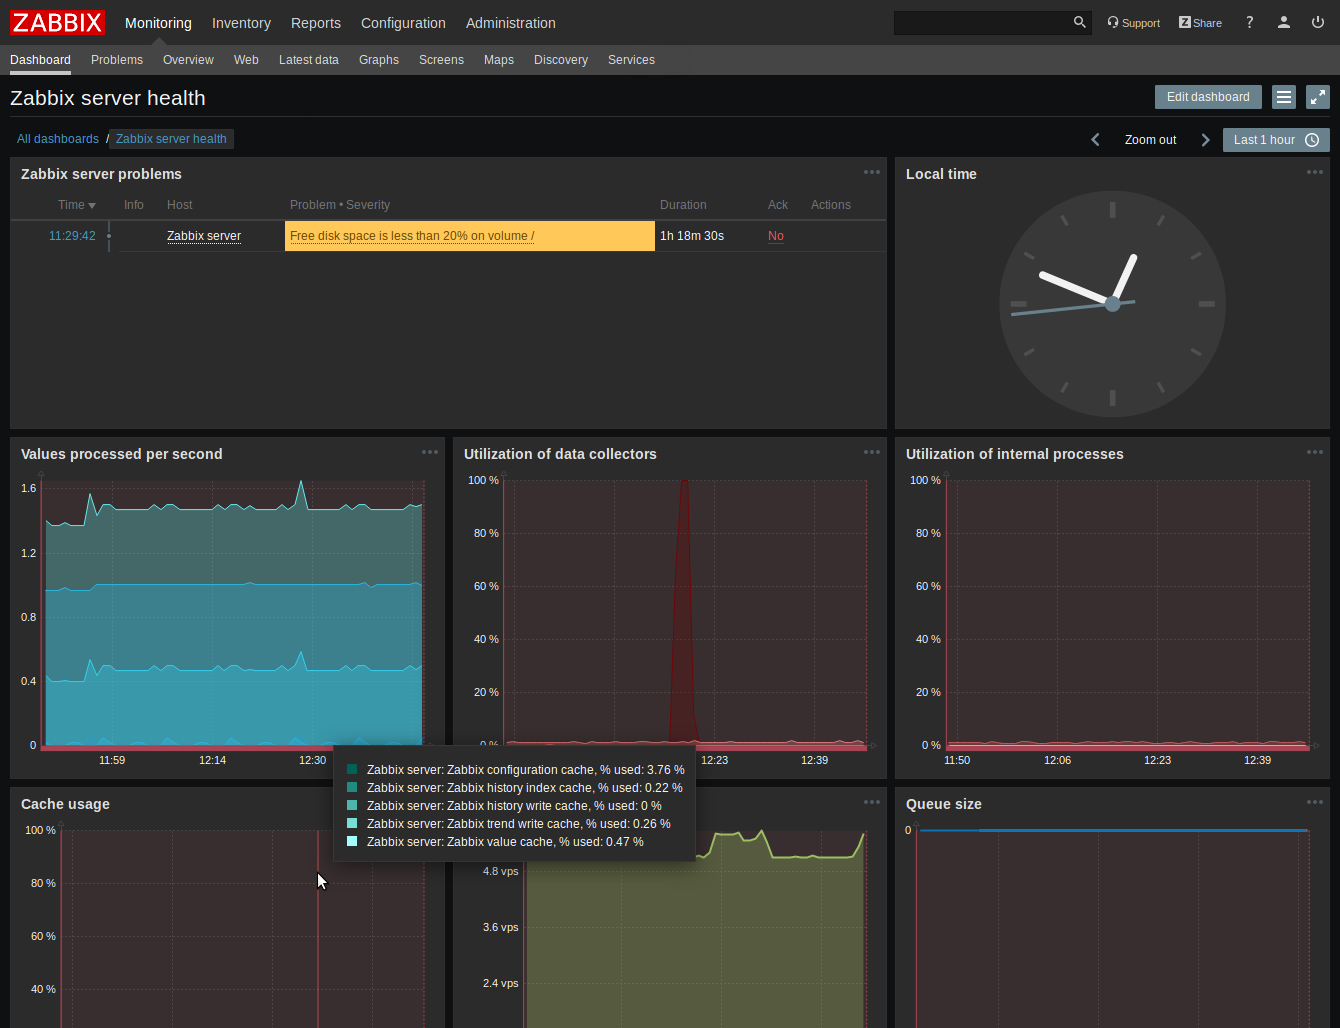
This dashboard is shared with the Zabbix administrators group only, by default.
Retrieve metrics immediately
Retrieving a new value for an item (metric) in Zabbix has always been cyclic and based on configured update intervals. While for many items the update intervals are quite short, there are others (including low-level discovery rules) for which the update intervals are quite long, so in real life situations there may be a need to retrieve a new value quicker - to pick up changes in discoverable resources, for example.
This is now made possible in the new Zabbix version by means of a Check now button that is available in two locations:
 |
Configuration form of an existing item or discovery rule. |
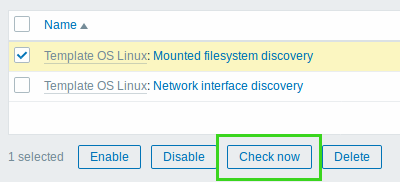 |
List of items or discovery rules: select the required entities and click on Check now. |
When checking for a new value, the configuration cache is not updated, thus the values will not reflect very recent changes to item/discovery rule configuration. Therefore, it is also not possible to check for a new value for an item/rule that has been created just now.
For more details, see: Check now
New HTTP item type
A new HTTP item type has been introduced allowing data polling using the HTTP/HTTPS protocol. Trapping is also possible using Zabbix sender or Zabbix sender protocol.
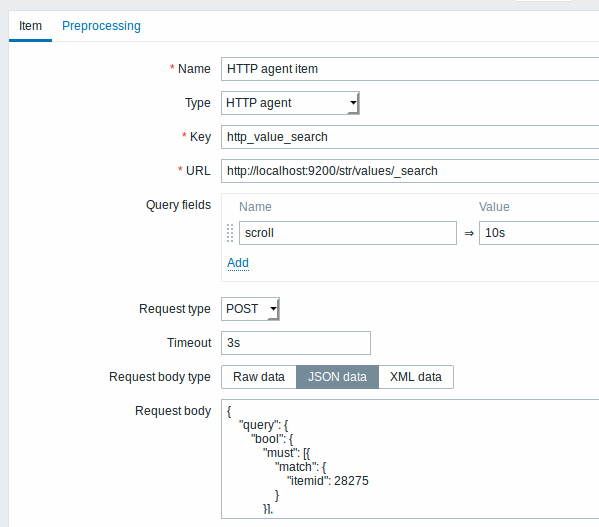
For more details see HTTP agent item type.
New templates
New templates are available for monitoring some IBM, Dell, HP, Cisco UCS and Supermicro Aten hardware:
- Template Server IBM IMM SNMPv1/2
- Template Server Dell iDRAC SNMPv2
- Template Server HP iLO SNMPv2
- Template Server Supermicro Aten SNMPv2
- Template Server Cisco UCS SNMPv2
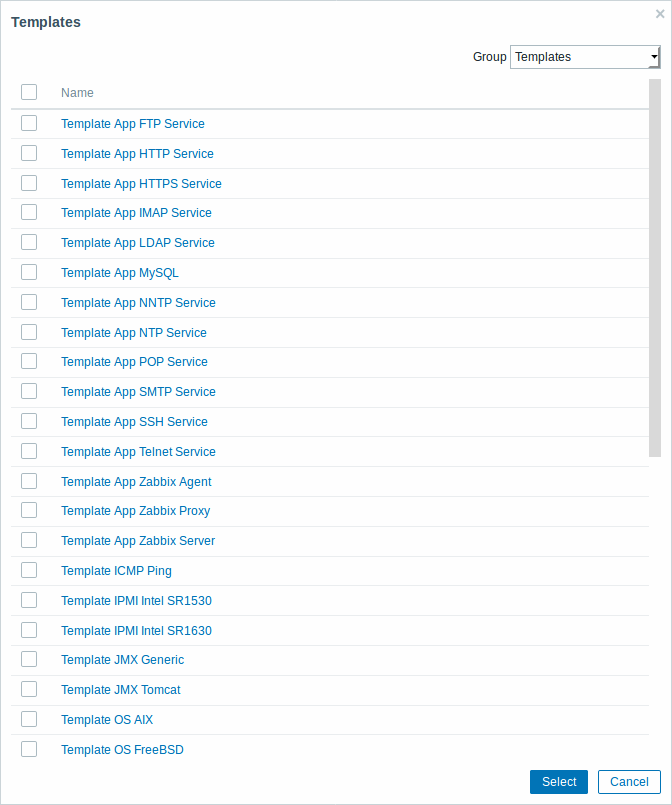
These templates are part of the default Zabbix dataset for new installations. If you are upgrading from previous versions, you can download the latest templates from the Zabbix Git repository. Then, while in Configuration → Templates you can import them manually into Zabbix. If templates with the same names already exist, the Delete missing options should be checked when importing to achieve a clean import. This way the old items that are no longer in the updated template will be removed (note that it will mean losing history of these old items).
Item prototypes can depend on regular items
Zabbix 3.4 introduced dependent items (and dependent item prototypes) that can extract data from the bulk metrics gathered by a master item. Previously, however, item prototypes could only depend on another item prototype from the same low-level discovery rule. This limitation has now been lifted. An item prototype can depend on either another prototype or a regular item from the same host.
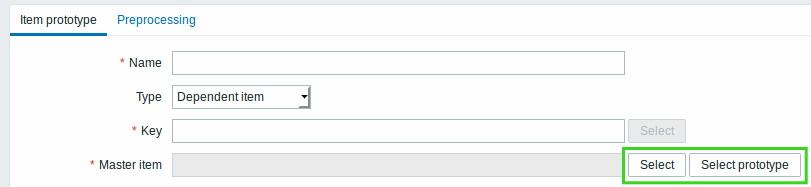
When selecting the master item for the prototype there are now two buttons in the frontend - one for selecting a regular master item and another for selecting a prototype master item.
Low-level discovery macros in item preprocessing
Low-level discovery macros now can be used in item preprocessing steps for item prototypes.
User macros and user macros with context can be used in item preprocessing steps for regular items and item prototypes.
Substring extraction of low-level discovery macro value
Macro functions are now supported with low-level discovery macros, allowing to extract a certain part of the macro value using a regular expression.
For example, you may want to extract the customer name and interface number from the following LLD macro for the purposes of event tagging:
{#IFALIAS}=customername_1To do so, the regsub macro function can be used with the macro in the
event tag value field of a trigger prototype:
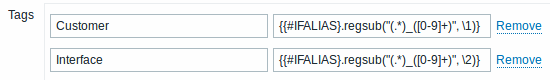
For more information on macro function syntax, see: Macro functions.
Macro functions are supported in all locations where low-level discovery macros can be used, except for low-level discovery rule filter.
Host maintenance on trigger level
Host maintenance now can be limited to the triggers/services with the corresponding tags:
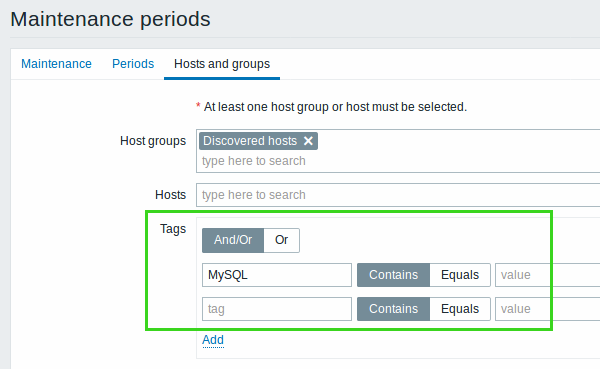
Required tags can be specified when configuring maintenance periods. If specified, host maintenance will be activated and notifications will be suppressed only for triggers/problems with the corresponding tags, while for all other triggers of the specified hosts problem reporting in the frontend and problem notifications will remain active.
Related changes
With host maintenance flexibility extended to trigger/service level, some maintenance-related options have been renamed or added:
| New naming | Old naming | Affected location | Function |
|---|---|---|---|
| Show suppressed problems | Show hosts in maintenance | Filter option in Monitoring → Problems | Display problems which would otherwise be suppressed (not shown) because of host maintenance. |
| Filter option in Monitoring → Overview ('Triggers' as Type) | |||
| Configuration option in dashboard widgets: Problem hosts Problems Problems by severity |
|||
| Show suppressed problems | - | New filter option in Monitoring → Overview ('Data' as Type) | |
| New option in map configuration | |||
| New option in global notifications | |||
| New configuration option in dashboard widgets: Data overview Trigger overview |
|||
| Pause operations for suppressed problems | Pause operations while in maintenance | Configuration option in action operations | Delay execution of operations until host maintenance ends. |
| Problem is suppressed | Maintenance status | Action condition | Yes - execute action if problem is suppressed No - do not execute action if problem is suppressed |
Single sign-on using webserver
Single sign-on to the frontend using solutions like Kerberos, NTLM and others has been made possible by adding new HTTP authentication options.
HTTP authentication has now gained a dedicated tab in the Authentication form in which you may define whether to send non-authenticated users to the Zabbix login page or to the HTTP login page, specify case-sensitive/case-insensitive login and remove the domain name from the sent user credentials.
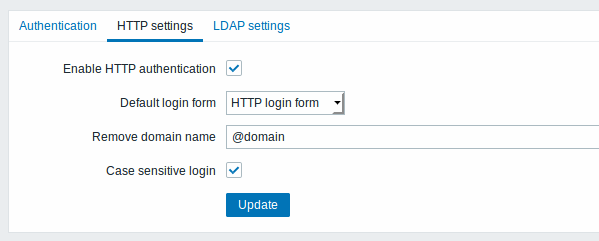
Case-sensitive/case-insensitive login option has also been added to LDAP authentication details.
See also: Authentication
In a related development, an LDAP frontend access option has been added for user group configuration.
More flexible active agent auto-registration
Previously auto-registration was run only once, which did not offer much flexibility for cases when something on the host is changed. In the new version, auto-registration is rerun if host metadata (HostMetadata, HostMetadataItem parameters in agent configuration) is changed.
This allows to adapt monitoring based on the nature of changes on the host. To make such a more flexible approach work, auto-registration actions now support additional operations:
- remove host
- enable host
- remove from host group
- unlink from template
MySQL 8.0 supported
Support for MySQL 8.0 has been added.
Date-based indices setup for Elasticsearch
In order to properly scale history data in Elasticsearch, multiple indices per data type are required. It is now possible to set up such date-based indices. For more details, see Elasticsearch setup.
More secure connections for proxies
It is now possible to configure connections for both active and passive proxies in a more secure way:
- The allowed address range for an active proxy can be limited. When configuring an active proxy in the frontend, there is a new field called Proxy address. If specified then active proxy requests will only be accepted from this list of IP addresses/DNS names of the active proxy.
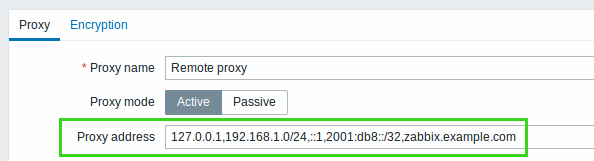
- The Server parameter in passive proxy configuration, which previously was ignored, is now mandatory. The passive proxy will reject an address that is not listed in the Server parameter.
Problem severity can be changed
Problem severity previously always depended on the severity of the underlying trigger and could not be changed. Now problem severity in the event table is a separate field and can be updated. Even though the original value is based on the trigger severity, it can be updated using the problem update screen.
Working with problems
Problem update screen
The problem update screen is a reworked version of the acknowledgment screen of the previous Zabbix versions.
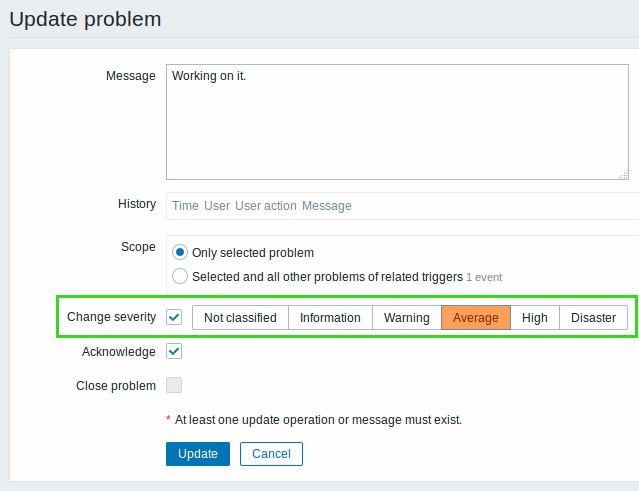
Beside renaming, the following changes have been made:
- Problem severity can now be changed on the event level
- Each problem update action can be done separately:
- You may leave a comment on the problem without acknowledging
- You may acknowledge a problem without commenting
- You may manually close a problem without acknowledging, commenting, etc.
- You may define the scope for each of the actions that follow: Change severity, Acknowledge, Close problem.
- The history list contains more symbolic information on the activities so far
Other changes
- The problem severity displayed is now event-level severity and will change if updated in the following locations:
- The content of what is displayed in the Actions column of Monitoring → Problems has been expanded. Previously it only had textual information about the course of actions. Now all information is symbolic (icons) and, besides actions, also displays information on such activities as commenting and changing problem severity. When you roll the mouse over the icons, popups are displayed with more details about each activity.
- Previously in event details there were separate blocks for acknowledgments, message and remote command actions. Now all activities on the problem are displayed in one block and symbolic icons are used for each stage of the problem life cycle, including entries for problem generation and resolution times.
- Acknowledgment operations in actions have been renamed to Update operations
- Event acknowledgment is now always enabled (the on/off checkbox in Administration → General (GUI option in dropdown) has been removed)
- Macros have been
updated:
- {ACK.DATE} renamed to {EVENT.UPDATE.DATE}
- {ACK.TIME} renamed to {EVENT.UPDATE.TIME}
- {ACK.MESSAGE} renamed to {EVENT.UPDATE.MESSAGE}
- {EVENT.ACK.HISTORY} renamed to {EVENT.UPDATE.HISTORY}
- {EVENT.UPDATE.ACTION} added
- {EVENT.SEVERITY} added
- {EVENT.NSEVERITY} added
- Default messages for operations, recovery operations and update operations have been changed to reflect the updated macros
New graph widget
A new graph widget for the dashboards has been introduced providing a more modern and versatile way of visualizing data collected by Zabbix. The new widget uses vector technique to draw the image and serves as a platform for multiple new visualization features that were not available using the existing image drawing approach.
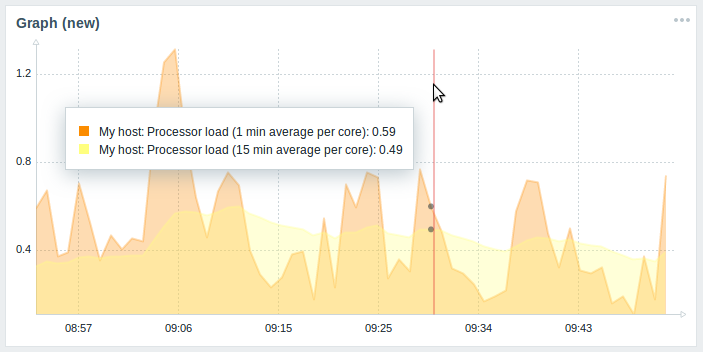
For more information see dashboard widgets.
The graph widget supported before can still be used and is now renamed to Graph (classic).
Time selector redesign
The time period selector has been redesigned with the aim of providing users a one-click opportunity to select often required periods.
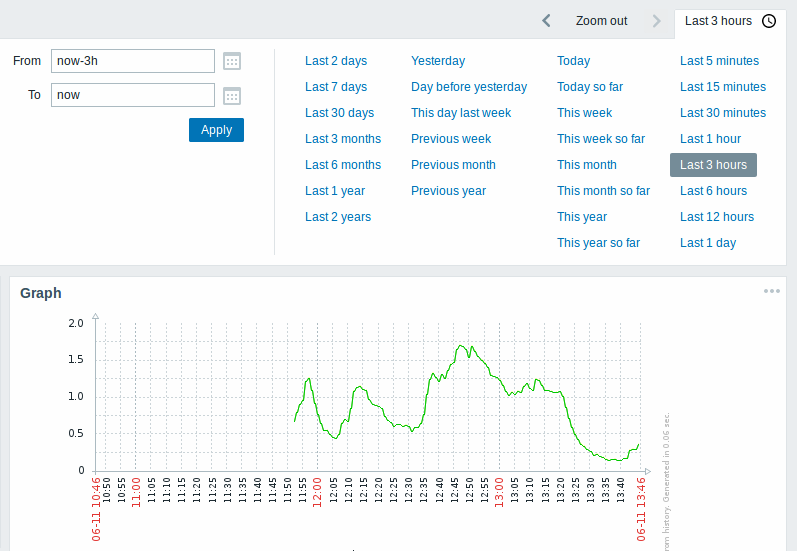
It is also possible to zoom out the selected period (increase it two times or by 50% in both directions), to move the period back and forth, and select a more specific date from the date picker.
The following locations benefit from the redesign:
- Monitoring → Dashboard (graph widget)
- Monitoring → Problems (with History selected in the filter)
- Monitoring → Web (in scenario details)
- Monitoring → Latest data (item graph, item history, ad-hoc graph, templated screens)
- Monitoring → Graphs
- Monitoring → Screens
- Monitoring → Screens (slideshows)
- Reports → Availability report
- Reports → Triggers top 100
- Reports → Audit
- Reports → Action log
See also: Time period selector
Kiosk mode for frontend pages
In the new Kiosk mode for frontend pages only the page content is displayed. Thus, for example, in dashboards only the widgets are displayed.
| < | |||
|---|---|---|---|
| < | |||
Kiosk mode is accessible by clicking on the
 button
when already in fullscreen mode. Kiosk mode is supported for all pages
where fullscreen mode is supported.
button
when already in fullscreen mode. Kiosk mode is supported for all pages
where fullscreen mode is supported.
Compact view of problems
A Compact view mode has been added in Monitoring → Problems allowing to maximize the amount of problems that can be seen at the same time:
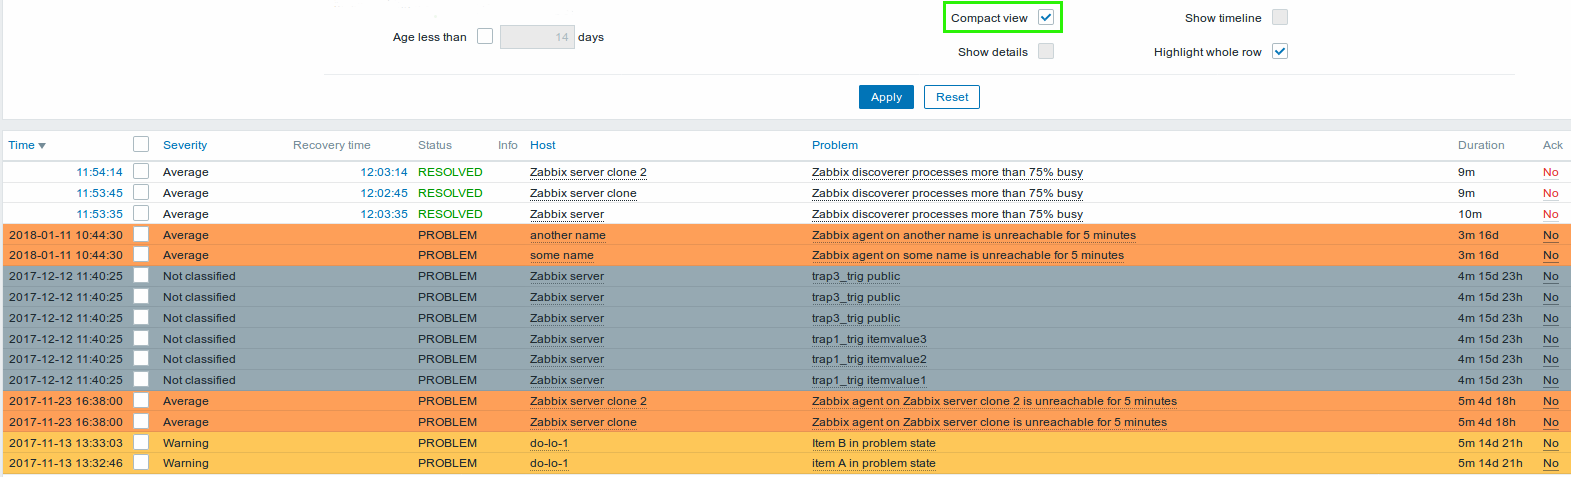
To activate the compact view mode, select the respective option in the filter.
Two more new options are available in the problem filter:
- Highlight whole row allows to highlight the full row of unresolved problems using the problem severity color. This option is available in the standard blue and dark themes; it is not available in the high-contrast themes.
- Show timeline allows to display/hide the visual timeline. This checkbox has also been added to the Problems dashboard widget configuration. Note that this option is not available when Compact view is selected.
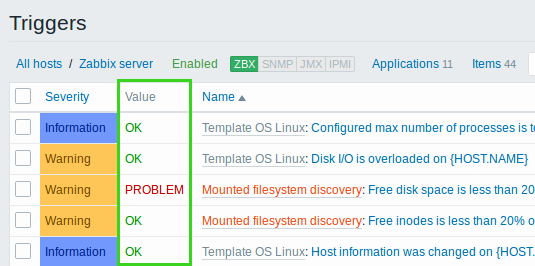
Monitoring → Triggers removed
With Monitoring → Problems becoming the go-to section when needing to see the current problems, it has been decided to remove the Triggers section from the Monitoring menu.
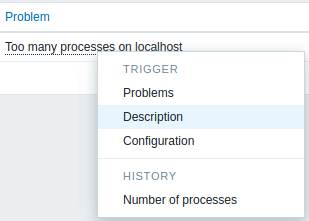
Note that trigger status as such can now be viewed in Configuration → Hosts → Triggers (in the new Value column), while trigger descriptions can be accessed from the Trigger context menu and are opened in a popup window.
Inventory macro support in event tags
{INVENTORY.*} macros are now supported in event tags used for trigger-based event correlation.
Expansion of inventory macros in event tags allows to correlate events (i.e. problems and their resolution), for example, by datacenter location, responsible system administrator, rack number and any other inventory item provided, thus giving administrators even more automation possibilities.
Preventing unit conversion flexibly
Specifying a unit for an item in Zabbix results in a multiplier prefix
being added - for example, an incoming value '2048' with unit 'B' would
be displayed as '2KB'. The unit blacklist for which such conversion was
prevented in previous Zabbix versions was hardcoded and consisted of
ms, rpm, RPM, %.
In the new version, any unit can be prevented from being converted by
using a ! prefix, for example !B. To better illustrate how this
conversion works with and without the blacklisting, see the following
examples of values and units:
1024 !B → 1024 B
1024 B → 1 KB
61 !s → 61 s
61 s → 1m 1s
0 !uptime → 0 uptime
0 uptime → 00:00:00
0 !! → 0 !
0 ! → 0
Even though the previous unit blacklist also still works, it is now
deprecated, so the correct way to prevent conversion for these units is
now !ms, !rpm, !RPM, !%
Multiple emails in one user media
Multiple e-mail addresses can now be specified in one user media entry.
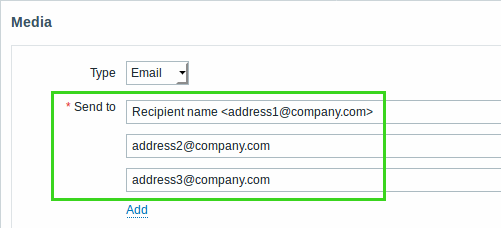
If multiple e-mail addresses are specified this way, one e-mail will be sent to all the specified recipients.
Real-time export of events, values, trends
Real-time export of trigger events, item values and trends in a
newline-delimited JSON format is possible by specifying the new
ExportDir parameter in server
configuration. Another new
parameter - ExportFileSize may be used to determine the maximum size
of an individual export file.
See also: Real-time export of events, values, trends
Tag-based permissions
User groups form has been completed with a new Tag filter tab that allows to set tag-based permissions for user groups to see problems filtered by tag name and its value:
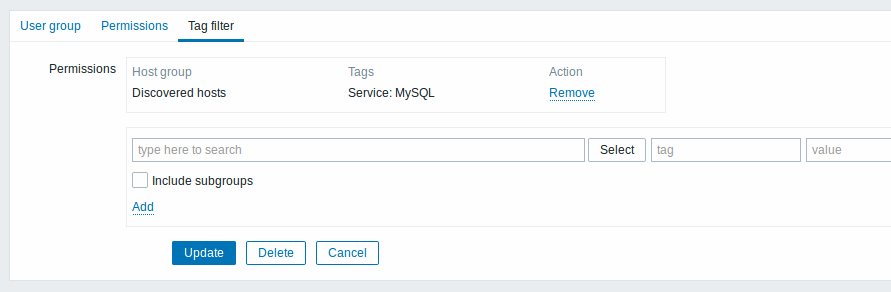
This change applies to the "User groups" form in Administration → User groups.
Compression for server-proxy communication
All communications between Zabbix server and all proxies, and vice versa are now unconditionally compressed. Compression lowers the bandwidth requirements and improves data transfer speed.
The Administration → Proxies form is extended with an additional column named "Compression".
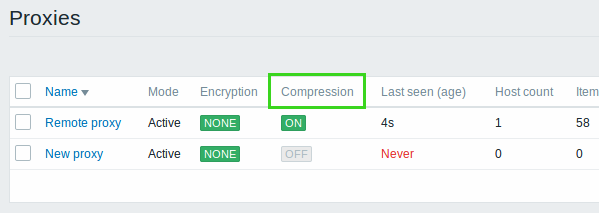
Zlib library is required for compression support.
Improved database down messages
Database down messages have been improved to provide more details about the occurred problem. Database down message from now on consists of the following content:
[MySQL|PostgreSQL|Oracle|IBM DB2] database <DB Name> [on <DB Host>:<DB Port>] is not available: <error message depending on the type of DBMS (database)> <DB Host> is not added to the message if it is defined as an empty value and <DB Port> is not added if it is the default value ("0").
Use of "not" keyword
Use of "not" keyword in Custom expression field and in a Discovery rule filter drop down is now supported.
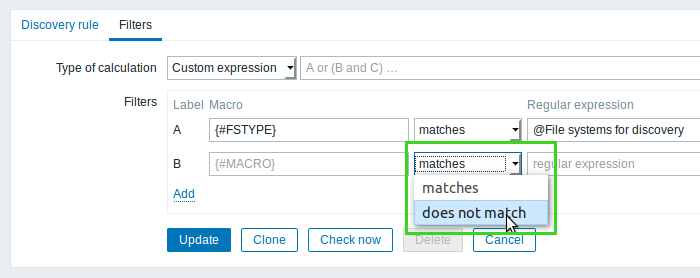
This change applies to the Event correlation rules form in Configuration → Event correlation, Actions form in Configuration → Actions and Discovery rule filter.
Items
New items
- vfs.dir.count agent item has been added to recursively count all entries in the given directory.
Updated items
- vm.memory.size agent item now supports a slab parameter.
- The following agent
items now support new
mode values:
- net.if.total - overruns (fifo) and compressed
- net.if.in - overruns (fifo), frame, compressed and multicast
- net.if.out -// overruns (fifo)//, collisions (colls), carrier and compressed
- For logrt and logrt.count items, a copytruncate log file rotation option has been added.
- The following values are now supported in Boolean to decimal transformation for Item value preprocessing : ok, master, err, slave.
- zabbix[rcache,<cache>,<mode>] and zabbix[wcache,<cache>,<mode>] internal items now support a pused mode, returning the use percentage of the respective buffer.
JMX monitoring
Zabbix Java gateway now supports working with custom MBeans returning non-primitive data types, which override the toString() method.
External script argument wrapping
When running an external
script, the script arguments
are now wrapped in single quotes ' instead of double quotes
". This change allows Zabbix to pass more characters in external
check parameters, for example, the $ sign.
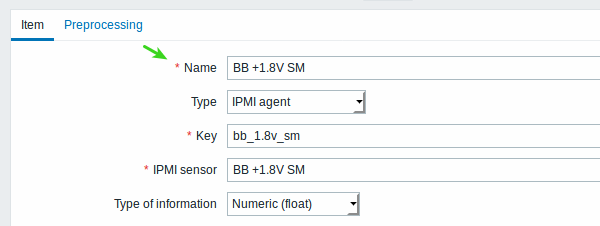
Searching IPMI sensor by full name
In the IPMI sensor field for IPMI
items it is now
also possible to specify a search for the full name, by using a name:
prefix before the value.
Triggers
Time triggers processed by history syncers
The processing of time-based trigger
functions such as nodata(),
date(), dayofmonth(), dayofweek(), time() and now() has been
moved from timer processes to history syncers.
While previously all time-based triggers were recalculated at the same time, creating peak loads every 30 seconds, now the time-based trigger processing is evenly spread within those 30 seconds.
The output of history syncer and timer processes has been updated accordingly.
Now:
zabbix_server: history syncer #3 [processed 0 values, 0 triggers in 0.000005 sec, idle 1 sec]
zabbix_server: timer #1 [updated 0 hosts, suppressed 0 events in 0.000472 sec, idle 59 sec]
Before:
zabbix_server: history syncer #4 [synced 35 items in 0.166198 sec, idle 5 sec]
zabbix_server: timer #1 [processed 3 triggers, 0 events in 0.007867 sec, 0 maint.periods in 0.005677 sec, idle 30 sec]
Miscellaneous
- Regular expressions and global regular expressions are now supported in the parameter values of the logsource trigger function.
Frontend
Mandatory fields marked
Mandatory fields in all Zabbix frontend forms are now marked with a red asterisk.
Keyboard navigation
- All interactive elements (except maps) can now be accessed by pressing the Tab key;
- Popups can now be opened, worked with and closed by keyboard;
- Context menu options can now be navigated by keyboard arrows. Pressing Esc will close the whole context menu, while pressing Enter will activate the selected option.
- Year, month and date can be selected by keyboard in the redesigned date picker.
Date picker redesign
The date picker has been redesigned to allow selecting year, month and date by keyboard.
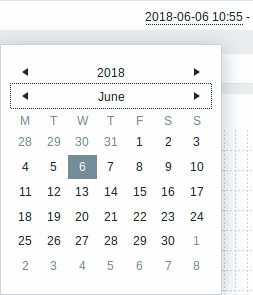
It is possible to navigate between the blocks of year/month/date using Tab and Shift+Tab. Keyboard arrows or arrow buttons allow to select the desired value. Pressing Enter (or clicking on the desired value) activates the choice.
Selecting time has been removed from the date picker as that is part of the redesigned time selector. The Done button is also removed, because the selected date is now activated immediately. The Now button has also been removed.
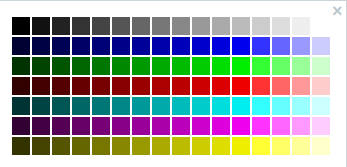
Color picker redesign
The color picker has been redesigned and offers a larger palette of colors to pick from:
 |
In Zabbix 4.0 |
 |
Before Zabbix 4.0 |
Popup windows replaced by overlay dialogs
All popups that were opened in new windows are now opened as overlay dialogs across the frontend.
Additionally, a Cancel button has been added to these windows.
Filtering
More flexible problem filtering by tags
More flexibility has been added to problem filtering by event tag name and value:
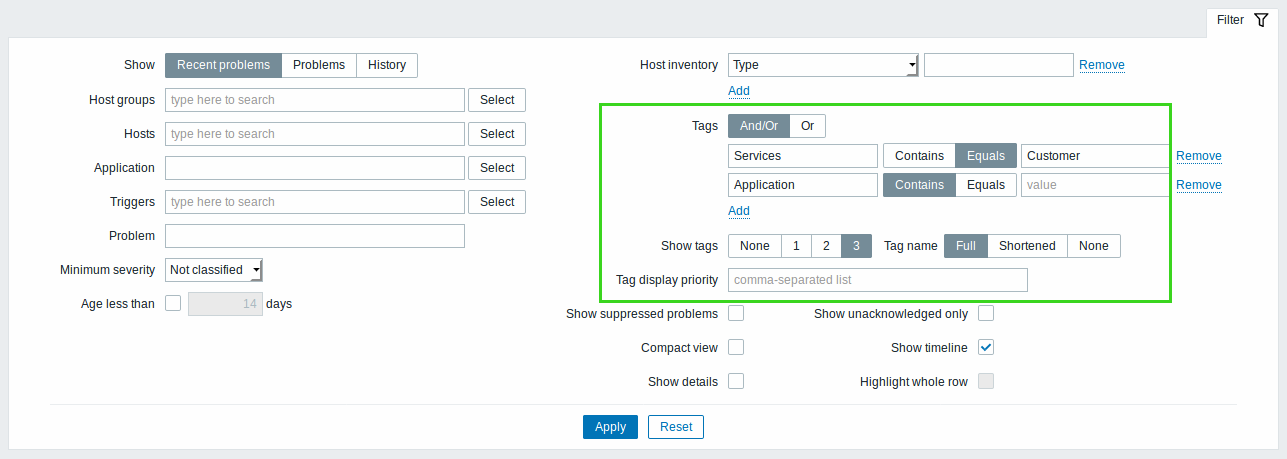
- Calculation types for tag filter conditions have been added - And/Or and Or
- In tag filtering exact (case-sensitive) and similar (case-insensitive) string match is possible
- The number of displayed tags can be selected - from completely hiding the Tags column to the maximum of three tags (in the new Show tags field)
- The mode of displaying tags can be selected - by full name, shortened name or value name only (in the new Tag name field)
- The order in which tags are displayed with the problem can be defined, as a comma-separated list (in the new Tag display priority field)
These changes apply to the filter in Monitoring → Problems and to the Problems dashboard widget.
Similar changes are made to the filter in Configuration → Hosts → Triggers excluding Show tags, Tag name and Tag display priority fields.
Host list
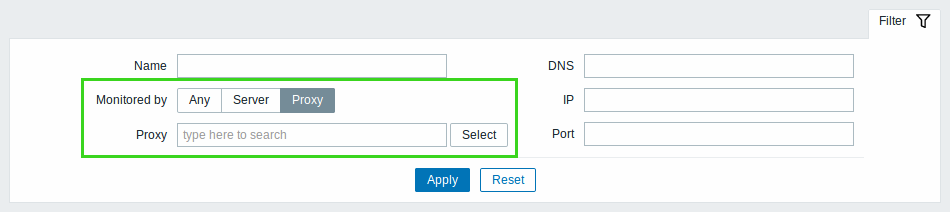
You can now filter hosts depending on whether they are monitored by Zabbix server or Zabbix proxy. If filtering by proxy, it is also possible to specify the proxy or proxies.
By default Any is selected and the auto-complete field Proxy is not visible. When selecting Proxy, a new auto-complete field with Proxy label becomes visible in the filter.
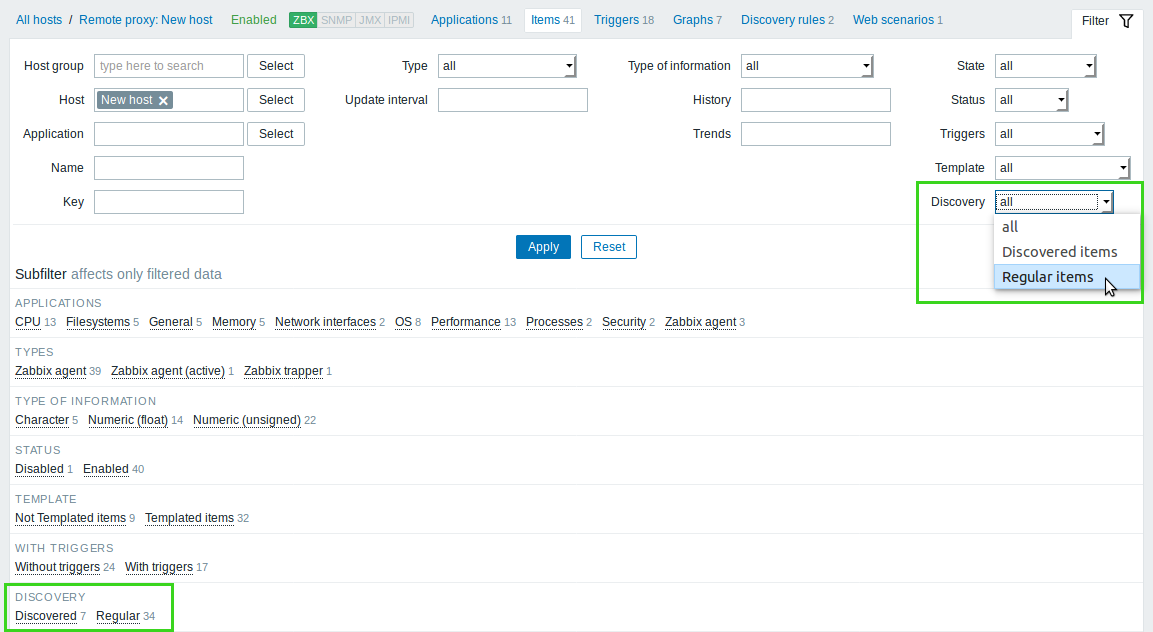
Item list
You can now filter items depending on whether they are:
- Regular items - created manually or from a template
- Discovered items - created by low-level discovery
Trigger value shown in trigger configuration list
Trigger value (OK/Problem) is now displayed in the trigger configuration list, in the new Value column:
Renamed operators
Condition operators have been renamed and unified everywhere in the frontend:
| New | Old |
|---|---|
| Equals | =, Equal, Exactly |
| Does not equal | <> |
| Is greater than or equals | >= |
| Is less than or equals | <= |
| Contains | Like |
| Does not contain | Not like |
Renamed widgets, screen elements and reports
The following elements have been renamed:
| New | Old |
|---|---|
| Problems by severity | System status |
| Problem hosts | Host status |
| System information | Status of Zabbix |
Multiple item support in plain text widget
It is now possible to add multiple items during Plain text widget configuration:
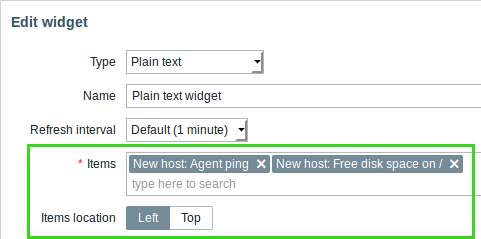
Items location option has also been added to choose the way how information in the widget may be displayed:
| < | |||
|---|---|---|---|
| < | |||
Event status color adjustment
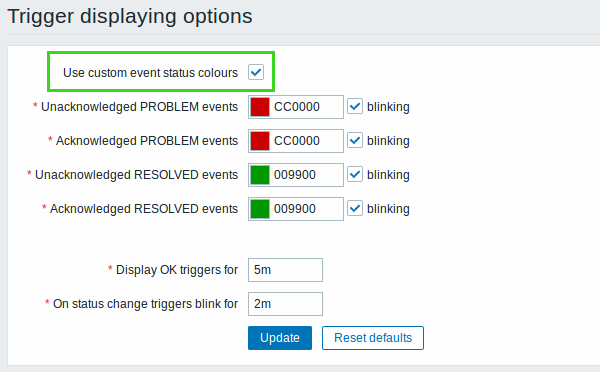
A new Use custom event status colors option has been added in Administration → General → Trigger displaying options. This option allows to turn on the customization of colors for acknowledged/unacknowledged problems.
Changes in "Host mass update" form
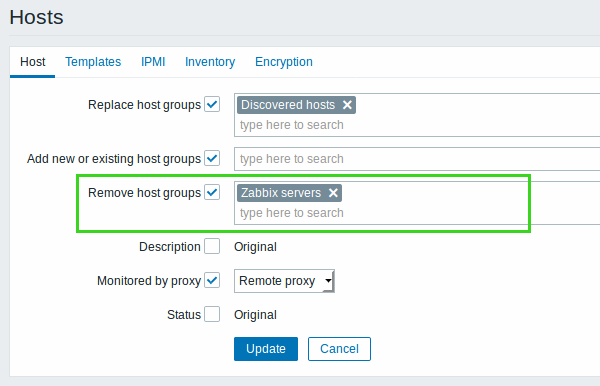
New checkbox Remove host groups and auto-complete field added. From now users are able to remove specific host groups from hosts. In case hosts are already in selected groups, then hosts will be removed from these groups. In case hosts are not in selected groups, nothing will added or removed. In case same host groups are replaced and removed at the same time, hosts are actually left without groups.
Changes in "User media" form

Trigger severity active blocks are now styled in severity colors while inactive blocks have the same color as table background color.
This change applies to the "Media" tab in Administration → Users → User properties form and User profile configuration form.
Twin boxes replaced with auto-select
From now some of the forms are much more user-friendly and compact. Twin box controls are now removed and replaced with auto-select.
This change applies to the following configuration forms:
- Configuration → Hosts → Create/Edit host and Configuration;
- Configuration → Host groups → Create/Edit host group;
- Configuration → Maintenance → Create/Edit maintenance period → Hosts & Groups tab;
- Configuration → Templates → Create/Edit template;
- Administration → User groups → //Create/Edit user group //;
- Administration → Proxies → Create/Edit proxy.
Improved widget configuration
When adding a new widget to a dashboard or editing an existing one, change of widget type opens a form with default values set for all fields depending on the type of newly selected widget.
Graph visual improvements in a widget
Graph display in widgets has been enhanced. A generated graph is now occupying the maximum possible space allowing more information to be displayed.
Frontend top bar menu improvements
A new Support button redirecting to Zabbix official support page is now added to Zabbix frontend top bar menu:

Accessibility
Several improvements have been made to Zabbix frontend in order to make it usable with assistive technologies and generally more friendly for visually-impaired people.
High-contrast themes
Two new high-contrast themes have been added for Zabbix frontend:
- High-contrast light
- High-contrast dark
| < | |||
|---|---|---|---|
| < | |||
Within this development, default colors for graphs in the dark themes have also been updated:
- When creating a new graph in the dark theme, there will be a higher contrast of colors for items added to the graph (already created graphs are not affected).
- When viewing simple graphs in the dark theme, colors for items will be in higher contrast.
Screen reader-friendly features
- Top-level navigation and user-level content is now readable by screenreader.
- The dashboard and all widgets in view mode (except for the map navigation tree) are now readable by screenreader.
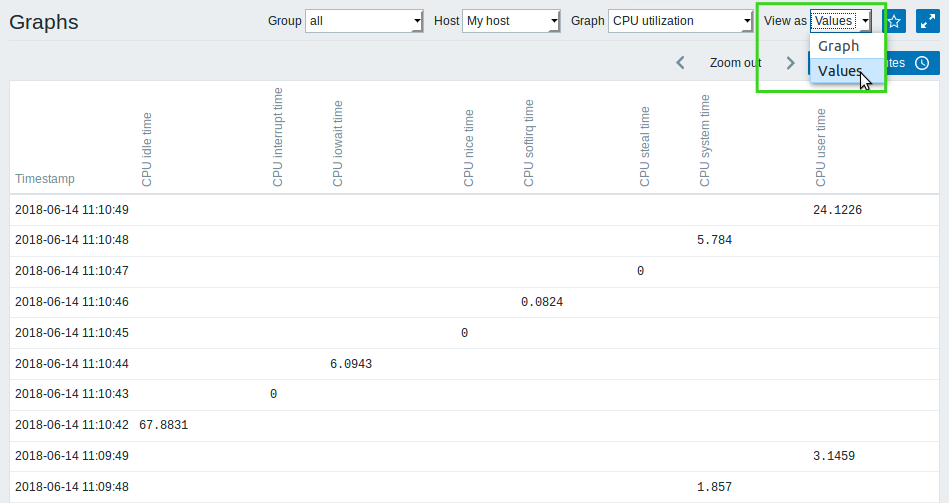
- It is now possible to view graph values as text in a table so that it can be read with a screen reader. This functionality is implemented for custom graphs and ad-hoc graphs.
- Multi-select fields can be managed by a screen reader.
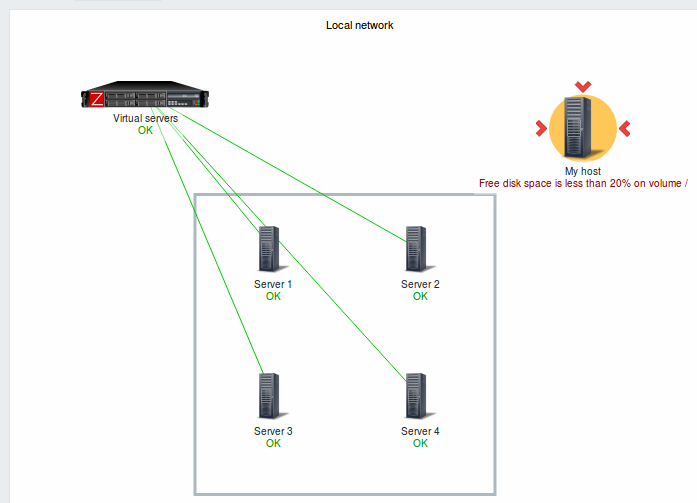
Readable summary in maps
A hidden "aria-label" property has been added to maps allowing map information to be read with a screen reader. Both general map description and individual element description is available, in the following format:
- for map description:
<Map name>, <* of * items in problem state>, <* problems in total>. - for describing one element with one problem:
<Element type>, Status <Element status>, <Element name>, <Problem description>. - for describing one element with multiple problems:
<Element type>, Status <Element status>, <Element name>, <* problems>. - for describing one element without problems:
<Element type>, Status <Element status>, <Element name>.
For example, this description is available:
'Local network, 1 of 6 elements in problem state, 1 problem in total. Host, Status problem, My host, Free disk space is less than 20% on volume \/. Host group, Status ok, Virtual servers. Host, Status ok, Server 1. Host, Status ok, Server 2. Host, Status ok, Server 3. Host, Status ok, Server 4. 'for the following map:
Icons for notification type
Corresponding icons and colouring have been added at the beginning of frontend notifications to indicate whether the message is about success, failure or warning.
| < | < | |||||
|---|---|---|---|---|---|---|
| < | ||||||
| < | ||||||
These changes allow the actual message to be on a white background, improving overall readability.
Green background removed
Green background has been removed:
- for resolved problems in the severity column in Monitoring → Problems/Triggers and the corresponding dashboard widget
| < | |||
|---|---|---|---|
| < | |||
- for devices that are up in Monitoring → Discovery
Discovery status details
Discovery status details in Monitoring → Discovery are now displayed as text inside the cell, instead of a pop-up that's visible upon mouse over.
| In Zabbix 4.0.0 | Before Zabbix 4.0.0 |
 |
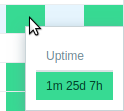 |
In addition, green colouring is removed from cells with uptime, while red remains in the cells with downtime.
Configurable session cookie name
The session cookie name that Zabbix frontend uses for internal authentication is now configurable in ZBX_SESSION_NAME of the frontend definitions.
Host column always displayed
The host column is now always displayed even if only one host is selected in:
- Monitoring → Latest data
- Monitoring → Web
- Reports → Availability
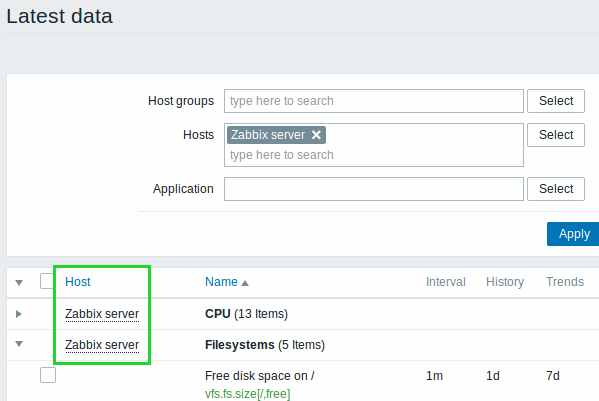
The benefits of this change are:
- The host menu in the latest data page is now always available with links to useful options
- It is clear which host is displayed when using a screenreader
Miscellaneous
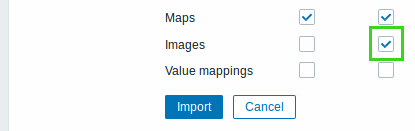
- The allowed character limit has been raised from 63 to 255 ASCII characters for fields containing DNS names. The affected forms are host configuration and passive proxy configuration.
- When importing maps (Monitoring → Maps → Import button) the Create new option for importing images is now checked by default:
Macros
- {ITEM.VALUE}, {ITEM.LASTVALUE} are now supported in the URL field of trigger configuration.
Daemons
Validation to avoid proxy/agent data duplication
Session tokens have been added to incoming proxy/agent data along with virtual IDs that are assigned to incoming values. The value ID is a simple ascending counter, unique within one data session (identified by the session token). This ID is used to discard duplicate values that might be sent in poor connectivity environments. For more details on the protocols, see:
Data without session token will be accepted without validation for duplicate values, ensuring backwards compatibility.
Miscellaneous
- Command line arguments that exceed 2KB are now supported in proc.num and proc.mem checks on AIX platform.
Performance
Server performance
Zabbix server performance has been improved by replacing semaphores with pthread mutexes and read-write locks.
Problem name generation
Problem and event names previously were generated on the fly in the frontend and on server side based on the respective trigger name with all the macros expanded. That lead to severe performance issues and also made it impossible to see historical information about problems if the trigger name had changed.
Now problem and event names are stored directly in the 'events' and 'problem' tables at the moment when an event is generated for a problem or recovery. Zabbix frontend can search and query the respective tables directly. This change leads to a better separation of triggers and problems, improves performance, especially that of the frontend and maintains historical problem names. However, the size of problem/events tables is now larger.
Note that for internal events the name contains an error message why an object changed its state; upon recovery no name is used. For discovery and auto-registration events no name is used.
A new {EVENT.NAME} macro is supported, returning the event/problem name with macros resolved.
See also the upgrade notes for:
Logging
- Zabbix Java gateway logs are now easier to read, as exception stack trace is no longer available in error and warning level messages.
API improvements
From now on user.checkAuthentication method contains additional parameter "extend".