
Table of Contents
11 使用ODBC SQL查询发现
概述
这种低级的发现是通过SQL查询完成的,查询结果会自动转换为适合低级发现的JSON对象。
监控项键值
SQL查询使用"数据库监视"项类型执行。因此,在ODBC监控页上的大多数说明适用于获得一个工作的“数据库监视器”发现规则,唯一的区别是:
键值可以被替换 "db.odbc.select[<description>,<dsn>]".
Zabbix server/proxy 3.0开始支持使用SQL查询进行发现。
作为一个演示如何将SQL查询转换为JSON的实际示例,让我们考虑通过在Zabbix数据库上执行ODBC查询来发现Zabbix代理。这对于自动创建 "zabbix[proxy,<name>,lastaccess]" 内部监控项 来监视哪些代理是活的很有用。
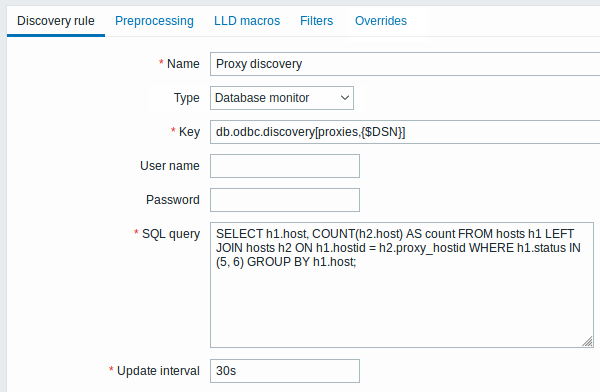
让我们从发现规则配置开始:
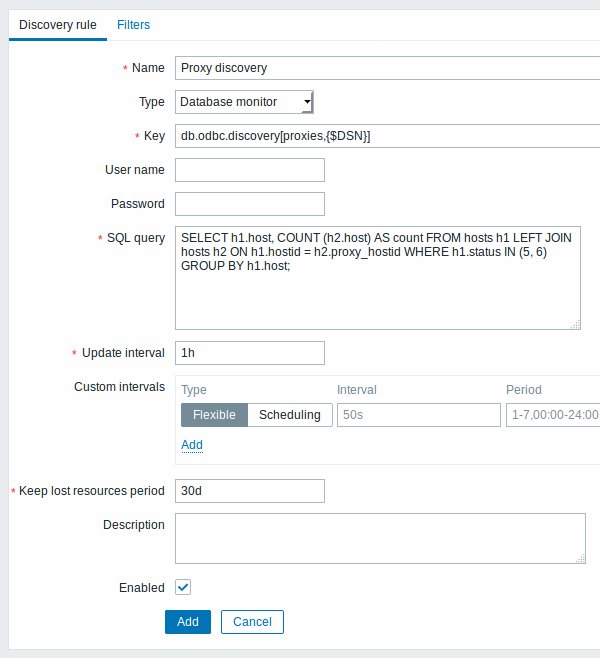
所有强制输入字段都用红色星号标记。
Here, the following direct query on Zabbix database is used to select all Zabbix proxies, together with the number of hosts they are monitoring. The number of hosts can be used, for instance, to filter out empty proxies: 这里,使用以下对Zabbix database的直接查询来选择所有Zabbix proxies,以及它们正在监视的主机数量。例如,可以使用主机的数量来过滤空代理:
mysql> SELECT h1.host, COUNT(h2.host) AS count FROM hosts h1 LEFT JOIN hosts h2 ON h1.hostid = h2.proxy_hostid WHERE h1.status IN (5, 6) GROUP BY h1.host;
       +---------+-------+
       | host    | count |
       +---------+-------+
       | Japan 1 |     5 |
       | Japan 2 |    12 |
       | Latvia  |     3 |
       +---------+-------+
       3 rows in set (0.01 sec)
通过"db.odbc.discovery[]"的内部监控项,这个查询的结果自动转换成JSON:
{
           "data": [
               {
                   "{#HOST}": "Japan 1",
                   "{#COUNT}": "5"
               },
               {
                   "{#HOST}": "Japan 2",
                   "{#COUNT}": "12"
               },
               {
                   "{#HOST}": "Latvia",
                   "{#COUNT}": "3"
               }
           ]
       }
可以看到,列名变成了宏名,所选的行变成了这些宏的值。
如果列名转换成宏名的方式不明显,建议使用列名别名,如上面示例中的"COUNT(h2.host) AS COUNT"。
如果无法将列名转换为有效的宏名,则不支持发现规则,错误消息将详细说明出错的列号。如果需要额外的帮助,在Zabbix Server日志文件的DebugLevel=4下提供获得的列名:
$ grep db.odbc.discovery /tmp/zabbix_server.log
...
23876:20150114:153410.856 In db_odbc_discovery() query:'SELECT h1.host, COUNT(h2.host) FROM hosts h1 LEFT JOIN hosts h2 ON h1.hostid = h2.proxy_hostid WHERE h1.status IN (5, 6) GROUP BY h1.host;'
23876:20150114:153410.860 db_odbc_discovery() column[1]:'host'
23876:20150114:153410.860 db_odbc_discovery() column[2]:'COUNT(h2.host)'
23876:20150114:153410.860 End of db_odbc_discovery():NOTSUPPORTED
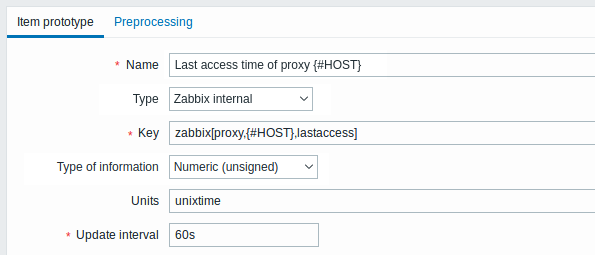
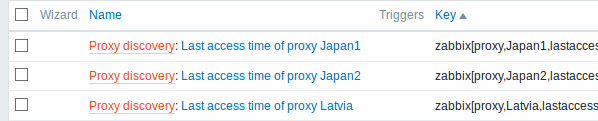
23876:20150114:153410.860 Item [Zabbix server:db.odbc.discovery[proxies,{$DSN}]] error: Cannot convert column #2 name to macro.现在我们了解了SQL查询如何转换为JSON对象,我们可以在item原型中使用{#HOST}宏:
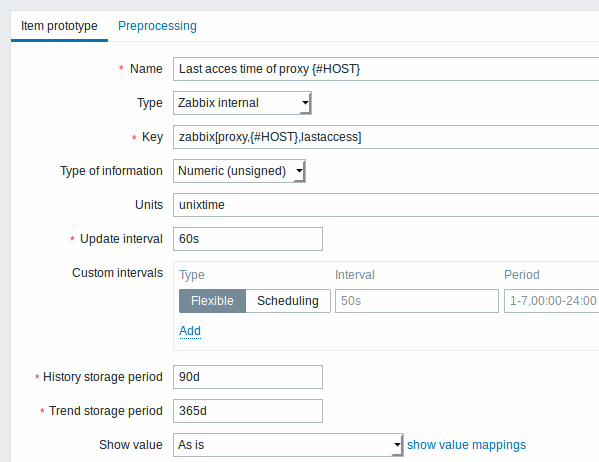
一旦发现zabbix proxy被执行,将为每个代理创建一个监控项:

Using db.odbc.discovery
As a practical example to illustrate how the SQL query is transformed into JSON, let us consider low-level discovery of Zabbix proxies by performing an ODBC query on Zabbix database. This is useful for automatic creation of "zabbix[proxy,<name>,lastaccess]" internal items to monitor which proxies are alive.
Let us start with discovery rule configuration:
All mandatory input fields are marked with a red asterisk.
Here, the following direct query on Zabbix database is used to select all Zabbix proxies, together with the number of hosts they are monitoring. The number of hosts can be used, for instance, to filter out empty proxies:
mysql> SELECT h1.host, COUNT(h2.host) AS count FROM hosts h1 LEFT JOIN hosts h2 ON h1.hostid = h2.proxy_hostid WHERE h1.status IN (5, 6) GROUP BY h1.host;
       +---------+-------+
       | host    | count |
       +---------+-------+
       | Japan 1 |     5 |
       | Japan 2 |    12 |
       | Latvia  |     3 |
       +---------+-------+
       3 rows in set (0.01 sec)
By the internal workings of "db.odbc.discovery[,{$DSN}]" item, the result of this query gets automatically transformed into the following JSON:
[
           {
               "{#HOST}": "Japan 1",
               "{#COUNT}": "5"
           },
           {
               "{#HOST}": "Japan 2",
               "{#COUNT}": "12"
           },
           {
               "{#HOST}": "Latvia",
               "{#COUNT}": "3"
           }
       ]
It can be seen that column names become macro names and selected rows become the values of these macros.
If it is not obvious how a column name would be transformed into a macro name, it is suggested to use column aliases like "COUNT(h2.host) AS count" in the example above.
In case a column name cannot be converted into a valid macro name, the discovery rule becomes not supported, with the error message detailing the offending column number. If additional help is desired, the obtained column names are provided under DebugLevel=4 in Zabbix server log file:
$ grep db.odbc.discovery /tmp/zabbix_server.log
        ...
        23876:20150114:153410.856 In db_odbc_discovery() query:'SELECT h1.host, COUNT(h2.host) FROM hosts h1 LEFT JOIN hosts h2 ON h1.hostid = h2.proxy_hostid WHERE h1.status IN (5, 6) GROUP BY h1.host;'
        23876:20150114:153410.860 db_odbc_discovery() column[1]:'host'
        23876:20150114:153410.860 db_odbc_discovery() column[2]:'COUNT(h2.host)'
        23876:20150114:153410.860 End of db_odbc_discovery():NOTSUPPORTED
        23876:20150114:153410.860 Item [Zabbix server:db.odbc.discovery[proxies,{$DSN}]] error: Cannot convert column #2 name to macro.
Now that we understand how a SQL query is transformed into a JSON object, we can use {#HOST} macro in item prototypes:
Once discovery is performed, an item will be created for each proxy:
Using db.odbc.get
Using db.odbc.get[,{$DSN}] and the following SQL example:
mysql> SELECT h1.host, COUNT(h2.host) AS count FROM hosts h1 LEFT JOIN hosts h2 ON h1.hostid = h2.proxy_hostid WHERE h1.status IN (5, 6) GROUP BY h1.host;
       +---------+-------+
       | host    | count |
       +---------+-------+
       | Japan 1 |     5 |
       | Japan 2 |    12 |
       | Latvia  |     3 |
       +---------+-------+
       3 rows in set (0.01 sec)
this JSON will be returned:
[
           {
               "host": "Japan 1",
               "count": "5"
           },
           {
               "host": "Japan 2",
               "count": "12"
           },
           {
               "host": "Latvia",
               "count": "3"
           }
       ]
As you can see, there are no low-level discovery macros there. However, custom low-level discovery macros can be created in the LLD macros tab of a discovery rule using JSONPath, for example:
Now this {#HOST} macro may be used in item prototypes: