
5 最新数据
概览
监测 → 最新数据 可以用来查看监控项收集的最新值,以及访问监控项的各种图表。
在显示的列表中,单击主机和应用集前的 来展示该主机和应用程序的最新值。您可以展开所有主机和所有应用集,进而,通过单击在行头部的来展示所有监控项(请注意,Zabbix
5.0.2中不支持应用集扩展/折叠。)
来展示该主机和应用程序的最新值。您可以展开所有主机和所有应用集,进而,通过单击在行头部的来展示所有监控项(请注意,Zabbix
5.0.2中不支持应用集扩展/折叠。)
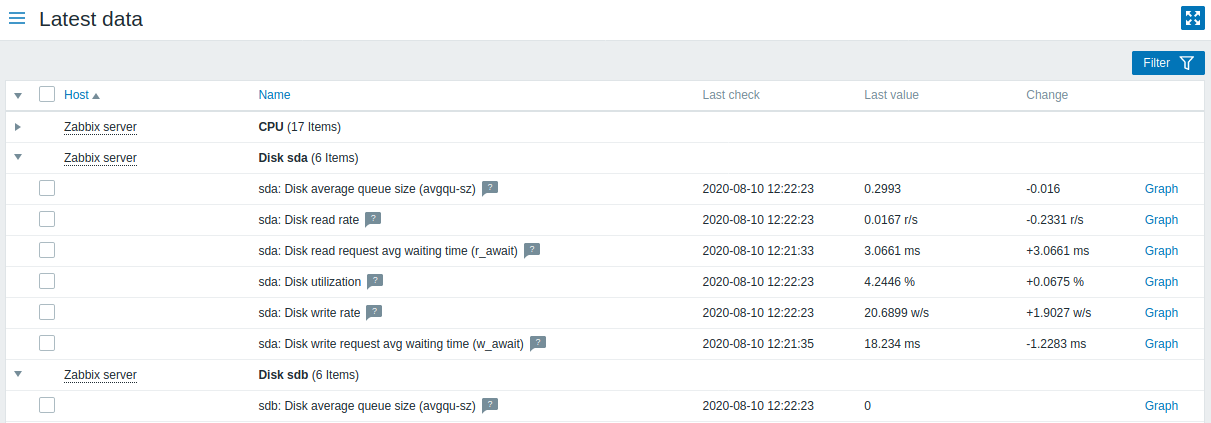
监控项按主机和应用集分组。显示监控项名称,上次检查时间,最新值,变化量以及指向监控项值的简单图形/历史记录链接。
所有具有描述说明的监控项名称旁边都会显示带有问号![]() 的图标。如果将鼠标光标放在该图标上,在工具提示中展示监控项说明。
的图标。如果将鼠标光标放在该图标上,在工具提示中展示监控项说明。
注意:禁用主机的名称显示为红色。在最新数据中也可以访问禁用的主机的数据,包括图形和监控项值列表。
默认情况下,仅显示过去24小时内的值。这样设置是为了优化页面加载数据的时间。可以通过更改include/defines.inc.php 中ZBX_HISTORY_PERIOD常量的值来更改此限制。
<note important>对于采集间隔为1天或以上的监控项,永远不会显示变化量 :::
按钮 在文档检测中介绍了通用的显示模式按钮。
使用筛选器
您可以使用筛选器只显示您感兴趣的监控项。筛选器 链接位于表格右上方。您可以使用它按主机组,主机,应用集,监控项名称中的字符串过滤监控项;还可以选择是否显示没有收集到数据的监控项。为了提高性能,无法使用宏进行过滤数据。
指定一个父主机组,隐式选择所有嵌套的主机组。
显示详细信息 允许显示监控项上的扩展信息。诸如:刷新间隔,历史记录和趋势设置,监控项类型和监控项错误(良好/不支持)之类的详细信息。还提供指向监控项配置的链接。

默认情况下,会显示没有数据的项目,但不显示详细内容。为了更好的页面性能,从Zabbix 5.0.3开始,如果未在筛选器中选择主机,则显示没有数据的监控项选项被已勾选并禁用。
临时比较监控项图表
您可以使用第一列中的复选框选择多个项目,然后用简单或堆叠的临时图表比较它们的数据。要实现这样的效果,请选择感兴趣的监控项,然后单击表格下方所需的图表按钮。
链接到值的历史/简单图形
最新值在列表中的最后一列:
- ** 历史记录链接 ** (用于所有文本项)-链接到显示监控项历史记录的列表(值/最近500个值)。
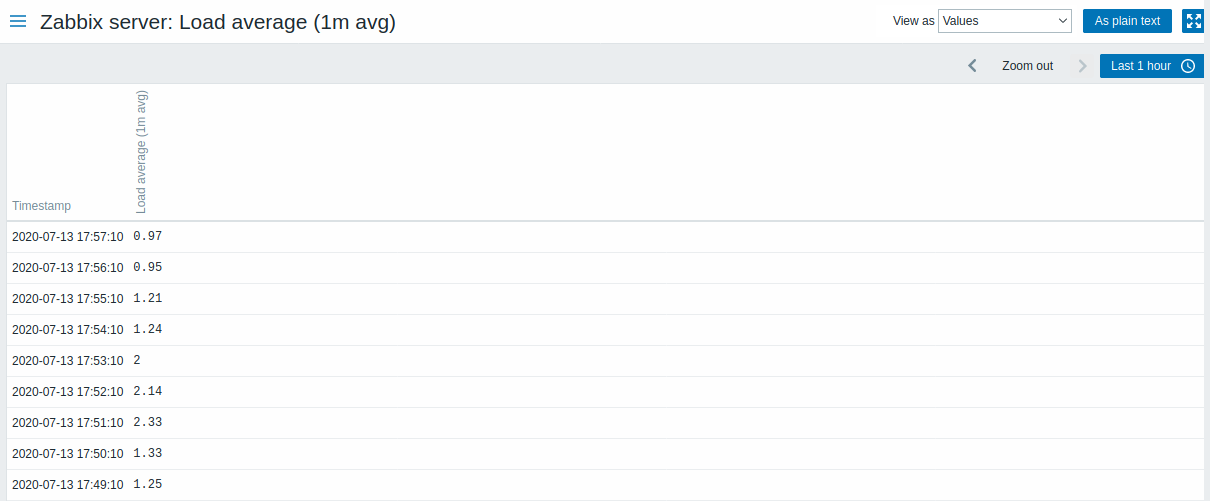
<!-- -->- 图表链接 (用于所有数字项)-链接到一个 简单图。 虽然已图表展示,还是可以通过右上角的下拉菜单切换到值/最近500个值。
此列表中显示的是“原始的”值,即指未经处理的值。
显示的记录总数由“搜索限制”和“过滤结果”参数值定义,在管理→ 一般/通用中设置。
Buttons
View mode buttons being common for all sections are described on the Monitoring page.
Using filter
You can use the filter to display only the items you are interested in. For better search performance, data is searched with macros unresolved.
The Filter link is located above the table to the right. You can use it to filter items by host group, host, application, a string in the item name; you can also select to display items that have no data gathered.
Specifying a parent host group implicitly selects all nested host groups.
Show details allows to extend displayable information on the items. Such details as refresh interval, history and trends settings, item type and item errors (fine/unsupported) are displayed. A link to item configuration is also available.
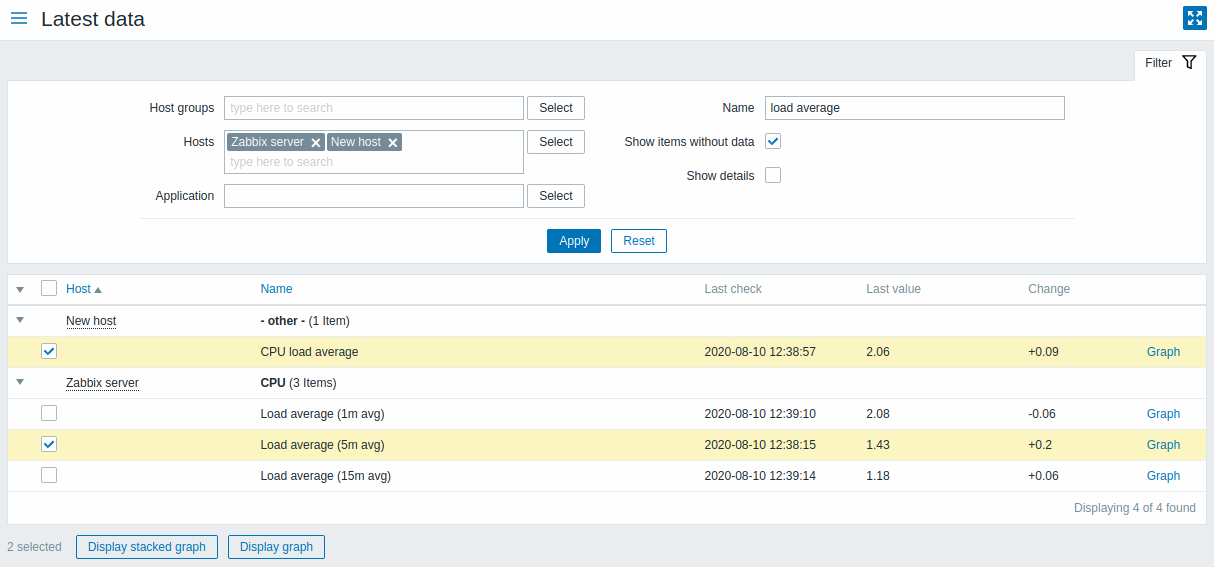
By default, items without data are shown but details are not displayed. For better page performance, since Zabbix 5.0.3, the Show items without data option is checked and disabled if no host is selected in the filter.
Ad-hoc graphs for comparing items
You may use the checkbox in the first column to select several items and then compare their data in a simple or stacked ad-hoc graph. To do that, select items of interest, then click on the required graph button below the table.
Links to value history/simple graph
The last column in the latest value list offers:
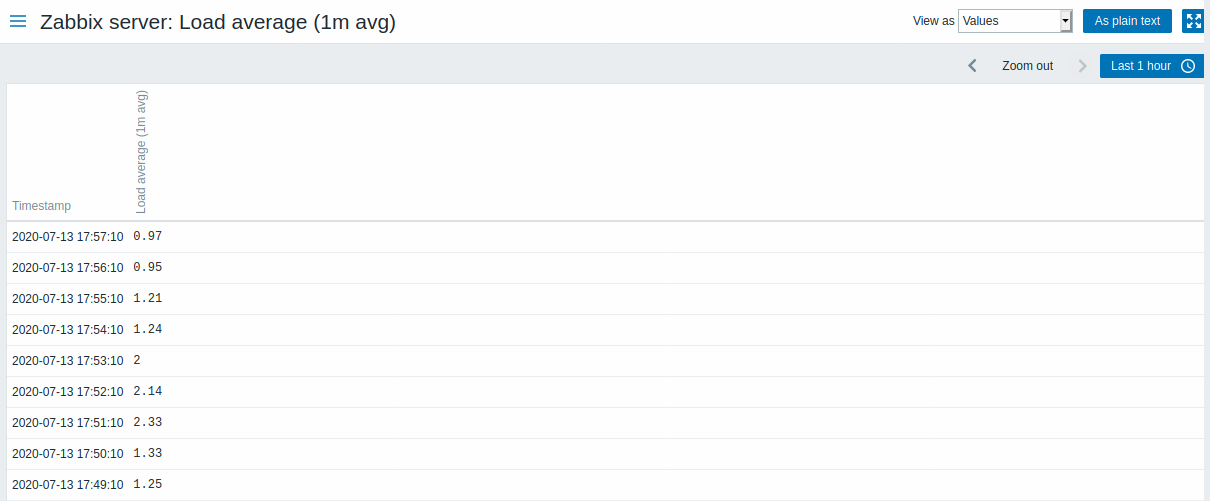
- a History link (for all textual items) - leading to listings (Values/500 latest values) displaying the history of previous item values.
<!-- -->- a Graph link (for all numeric items) - leading to a simple graph. However, once the graph is displayed, a dropdown on the upper right offers a possibility to switch to Values/500 latest values as well.
The values displayed in this list are "raw", that is, no postprocessing is applied.
The total amount of values displayed is defined by the value of Limit for search and filter results parameter, set in Administration → General.