
ウィジェットの作成 (チュートリアル)
これは、シンプルなダッシュボードウィジェットを作成する方法を示すステップバイステップのチュートリアルです。 このウィジェットのすべてのファイルをZIPアーカイブとしてダウンロードできます: lesson_gauge_chart.zip。
作成するもの
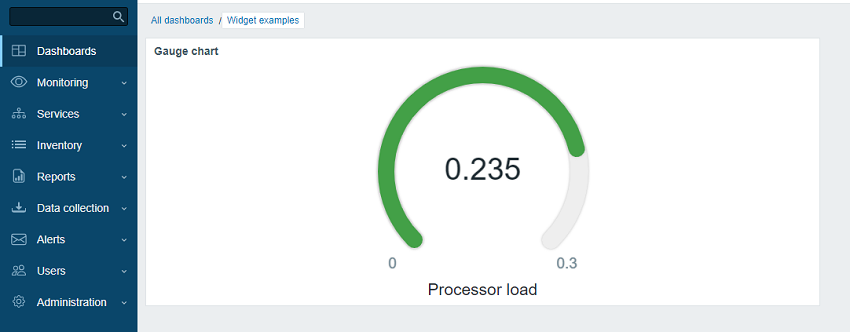
このチュートリアルでは、まず基本的な"Hello, world!"ウィジェットを作成し、次にそれをより高度なウィジェットに変換して、アイテムの値をゲージチャートとして表示します。 完成したウィジェットは次のようになります:
パート I - "Hello, world!"
このセクションでは、最小限必要なウィジェット要素を作成し、新しいウィジェットをZabbixフロントエンドに追加する方法を学びます。
Zabbixフロントエンドに空のウィジェットを追加する
- Zabbixフロントエンドインストールのmodulesディレクトリにlesson_gauge_chartディレクトリを作成します (例: zabbix/ui/modules)。
すべてのカスタムウィジェットは外部モジュールとして扱われるため、Zabbixフロントエンドインストールのmodulesディレクトリに追加する必要があります (例: zabbix/ui/modules)。 zabbix/ui/widgetsディレクトリは、Zabbix組み込みウィジェット用に予約されており、Zabbix UIとともに更新されます。
- 基本的なウィジェットのメタデータを含むmanifest.jsonファイルを作成します (サポートされている[パラメーター](../file_ Structure/manifest)の説明を参照)。
ui/modules/lesson_gauge_chart/manifest.json
{
    "manifest_version": 2.0,
    "id": "lesson_gauge_chart",
    "type": "widget",
    "name": "Gauge chart",
    "namespace": "LessonGaugeChart",
    "version": "1.1",
    "author": "Zabbix"
}- Zabbixフロントエンドで、管理 → 一般 → モジュールセクションに移動し、ディレクトリのスキャンボタンをクリックします。
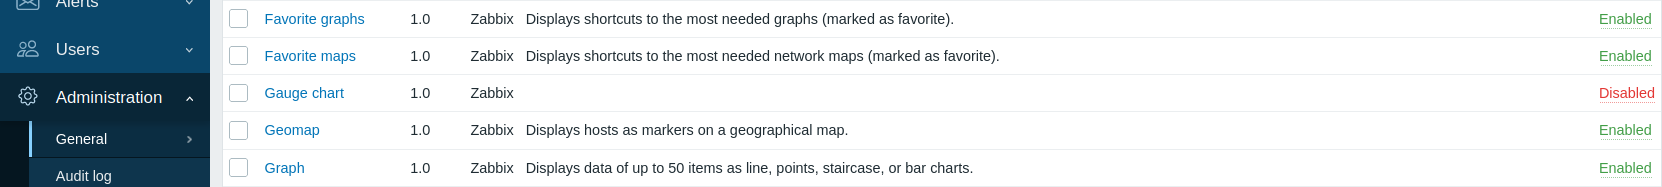
- リスト内で新しいモジュールGauge chartを見つけ、"無効"ハイパーリンクをクリックしてモジュールのステータスを"無効"から"有効"に変更します (モジュールがリストされていない場合、トラブルシューティングセクションを確認してください)。
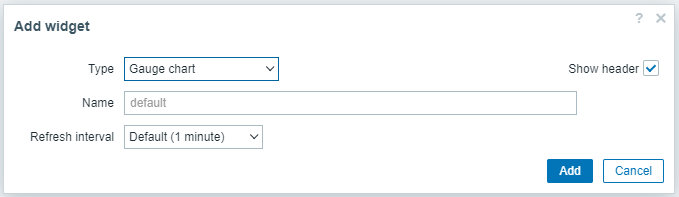
- ダッシュボードを開き、編集モードに切り替えて、新しいウィジェットを追加します。タイプフィールドで、"Gauge chart"を選択します。
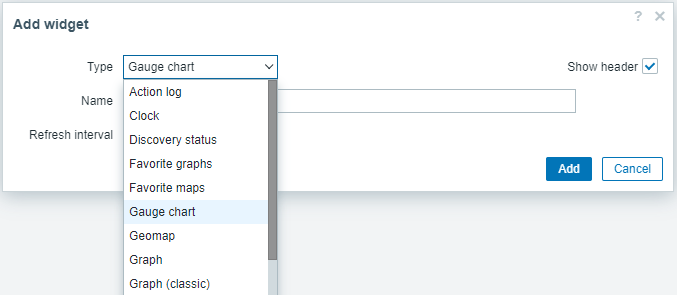
- この時点で、Gauge chartウィジェット構成には、共通のウィジェットフィールドNameとRefresh intervalのみが含まれています。追加をクリックしてウィジェットをダッシュボードに追加します。
- 空のウィジェットがダッシュボードに表示されます。右上隅にある変更を保存をクリックして、ダッシュボードを保存します。
![]()
ウィジェットビューの追加
ウィジェットのviewファイルは、viewsディレクトリ(このチュートリアルの場合は、ui/modules/lesson_gauge_chart/views/)に配置する必要があります。 ファイルのデフォルト名がwidget.view.phpの場合、manifest.jsonファイルに登録する必要はありません。 ファイルの名前が異なる場合は、manifest.jsonファイルのactions/widget.lesson_gauge_chart.viewセクションで指定します。
-
lesson_gauge_chartディレクトリにviewsディレクトリを作成します。
-
viewsディレクトリにwidget.view.phpファイルを作成します。
ui/modules/lesson_gauge_chart/views/widget.view.php
<?php

/**
 * Gauge chart widget view.
 *
 * @var CView $this
 * @var array $data
 */

(new CWidgetView($data))
    ->addItem(
        new CTag('h1', true, 'Hello, world!')
    )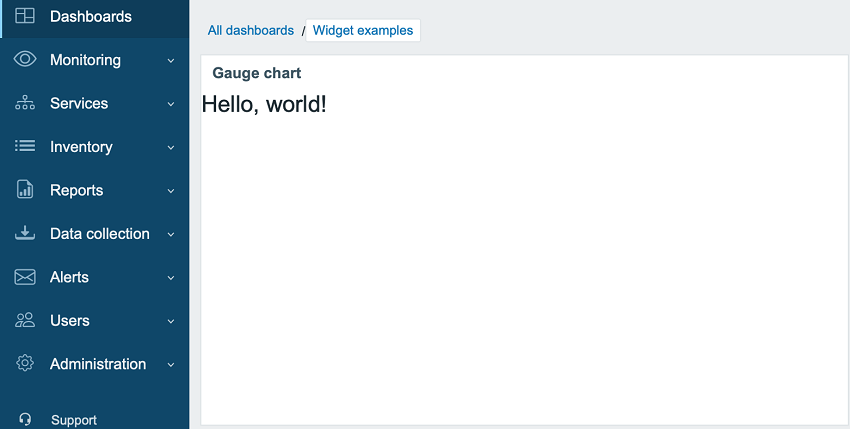
->show();- ダッシュボードを更新します。Gauge chartウィジェットに"Hello, world!"が表示されるようになりました。
パート II - ゲージチャート
設定を構成ビューに追加し、ウィジェットビューで使用する
このセクションでは、ウィジェット構成フィールドを追加し、入力された値をウィジェットビューにテキストとして表示する方法を学習します。
ウィジェット構成は、フォーム(Zabbix\Widgets\CWidgetForm)とウィジェットフォームビュー(widget.edit.php)で構成されます。 フィールド(Zabbix\Widgets\CWidgetField)を追加するには、Zabbix\Widgets\CWidgetFormを拡張するWidgetFormクラスを作成する必要があります。
フォームには、ユーザーが入力した値を検証するために使用されるさまざまなタイプのフィールドのセット(Zabbix\Widgets\CWidgetField)が含まれています。 各入力要素タイプのフォームフィールド(Zabbix\Widgets\CWidgetField)は、値を単一の形式に変換してデータベースに保存します。
ウィジェットのformファイルは、includesディレクトリ(このチュートリアルの場合は、ui/modules/lesson_gauge_chart/includes/)に配置する必要があります。 ファイルのデフォルト名がWidgetForm.phpの場合、manifest.jsonファイルに登録する必要はありません。 ファイルの名前が異なる場合は、manifest.jsonファイルのwidget/form_classセクションで指定します。
-
lesson_gauge_chartディレクトリに新しいディレクトリincludesを作成します。
-
WidgetForm.phpファイルをincludesディレクトリに作成します。
ui/modules/lesson_gauge_chart/includes/WidgetForm.php
<?php

namespace Modules\LessonGaugeChart\Includes;

use Zabbix\Widgets\CWidgetForm;

class WidgetForm extends CWidgetForm {
}- ウィジェット設定フォームにDescriptionフィールドを追加します。 これは通常のテキストフィールドで、ユーザーは任意の文字セットを入力できます。 CWidgetFieldTextBoxクラスを使用できます。
ui/modules/lesson_gauge_chart/includes/WidgetForm.php
<?php

namespace Modules\LessonGaugeChart\Includes;

use Zabbix\Widgets\CWidgetForm;

use Zabbix\Widgets\Fields\CWidgetFieldTextBox;

class WidgetForm extends CWidgetForm {

    public function addFields(): self {
        return $this
            ->addField(
                new CWidgetFieldTextBox('description', _('Description'))
            );
   }
}- viewsディレクトリに、ウィジェット構成ビューファイルwidget.edit.phpを作成し、新しいDescriptionフィールドのビューを追加します。 CWidgetFieldTextBoxフィールドクラスの場合、ビューはCWidgetFieldTextBoxViewです。
ui/modules/lesson_gauge_chart/views/widget.edit.php
<?php

/**
 * Gauge chart widget form view.
 *
 * @var CView $this
 * @var array $data
 */

(new CWidgetFormView($data))
    ->addField(
        new CWidgetFieldTextBoxView($data['fields']['description'])
    )
->show();-
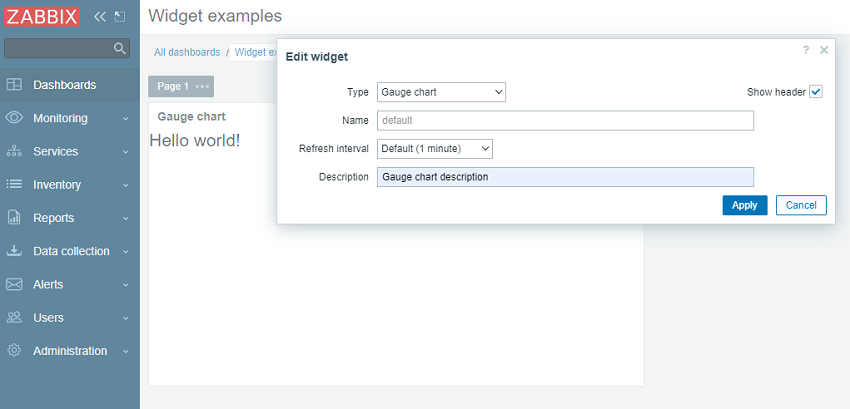
ダッシュボードに移動し、ウィジェットの歯車アイコンをクリックしてウィジェット構成フォームを開きます。
-
ウィジェット設定フォームには、新しいDescriptionテキストフィールドが含まれるようになりました。 Gauge chart descriptionのような、任意の値を入力します。
- ウィジェット設定フォームで適用をクリックします。次に、右上隅にある変更を保存をクリックしてダッシュボードを保存します。 新しい説明はどこにも表示されず、ウィジェットには"Hello, world!"が表示されたままであることに注意してください。
新しい説明をウィジェットに表示するには、Descriptionフィールドの値をデータベースから取得し、ウィジェットビューに渡す必要があります。そのためには、アクションクラスを作成する必要があります。
-
lesson_gauge_chartディレクトリに新しいディレクトリactionsを作成します。
-
actionsディレクトリにWidgetView.phpファイルを作成します。 WidgetViewアクションクラスはCControllerDashboardWidgetViewクラスを拡張します。
ウィジェット構成フィールドの値は、アクションクラスの$fields_valuesプロパティに保存されます。
ui/modules/lesson_gauge_chart/actions/WidgetView.php
<?php

namespace Modules\LessonGaugeChart\Actions;

use CControllerDashboardWidgetView,
    CControllerResponseData;

class WidgetView extends CControllerDashboardWidgetView {

    protected function doAction(): void {
        $this->setResponse(new CControllerResponseData([
            'name' => $this->getInput('name', $this->widget->getName()),
            'description' => $this->fields_values['description'],
            'user' => [
                'debug_mode' => $this->getDebugMode()
            ]
        ]));
    }
}- manifest.jsonを開き、actions/widget.lesson_gauge_chart.viewセクションにWidgetViewをアクションクラスとして登録します。
ui/modules/lesson_gauge_chart/manifest.json
{
    "manifest_version": 2.0,
    "id": "lesson_gauge_chart",
    "type": "widget",
    "name": "Gauge chart",
    "namespace": "LessonGaugeChart",
    "version": "1.0",
    "author": "Zabbix",
    "actions": {
        "widget.lesson_gauge_chart.view": {
            "class": "WidgetView"
        }
    }
}- これで、$data['description']に含まれる説明フィールドの値をウィジェットビューで使用できるようになりました。 views/widget.view.phpを開き、静的テキスト"Hello, world!"を$data['description']に置き換えます。
ui/modules/lesson_gauge_chart/views/widget.view.php
<?php
/**
* Gauge chart widget view.
*
* @var CView $this
* @var array $data
*/
(new CWidgetView($data))
->addItem(
new CTag('h1', true, $data['description'])
)
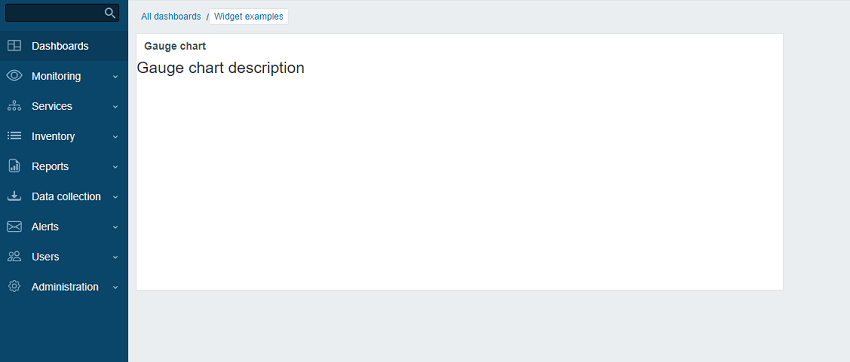
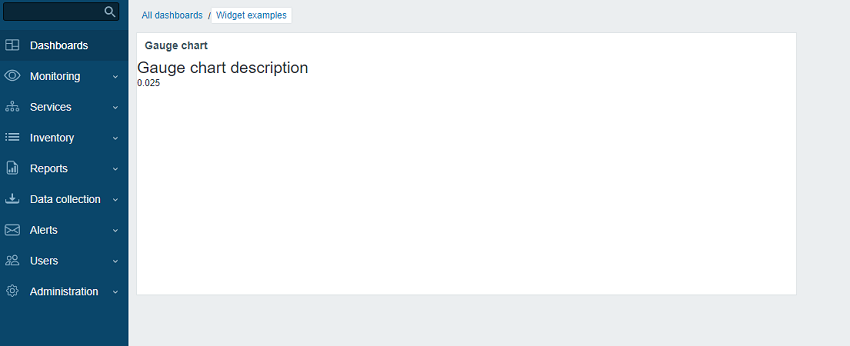
->show();- ダッシュボードページを更新します。"Hello, world!"の代わりにウィジェットの説明テキストが表示されるはずです。
API経由でアイテム値の取得
ウィジェットには、ユーザーが選択したアイテムの最新の値が表示される必要があります。 そのためには、ウィジェット構成でアイテムを選択する機能を追加する必要があります。
このセクションでは、アイテム選択フィールドをウィジェットフォームに追加する方法と、このフィールドのビジュアル部分を構成ビューに追加する方法を学習します。 その後、ウィジェットコントローラーはAPIリクエストを介してアイテムデータとその値を取得できるようになります。 値を受信すると、ウィジェットビューに表示できます。
- includes/WidgetForm.phpを開き、CWidgetFieldMultiSelectItemフィールドを追加します。 これにより、設定フォームでアイテムを選択できるようになります。
ui/modules/lesson_gauge_chart/includes/WidgetForm.php
<?php

namespace Modules\LessonGaugeChart\Includes;

use Zabbix\Widgets\{
    CWidgetField,
    CWidgetForm
};

use Zabbix\Widgets\Fields\{
    CWidgetFieldMultiSelectItem,
    CWidgetFieldTextBox
};

/**
 * Gauge chart widget form.
 */
class WidgetForm extends CWidgetForm {

    public function addFields(): self {
        return $this
            ->addField(
                (new CWidgetFieldMultiSelectItem('itemid', _('Item')))
                    ->setFlags(CWidgetField::FLAG_NOT_EMPTY | CWidgetField::FLAG_LABEL_ASTERISK)
                    ->setMultiple(false)
            )
            ->addField(
                new CWidgetFieldTextBox('description', _('Description'))
            );
    }
}- views/widget.edit.phpを開き、フィールドビジュアルコンポーネントを構成ビューに追加します。
ui/modules/lesson_gauge_chart/views/widget.edit.php
<?php

/**
 * Gauge chart widget form view.
 *
 * @var CView $this
 * @var array $data
 */

(new CWidgetFormView($data))
    ->addField(
        new CWidgetFieldMultiSelectItemView($data['fields']['itemid'])
    )
    ->addField(
        new CWidgetFieldTextBoxView($data['fields']['description'])
    )
->show();-
ダッシュボードに戻り、ウィジェットの歯車アイコンをクリックしてウィジェット構成フォームを開きます。
-
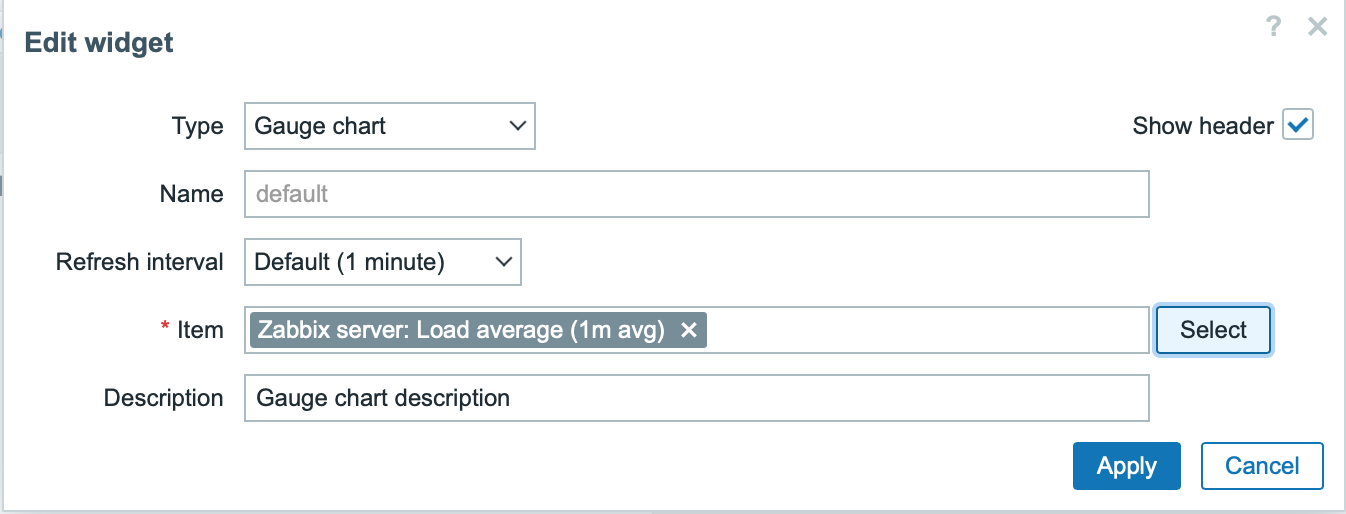
ウィジェット設定フォームには、新しい入力フィールドItemが含まれるようになりました。 ホスト"Zabbix server"とアイテム"Load average (1m avg)"を選択します。
-
ウィジェット設定フォームで適用をクリックします。次に、右上隅にある変更を保存をクリックしてダッシュボードを保存します。
-
actions/WidgetView.phpを開いて変更します。
今後、アイテムIDは$this->fields_values['itemid']のウィジェットコントローラーで利用できるようになります。 doAction()コントローラーメソッドは、APIメソッドitem.getを使用してアイテムデータ(名前、値のタイプ、単位)を、APIメソッドhistory.getを使用してアイテムの最新の値を収集します。
ui/modules/lesson_gauge_chart/actions/WidgetView.php
<?php

namespace Modules\LessonGaugeChart\Actions;

use API,
    CControllerDashboardWidgetView,
    CControllerResponseData;

class WidgetView extends CControllerDashboardWidgetView {

    protected function doAction(): void {
        $db_items = API::Item()->get([
            'output' => ['itemid', 'value_type', 'name', 'units'],
            'itemids' => $this->fields_values['itemid'],
            'webitems' => true,
            'filter' => [
                'value_type' => [ITEM_VALUE_TYPE_UINT64, ITEM_VALUE_TYPE_FLOAT]
            ]
        ]);

        $value = null;

        if ($db_items) {
            $item = $db_items[0];

            $history = API::History()->get([
                'output' => API_OUTPUT_EXTEND,
                'itemids' => $item['itemid'],
                'history' => $item['value_type'],
                'sortfield' => 'clock',
                'sortorder' => ZBX_SORT_DOWN,
                'limit' => 1
            ]);

            if ($history) {
                $value = convertUnitsRaw([
                    'value' => $history[0]['value'],
                    'units' => $item['units']
                ]);
            }
        }

        $this->setResponse(new CControllerResponseData([
            'name' => $this->getInput('name', $this->widget->getName()),
            'value' => $value,
            'description' => $this->fields_values['description'],
            'user' => [
                'debug_mode' => $this->getDebugMode()
            ]
        ]));
    }
}- views/widget.view.phpを開き、アイテム値をウィジェットビューに追加します。
ui/modules/lesson_gauge_chart/views/widget.view.php
<?php

/**
 * Gauge chart widget view.
 *
 * @var CView $this
 * @var array $data
 */

(new CWidgetView($data))
    ->addItem([
        new CTag('h1', true, $data['description']),
        new CDiv($data['value'] !== null ? $data['value']['value'] : _('No data'))
    ])
->show();- ダッシュボードページを更新します。ウィジェットには最新のアイテム値が表示されます。
Advanced configurationを構成ビューに追加
このセクションでは、色、最小値と最大値、単位、前に作成したDescriptionフィールドなどのオプションのパラメーターを含む、展開/折りたたみ可能なAdvanced configurationセクションを追加する方法を学習します。
- メインウィジェットディレクトリlesson_gauge_chartにWidget.phpファイルを作成し、新しいクラスWidgetを作成します。
Widgetクラスは、CWidget基本クラスを拡張して、デフォルトのウィジェット設定 (この場合は翻訳) を追加/上書きします。 以下に示すJavaScriptは、データが欠落している場合に文字列"No data"を表示します。 Zabbix UI翻訳ファイルには"No data"という文字列が存在します。
ウィジェット定数がある場合は、Widgetクラスにも指定することをお勧めします。
ui/modules/lesson_gauge_chart/Widget.php
<?php

namespace Modules\LessonGaugeChart;

use Zabbix\Core\CWidget;

class Widget extends CWidget {

    public const UNIT_AUTO = 0;
    public const UNIT_STATIC = 1;

    public function getTranslationStrings(): array {
        return [
            'class.widget.js' => [
                'No data' => _('No data')
            ]
        ];
    }
}- includes/WidgetForm.phpを開き、新しいフィールドColor(カラーピッカー)、Min(数値フィールド)、Max(数値フィールド)、およびUnits(選択)を追加し、カラーピッカーのパレットのデフォルトの色を定義します。次の手順で使用できるようにします。
ui/modules/lesson_gauge_chart/includes/WidgetForm.php
<?php

namespace Modules\LessonGaugeChart\Includes;

use Modules\LessonGaugeChart\Widget;

use Zabbix\Widgets\{
    CWidgetField,
    CWidgetForm
};

use Zabbix\Widgets\Fields\{
    CWidgetFieldColor,
    CWidgetFieldMultiSelectItem,
    CWidgetFieldNumericBox,
    CWidgetFieldSelect,
    CWidgetFieldTextBox
};

/**
 * Gauge chart widget form.
 */
class WidgetForm extends CWidgetForm {

    public const DEFAULT_COLOR_PALETTE = [
        'FF465C', 'B0AF07', '0EC9AC', '524BBC', 'ED1248', 'D1E754', '2AB5FF', '385CC7', 'EC1594', 'BAE37D',
        '6AC8FF', 'EE2B29', '3CA20D', '6F4BBC', '00A1FF', 'F3601B', '1CAE59', '45CFDB', '894BBC', '6D6D6D'
    ];

    public function addFields(): self {
        return $this
            ->addField(
                (new CWidgetFieldMultiSelectItem('itemid', _('Item')))
                    ->setFlags(CWidgetField::FLAG_NOT_EMPTY | CWidgetField::FLAG_LABEL_ASTERISK)
                    ->setMultiple(false)
            )
            ->addField(
                (new CWidgetFieldColor('chart_color', _('Color')))->setDefault('FF0000')
            )
            ->addField(
                (new CWidgetFieldNumericBox('value_min', _('Min')))
                    ->setDefault(0)
                    ->setFlags(CWidgetField::FLAG_NOT_EMPTY | CWidgetField::FLAG_LABEL_ASTERISK)
            )
            ->addField(
                (new CWidgetFieldNumericBox('value_max', _('Max')))
                    ->setDefault(100)
                    ->setFlags(CWidgetField::FLAG_NOT_EMPTY | CWidgetField::FLAG_LABEL_ASTERISK)
            )
            ->addField(
                (new CWidgetFieldSelect('value_units', _('Units'), [
                    Widget::UNIT_AUTO => _x('Auto', 'history source selection method'),
                    Widget::UNIT_STATIC => _x('Static', 'history source selection method')
                ]))->setDefault(Widget::UNIT_AUTO)
            )
            ->addField(
                (new CWidgetFieldTextBox('value_static_units'))
            )
            ->addField(
                new CWidgetFieldTextBox('description', _('Description'))
            );
    }
}- views/widget.edit.phpを開き、フィールドのビジュアルコンポーネントを構成ビューに追加します。
ui/modules/lesson_gauge_chart/views/widget.edit.php
<?php

/**
 * Gauge chart widget form view.
 *
 * @var CView $this
 * @var array $data
 */

$lefty_units = new CWidgetFieldSelectView($data['fields']['value_units']);
$lefty_static_units = (new CWidgetFieldTextBoxView($data['fields']['value_static_units']))
    ->setPlaceholder(_('value'))
    ->setWidth(ZBX_TEXTAREA_TINY_WIDTH);

(new CWidgetFormView($data))
    ->addField(
        (new CWidgetFieldMultiSelectItemView($data['fields']['itemid']))
            ->setPopupParameter('numeric', true)
    )
    ->addFieldset(
        (new CWidgetFormFieldsetCollapsibleView(_('Advanced configuration')))
            ->addField(
                new CWidgetFieldColorView($data['fields']['chart_color'])
            )
            ->addField(
                new CWidgetFieldNumericBoxView($data['fields']['value_min'])
            )
            ->addField(
                new CWidgetFieldNumericBoxView($data['fields']['value_max'])
            )
            ->addItem([
                $lefty_units->getLabel(),
                (new CFormField([
                    $lefty_units->getView()->addClass(ZBX_STYLE_FORM_INPUT_MARGIN),
                    $lefty_static_units->getView()
                ]))
            ])
            ->addField(
                new CWidgetFieldTextBoxView($data['fields']['description'])
            )
    )
->show();CWidgetFormViewクラスのaddField()メソッドは、CSSクラス文字列を2番目のパラメーターとして受け取ります。
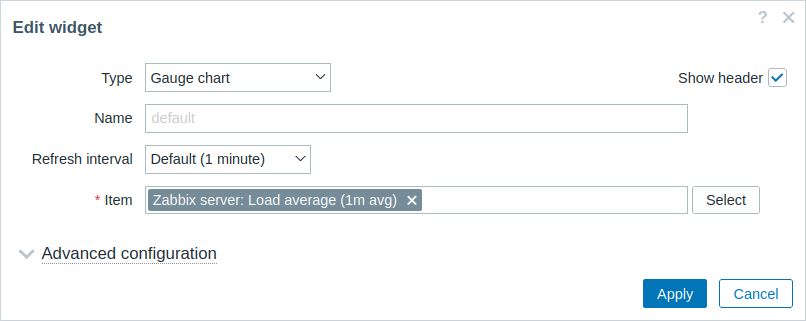
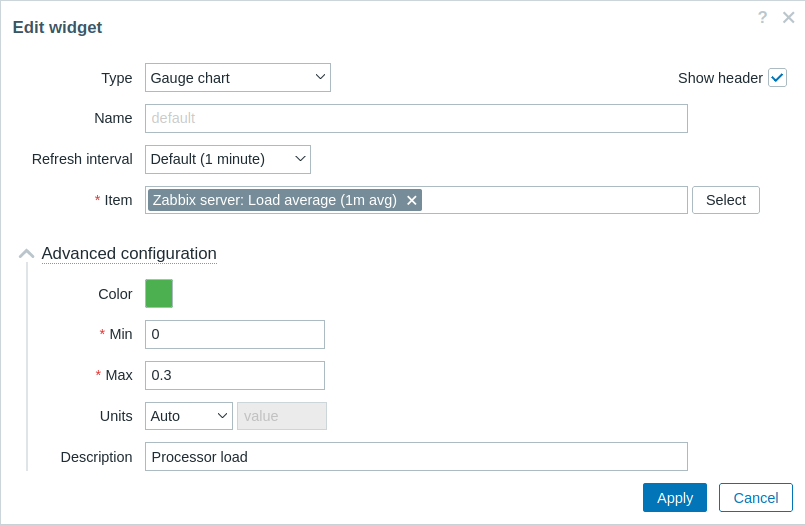
- ダッシュボードに戻り、編集モードに切り替えて、ウィジェットの歯車アイコンをクリックしてウィジェット構成フォームを開きます。 ウィジェット設定フォームには、新しい展開/折りたたみ可能なセクションAdvanced configurationが含まれるようになりました。
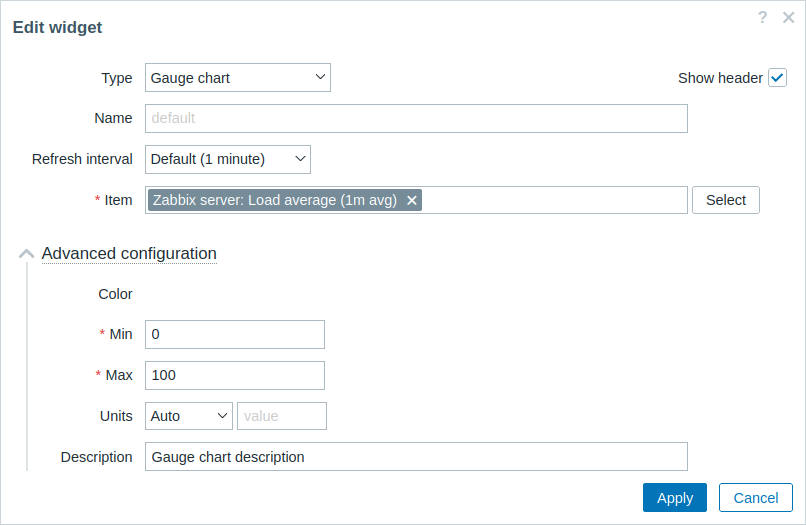
- Advanced configurationセクションを展開すると、追加のウィジェット構成フィールドが表示されます。 Colorフィールドにはまだカラーピッカーがないことに注意してください。 これは、カラーピッカーをJavaScriptで初期化する必要があるためです。これは、次のセクションウィジェットにJavaScriptを追加で追加されます。
ウィジェットにJavaScriptを追加
このセクションでは、最新の値が正常であるか、または高すぎるか低すぎるかを示すゲージチャート(JavaScriptを使用して作成)を追加する方法を学習します。
- viewsディレクトリにwidget.edit.js.phpファイルを作成します。
JavaScriptは、構成ビューでカラーピッカーを初期化する役割を果たします。
ui/modules/lesson_gauge_chart/views/widget.edit.js.php
<?php

use Modules\LessonGaugeChart\Widget;

?>

window.widget_lesson_gauge_chart_form = new class {

    init({color_palette}) {
        this._unit_select = document.getElementById('value_units');
        this._unit_value = document.getElementById('value_static_units');

        this._unit_select.addEventListener('change', () => this.updateForm());

        colorPalette.setThemeColors(color_palette);

        for (const colorpicker of jQuery('.<?= ZBX_STYLE_COLOR_PICKER ?> input')) {
            jQuery(colorpicker).colorpicker();
        }

        const overlay = overlays_stack.getById('widget_properties');

        for (const event of ['overlay.reload', 'overlay.close']) {
            overlay.$dialogue[0].addEventListener(event, () => { jQuery.colorpicker('hide'); });
        }

        this.updateForm();
    }

    updateForm() {
        this._unit_value.disabled = this._unit_select.value == <?= Widget::UNIT_AUTO ?>;
    }
};- views/widget.edit.phpを開き、JavaScriptを含むwidget.edit.js.phpファイルを構成ビューに追加します。 これを行うには、includeJsFile()メソッドを使用します。インラインJavaScriptを追加するには、addJavaScript()メソッドを使用します。
ui/modules/lesson_gauge_chart/views/widget.edit.php
<?php

/**
 * Gauge chart widget form view.
 *
 * @var CView $this
 * @var array $data
 */

use Modules\LessonGaugeChart\Includes\WidgetForm;

$lefty_units = new CWidgetFieldSelectView($data['fields']['value_units']);
$lefty_static_units = (new CWidgetFieldTextBoxView($data['fields']['value_static_units']))
    ->setPlaceholder(_('value'))
    ->setWidth(ZBX_TEXTAREA_TINY_WIDTH);

(new CWidgetFormView($data))
    ->addField(
        (new CWidgetFieldMultiSelectItemView($data['fields']['itemid']))
            ->setPopupParameter('numeric', true)
    )
    ->addFieldset(
        (new CWidgetFormFieldsetCollapsibleView(_('Advanced configuration')))
            ->addField(
                new CWidgetFieldColorView($data['fields']['chart_color'])
            )
            ->addField(
                new CWidgetFieldNumericBoxView($data['fields']['value_min'])
            )
            ->addField(
                new CWidgetFieldNumericBoxView($data['fields']['value_max'])
            )
            ->addItem([
                $lefty_units->getLabel(),
                (new CFormField([
                    $lefty_units->getView()->addClass(ZBX_STYLE_FORM_INPUT_MARGIN),
                    $lefty_static_units->getView()
                ]))
            ])
            ->addField(
                new CWidgetFieldTextBoxView($data['fields']['description'])
            )
    )
    ->includeJsFile('widget.edit.js.php')
    ->addJavaScript('widget_lesson_gauge_chart_form.init('.json_encode([
        'color_palette' => WidgetForm::DEFAULT_COLOR_PALETTE
    ], JSON_THROW_ON_ERROR).');')
->show();- ダッシュボードに戻り、ウィジェットの歯車アイコンをクリックしてウィジェット構成フォームを開きます。 次に、Advanced configurationセクションを展開して、初期化されたカラーピッカーを表示します。 フィールドに値を入力し、ゲージチャートの色を選択します。
-
ウィジェット設定フォームで適用をクリックします。次に、右上隅にある変更を保存をクリックしてダッシュボードを保存します。
-
actions/WidgetView.phpを開き、コントローラーを更新します。
$this->fields_valuesプロパティには、すべてのAdvanced configurationフィールドの値が含まれるようになりました。 コントローラーを完成させて、構成と選択したアイテムの値をウィジェットビューに渡すことができるようにします。
ui/modules/lesson_gauge_chart/actions/WidgetView.php
<?php

namespace Modules\LessonGaugeChart\Actions;

use API,
    CControllerDashboardWidgetView,
    CControllerResponseData;

class WidgetView extends CControllerDashboardWidgetView {

    protected function doAction(): void {
        $db_items = API::Item()->get([
            'output' => ['itemid', 'value_type', 'name', 'units'],
            'itemids' => $this->fields_values['itemid'],
            'webitems' => true,
            'filter' => [
                'value_type' => [ITEM_VALUE_TYPE_UINT64, ITEM_VALUE_TYPE_FLOAT]
            ]
        ]);

        $history_value = null;

        if ($db_items) {
            $item = $db_items[0];

            $history = API::History()->get([
                'output' => API_OUTPUT_EXTEND,
                'itemids' => $item['itemid'],
                'history' => $item['value_type'],
                'sortfield' => 'clock',
                'sortorder' => ZBX_SORT_DOWN,
                'limit' => 1
            ]);

            if ($history) {
                $history_value = convertUnitsRaw([
                    'value' => $history[0]['value'],
                    'units' => $item['units']
                ]);
            }
        }

        $this->setResponse(new CControllerResponseData([
            'name' => $this->getInput('name', $this->widget->getName()),
            'history' => $history_value,
            'fields_values' => $this->fields_values,
            'user' => [
                'debug_mode' => $this->getDebugMode()
            ]
        ]));
    }
}- views/widget.view.phpを開いて変更します。
次の手順で描画するゲージチャート用のコンテナと、説明用のコンテナを作成する必要があります。
値をJSONオブジェクトとしてJavaScriptに渡すには、setVar()メソッドを使用します。
ui/modules/lesson_gauge_chart/views/widget.view.php
<?php

/**
 * Gauge chart widget view.
 *
 * @var CView $this
 * @var array $data
 */

(new CWidgetView($data))
    ->addItem([
        (new CDiv())->addClass('chart'),
        $data['fields_values']['description']
            ? (new CDiv($data['fields_values']['description']))->addClass('description')
            : null
    ])
    ->setVar('history', $data['history'])
    ->setVar('fields_values', $data['fields_values'])
->show();-
lesson_gauge_chartディレクトリに新しいディレクトリassetsを作成します。 このディレクトリは、JavaScript、CSS、および場合によってはフォントや画像などのその他の資産を保存するために使用されます。
-
ウィジェットビューJavaScriptの場合は、assetsディレクトリにjsディレクトリを作成します。
-
assets/jsディレクトリにclass.widget.jsファイルを作成します。
このJavaScriptウィジェットクラスは、すべてのダッシュボードウィジェットの基本JavaScriptクラス(CWidget)を拡張します。
ダッシュボードはウィジェットの正しい実装に依存しており、それぞれのJavaScriptメソッドの呼び出しを通じて関連情報をウィジェットに伝達します。 ダッシュボードは、何らかのインタラクションが発生したときにウィジェットがイベントを生成することも期待します。 したがって、CWidgetクラスには、ウィジェット動作のデフォルト実装を備えた一連のメソッドが含まれており、クラスを拡張することでカスタマイズできます。
この場合、いくつかのカスタマイズが必要となるため、次のウィジェットの動作に対してカスタムロジックが実装されます。
- ウィジェットの初期状態を定義するウィジェット初期化 (onInitialize()メソッドを参照)。
- ウィジェットの更新プロセスがエラーなく成功した場合、ウィジェットの内容を表示します (つまり、ゲージチャートを描画します) (processUpdateResponse(response)メソッドと、関連する_resizeChart()および_updatedChart()メソッドを参照してください)。
- ウィジェットのサイズ変更 (onResize()メソッドと関連する_resizeChart()メソッドを参照)。
ゲージチャートウィジェットのその他の側面については、ウィジェットの動作のデフォルトの実装が使用されます。 CWidgetクラスのJavaScriptメソッドの詳細については、JavaScriptを参照してください。
このJavaScriptはウィジェットビューに必要なため、ダッシュボードページとともにロードされる必要があります。 JavaScriptの読み込みを有効にするには、10の手順に示すように、manifest.jsonファイルのassets/jsパラメーターとjs_classパラメーターを更新する必要があります。
ui/modules/lesson_gauge_chart/assets/js/class.widget.js
class WidgetLessonGaugeChart extends CWidget {

    static UNIT_AUTO = 0;
    static UNIT_STATIC = 1;

    onInitialize() {
        super.onInitialize();

        this._refresh_frame = null;
        this._chart_container = null;
        this._canvas = null;
        this._chart_color = null;
        this._min = null;
        this._max = null;
        this._value = null;
        this._last_value = null;
        this._units = '';
    }

    processUpdateResponse(response) {
        if (response.history === null) {
            this._value = null;
            this._units = '';
        }
        else {
            this._value = Number(response.history.value);
            this._units = response.fields_values.value_units == WidgetLessonGaugeChart.UNIT_AUTO
                ? response.history.units
                : response.fields_values.value_static_units;
        }

        this._chart_color = response.fields_values.chart_color;
        this._min = Number(response.fields_values.value_min);
        this._max = Number(response.fields_values.value_max);

        super.processUpdateResponse(response);
    }

    setContents(response) {
        if (this._canvas === null) {
            super.setContents(response);

            this._chart_container = this._body.querySelector('.chart');
            this._chart_container.style.height =
                `${this._getContentsSize().height - this._body.querySelector('.description').clientHeight}px`;
            this._canvas = document.createElement('canvas');

            this._chart_container.appendChild(this._canvas);

            this._resizeChart();
        }

        this._updatedChart();
    }

    onResize() {
        super.onResize();

        if (this._state === WIDGET_STATE_ACTIVE) {
            this._resizeChart();
        }
    }

    _resizeChart() {
        const ctx = this._canvas.getContext('2d');
        const dpr = window.devicePixelRatio;

        this._canvas.style.display = 'none';
        const size = Math.min(this._chart_container.offsetWidth, this._chart_container.offsetHeight);
        this._canvas.style.display = '';

        this._canvas.width = size * dpr;
        this._canvas.height = size * dpr;

        ctx.scale(dpr, dpr);

        this._canvas.style.width = `${size}px`;
        this._canvas.style.height = `${size}px`;

        this._refresh_frame = null;

        this._updatedChart();
    }

    _updatedChart() {
        if (this._last_value === null) {
            this._last_value = this._min;
        }

        const start_time = Date.now();
        const end_time = start_time + 400;

        const animate = () => {
            const time = Date.now();

            if (time <= end_time) {
                const progress = (time - start_time) / (end_time - start_time);
                const smooth_progress = 0.5 + Math.sin(Math.PI * (progress - 0.5)) / 2;
                let value = this._value !== null ? this._value : this._min;
                value = (this._last_value + (value - this._last_value) * smooth_progress - this._min) / (this._max - this._min);

                const ctx = this._canvas.getContext('2d');
                const size = this._canvas.width;
                const char_weight = size / 12;
                const char_shadow = 3;
                const char_x = size / 2;
                const char_y = size / 2;
                const char_radius = (size - char_weight) / 2 - char_shadow;

                const font_ratio = 32 / 100;

                ctx.clearRect(0, 0, size, size);

                ctx.beginPath();
                ctx.shadowBlur = char_shadow;
                ctx.shadowColor = '#bbb';
                ctx.strokeStyle = '#eee';
                ctx.lineWidth = char_weight;
                ctx.lineCap = 'round';
                ctx.arc(char_x, char_y, char_radius, Math.PI * 0.749, Math.PI * 2.251, false);
                ctx.stroke();

                ctx.beginPath();
                ctx.strokeStyle = `#${this._chart_color}`;
                ctx.lineWidth = char_weight - 2;
                ctx.lineCap = 'round';
                ctx.arc(char_x, char_y, char_radius, Math.PI * 0.75,
                    Math.PI * (0.75 + (1.5 * Math.min(1, Math.max(0, value)))), false
                    );
                ctx.stroke();

                ctx.shadowBlur = 2;
                ctx.fillStyle = '#1f2c33';
                ctx.font = `${(char_radius * font_ratio)|0}px Arial`;
                ctx.textAlign = 'center';
                ctx.textBaseline = 'middle';
                ctx.fillText(`${this._value !== null ? this._value : t('No data')}${this._units}`,
                    char_x, char_y, size - char_shadow * 4 - char_weight * 2
                );

                ctx.fillStyle = '#768d99';
                ctx.font = `${(char_radius * font_ratio * .5)|0}px Arial`;
                ctx.textBaseline = 'top';

                ctx.textAlign = 'left';
                ctx.fillText(`${this._min}${this._min != '' ? this._units : ''}`,
                    char_weight * .75, size - char_weight * 1.25, size / 2 - char_weight
                );

                ctx.textAlign = 'right';
                ctx.fillText(`${this._max}${this._max != '' ? this._units : ''}`,
                    size - char_weight * .75, size - char_weight * 1.25, size / 2 - char_weight
                );

                requestAnimationFrame(animate);
            }
            else {
                this._last_value = this._value;
            }
        };

        requestAnimationFrame(animate);
    }
}- manifest.json を開いて以下を追加します。
- ファイル名(class.widget.js)をassets/jsセクションの配列に追加します。
- クラス名(WidgetLessonGaugeChart)をwidgetセクションのjs_classパラメーターに追加します。
WidgetLessonGaugeChartクラスがダッシュボードとともに自動的に読み込まれるようになります。
ui/modules/lesson_gauge_chart/manifest.json
{
    "manifest_version": 2.0,
    "id": "lesson_gauge_chart",
    "type": "widget",
    "name": "Gauge chart",
    "namespace": "LessonGaugeChart",
    "version": "1.0",
    "author": "Zabbix",
    "actions": {
        "widget.lesson_gauge_chart.view": {
            "class": "WidgetView"
        }
    },
    "widget": {
        "js_class": "WidgetLessonGaugeChart"
    },
    "assets": {
        "js": ["class.widget.js"]
    }
}
CSSスタイルをウィジェットに追加
このセクションでは、カスタムCSSスタイルを追加してウィジェットをより魅力的に見せる方法を学びます。
-
ウィジェットスタイルの場合は、assetsディレクトリに新しいディレクトリcssを作成します。
-
assets/cssディレクトリにwidget.cssファイルを作成します。 ウィジェット要素のスタイルを設定するには、セレクターdiv.dashboard-widget-{widget id}を使用します。 ウィジェット全体のCSSを設定するには、セレクターform.dashboard-widget-{widget id}を使用します。
ui/modules/lesson_gauge_chart/assets/css/widget.css
div.dashboard-widget-lesson_gauge_chart {
    display: grid;
    grid-template-rows: 1fr;
    padding: 0;
}

div.dashboard-widget-lesson_gauge_chart .chart {
    display: grid;
    align-items: center;
    justify-items: center;
}

div.dashboard-widget-lesson_gauge_chart .chart canvas {
    background: white;
}

div.dashboard-widget-lesson_gauge_chart .description {
    padding-bottom: 8px;
    font-size: 1.750em;
    line-height: 1.2;
    text-align: center;
}

.dashboard-grid-widget-hidden-header div.dashboard-widget-lesson_gauge_chart .chart {
    margin-top: 8px;
}- manifest.jsonを開き、CSSファイル名(widget.css)をassets/cssセクションの配列に追加します。 これにより、widget.cssで定義されたCSSスタイルをダッシュボードページに読み込むことができるようになります。
ui/modules/lesson_gauge_chart/manifest.json
{
    "manifest_version": 2.0,
    "id": "lesson_gauge_chart",
    "type": "widget",
    "name": "Gauge chart",
    "namespace": "LessonGaugeChart",
    "version": "1.0",
    "author": "Zabbix",
    "actions": {
        "widget.lesson_gauge_chart.view": {
            "class": "WidgetView"
        }
    },
    "widget": {
        "js_class": "WidgetLessonGaugeChart"
    },
    "assets": {
        "css": ["widget.css"],
        "js": ["class.widget.js"]
    }
}- ダッシュボードページを更新して、ウィジェットの完成版を確認します。