
1 ダッシュボードウィジェット
概要
このセクションではダッシュボードウィジェットに共通するパラメーターの詳細を説明します。
共通パラメータ
次のパラメータは、すべてのウィジェットで共通です。
| 名前 | ウィジェット名を入力します |
| リフレッシュ間隔 | デフォルトの更新間隔を構成します。 ウィジェットのデフォルト更新間隔は、ウィジェットのタイプに応じてリフレッシュなしから15分の範囲です。 例:URLウィジェットの場合はリフレッシュなし、アクションログウィジェットの場合は 1分、時計ウィジェットの場合は15分 |
| ヘッダーを表示 | チェックボックスをオンにすると、ヘッダーが永続的に表示されます。 チェックを外すと、スペースを節約するためにヘッダーが非表示になり、表示モードと編集モードの両方で、マウスをウィジェット上に置くと上にスライドして表示されます。 ウィジェットを新しい場所にドラッグするときにも半透明になります。 |
ウィジェットの更新間隔は、対応するすべてのユーザーのデフォルト値に設定できます。また、各ユーザーは独自の更新間隔値を設定できます。
- 対応するすべてのユーザーのデフォルト値を設定するには、編集モードに切り替え([ダッシュボードの編集]ボタンをクリックして適切なウィジェットを見つけ、[編集]ボタンをクリックしてウィジェットの編集フォームを開きます)更新間隔をドロップダウンリストから選択します。
- 表示モードでは、特定のウィジェットの
 ボタンをクリックすることにより、ユーザーごとに一意の更新間隔を個別に設定できます。
ユーザーが設定した一意の更新間隔は、ウィジェットの設定よりも優先され、一度設定すると、ウィジェットの設定が変更されても常に保持されます。
各ウィジェットの特定のパラメーターを確認するには、以下の個々のウィジェットページにアクセスしてください。
- アクションログ
- 時刻
- ディスカバリのステータス
- お気に入りグラフ
- お気に入りのマップ
- 地理マップ
- グラフ
- グラフ (クラシック)
- グラフのプロトタイプ
- ホスト稼働状況
- アイテムの値
- マップ
- マップナビゲーション
- プレーンテキスト
- 障害中のホスト
- 障害
- SLA レポート
- システム情報
- 深刻度ごとの障害数
- 上位ホスト
- トリガーの概要
- URL
- Web 監視
Dynamic parameters
Multiple widgets have parameters that enable them to share configuration data between other widgets or the dashboard.
Host groups, Hosts, Item, Item list
The Host groups, Hosts, Item, and Item list parameters allow selecting either the respective entities or a data source containing either host groups, hosts or items for which the widget can display data.
For Host groups, Item, and Item list parameters, the data source can be a compatible widget from the same dashboard.
For Hosts parameter, the data source can be a compatible widget from the same dashboard or the dashboard itself.
The Map widget can also broadcast host group and host data to compatible widgets. For more information, see Widget behavior.
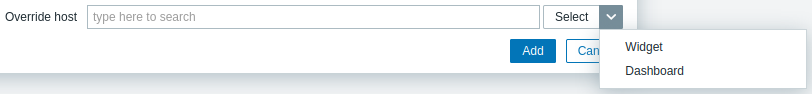
Override host
The Override host parameter allows selecting a data source containing a host for which the widget can display data. The data source can be a compatible widget from the same dashboard or the dashboard itself.
-
To specify a compatible widget, enter its name and select it. Alternatively, click the Select button (or the dropdown button, then "Widget") to open a pop-up of available widgets.
-
To specify a dashboard, click the dropdown button, then "Dashboard". After saving the dashboard, the Host field (for selecting hosts) will appear at the top of the dashboard.

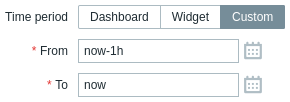
Time period
The Time period parameter allows selecting a data source containing a time period for which the widget can display data. The data source can be a compatible widget from the same dashboard, the dashboard itself, or the time period configured on the widget itself.
-
To specify a compatible widget, set Time period to "Widget", enter its name and select it. Alternatively, click the Select button to open a pop-up of available widgets.
-
To specify a dashboard, set Time period to "Dashboard". After saving the dashboard, the Time period selector will appear at the top of the dashboard.
-
To configure the time period on the widget itself, set Time period to "Custom" and enter or select the start and end of the time period.
Regardless of the widget's Time period configuration, compatible widgets can use it as a data source for the time period.
Widget behavior
Widgets differ in how they broadcast data to other widgets.
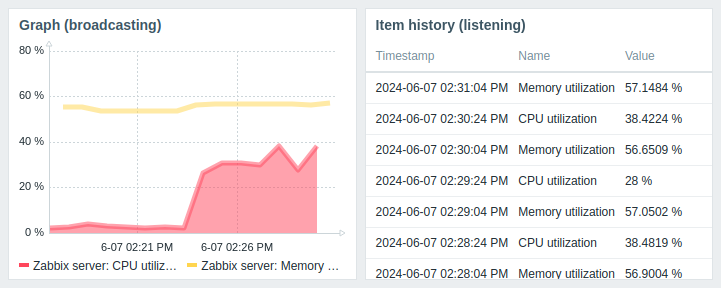
All widgets capable of broadcasting data begin doing so automatically upon creation. For example, the Graph widget immediately broadcasts time period data to listening widgets.
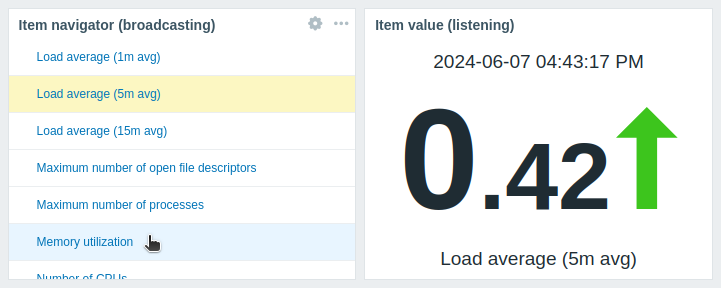
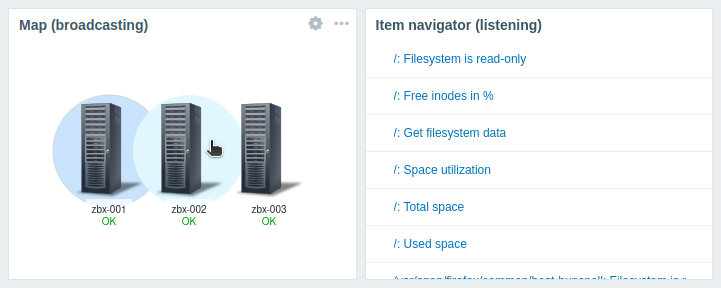
Widgets supporting entity selection (e.g., Item navigator) automatically broadcast data for the first available entity. For example, the Item navigator widget broadcasts data for the first item in its item list. When a different item is selected, it broadcasts data for that item. On mouseover, the item is highlighted in light blue color; on selection, it is highlighted in yellow color.
The Map widget also automatically broadcasts data for the first available element (e.g., host), which is closest to the top-left corner of the widget's viewport (for Geomap widget, closest to the center of the widget's viewport). When a different element is selected, it broadcasts data for that element. On mouseover, the element is highlighted in light blue color; on selection, it is highlighted in dark blue color.
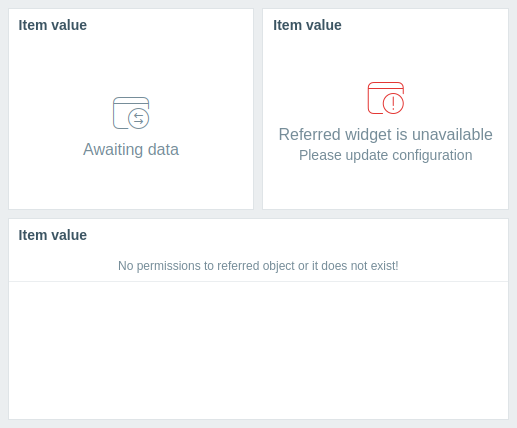
Widgets also have specific behaviors when listening for data from other widgets:
- If the data source widget is not broadcasting data, the listening widget enters the Awaiting data state.
- If the data source widget has been deleted, replaced with an incompatible widget, or moved to another dashboard page, the listening widget enters the Referred widget is unavailable state.
- If the specified host in the data source (widget or dashboard) lacks the entity configured in the listening widget (item, graph, map, etc.) or if the user lacks permissions to access the host, the listening widget displays the following message: "No permissions to referred object or it does not exist!"
For the broadcasting and listening capabilities of each widget, see Widget compatibility.
Widget compatibility
Some widgets can broadcast configuration data to other widgets, some can listen for data, and some can do both. For example:
- The Action log widget can only retrieve time period data from Graph, Graph (classic), and Graph prototype widgets.
- The Geomap widget can broadcast host data to widgets that listen for it (Honeycomb, Top items, etc.) and can also listen for host group and host data from widgets that broadcast it (Honeycomb, Problem hosts, etc.).
- The Clock widget cannot broadcast or listen for any data.
The following table outlines the broadcasting and listening capabilities of each widget.
| Widget | Broadcasts | Listens |
|---|---|---|
| Action log | - | Time period |
| Clock | - | - |
| Discovery status | - | - |
| Favorite graphs | - | - |
| Favorite maps | - | - |
| Gauge | - | Hosts, Items |
| Geomap | Hosts | Host groups, Hosts |
| Graph | Time period | Time period, Items, Hosts |
| Graph (classic) | Time period | Hosts, Items, Graphs, Time period |
| Graph prototype | Time period | Hosts, Time period |
| Honeycomb | Hosts, Items | Host groups, Hosts |
| Host availability | - | Host groups |
| Host card | - | Hosts |
| Host navigator | Hosts | Host groups |
| Item history | Items | Hosts, Time period |
| Item navigator | Items | Host groups, Hosts |
| Item value | - | Hosts, Items, Time period |
| Map | Host groups, Hosts | Maps |
| Map navigation tree | Maps | - |
| Pie chart | - | Time period, Items |
| Problem hosts | Host groups | Host groups, Hosts |
| Problems | Events | Host groups, Hosts |
| Problems by severity | Host groups | Host groups, Hosts |
| SLA report | - | - |
| System information | - | - |
| Top hosts | Hosts | Host groups, Hosts |
| Top items | - | Host groups, Hosts |
| Top triggers | - | Time period |
| Trigger overview | - | Host groups, Hosts |
| URL | - | Hosts |
| Web monitoring | Host groups | Host groups, Hosts |