
8 ブラウザアイテムでウェブサイトの監視
はじめに
このページでは、ブラウザアイテムを使用してウェブサイトの基本的な監視を開始するために必要な手順について説明します。
このガイドの対象者
このガイドは、Zabbixを初めて使用するユーザー向けに設計されており、ブラウザアイテムを使用してウェブサイトの基本的な監視を行うために必要な最小限の手順が記載されています。 より詳細なカスタマイズオプションや、より高度な設定が必要な場合は、Zabbixマニュアルのブラウザアイテムページまたは設定セクションをご覧ください。
前提条件
このガイドを進める前に、お使いのOSの手順に従って、ZabbixサーバーとZabbixフロントエンドをダウンロードしてインストールする必要があります。
このガイドは、以下の環境に基づいています。
- Zabbixバージョン: 7.2 (パッケージからインストール)
- OSディストリビューション: Ubuntu
- OSバージョン: 22.04 (Jammy)
- Zabbixコンポーネント: サーバー、フロントエンド、エージェント
- データベース: MySQL
- Webサーバー: Apache
WebDriver の設定
ブラウザアイテムには、ブラウザを制御および操作し、ボタンのクリックやテキストの入力などのテストコマンドを実行する Web テストエンドポイントとして、自動化フレームワーク(Selenium Server または ChromeDriver などのプレーン WebDriver)が必要です。
例として、このガイドでは Docker コンテナ内で Selenium Server と Chrome を使用します。
Docker は既に設定されていることを前提としています。このガイドでは Docker の設定については説明しません。 インストール手順については、Ubuntu への Docker Engine のインストール を参照してください。
- 以下のオプションを使用して、Docker コンテナ内で Selenium Server と Chrome を起動します。
- docker run --name browser - 「browser」という名前の新しい Docker コンテナを実行します。
- -p 4444:4444 - ホストマシンのポート4444をコンテナのポート4444にマッピングします(これはSelenium Serverがコマンドを受け入れるために使用するポートです)。
- -p 7900:7900 - ホストマシンのポート7900をコンテナのポート7900にマッピングします(これはVirtual Network Computing(VNC)サーバーが使用するポートで、ブラウザのGUIをリモートで表示できます。VNCクライアントが必要です)。
- --shm-size="2g" - コンテナに2GBの共有メモリを割り当てます(これはChromeが正常に動作するために重要です。Chromeはクラッシュを回避するために大量の共有メモリを必要とする場合があります)
- -d - コンテナをデタッチモードで実行します。つまり、バックグラウンドで実行されます。
- selenium/standalone-chrome:latest - 使用するDockerイメージを指定します。この場合は、Selenium Server with Chrome の最新バージョンです。
docker run --name browser \
-p 4444:4444 \
-p 7900:7900 \
--shm-size="2g" \
-d selenium/standalone-chrome:latest
2. browser Docker コンテナが実行中でアクセス可能であることを確認します。
- コンテナのIPアドレスを取得します(この例では192.0.2.1)
ip addr

# 1: lo: <LOOPBACK,UP,LOWER_UP>
# ...
# 3: docker0: <NO-CARRIER,BROADCAST,MULTICAST,UP> ...
# inet 192.0.2.1/16 brd 192.0.255.255 スコープ global docker0
# ...- Ncat を使用してコンテナへの接続をテストします。
nc -zv 192.0.2.1 4444

# 192.0.2.1 4444 ポート [tcp/*] への接続に成功しました!- curl を使って、Selenium Server からウェブページのコンテンツを取得します。
curl -L 192.0.2.1:4444

# <!DOCTYPE html>
# <html lang="en">
#
# <head>
# <meta charset="utf-8"/>
# <link href="favicon.svg" rel="icon" type="image/svg">
# <meta content="width=device-width, initial-scale=1" name="viewport"/>
# <link href="logo192.png" rel="apple-touch-icon"/>
# <link href="manifest.json" rel="manifest"/>
# <title>Selenium Grid</title>
# </head>
#
# <body>
# ...トラブルシューティングについては、Docker ドキュメント を参照してください。
Zabbix サーバーの設定
ブラウザアイテムは、ブラウザポーラー Zabbix プロセスによって実行・処理されます。このプロセスは、StartBrowserPollers サーバー設定パラメータを調整して有効化する必要があります。 さらに、WebDriverURL パラメータには、事前に設定した Web テストエンドポイントを指定する必要があります。
デフォルトでは、StartBrowserPollers パラメータは 1 に設定されているため、Web テストエンドポイントのみを指定する必要があります。
1. Zabbix サーバー設定ファイルを開きます。
vi /etc/zabbix/zabbix_server.conf2. Zabbixサーバー設定ファイルでWebDriverURLパラメータを探して設定します。
### Option: WebDriverURL
#   WebDriver interface HTTP[S] URL. For example http://localhost:4444 used with Selenium WebDriver standalone server.
#
# Mandatory: no
# Default:
# WebDriverURL=

WebDriverURL=192.0.2.1:4444
3. Zabbixサーバーを再起動します。
systemctl restart zabbix-serverZabbix フロントエンドの設定
1. Zabbix フロントエンドにログインします。
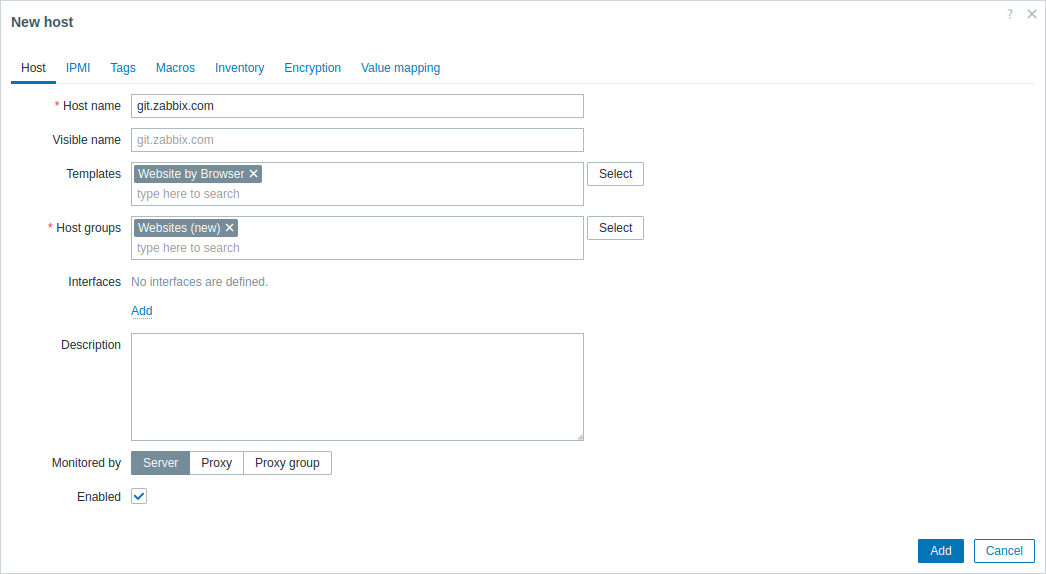
2. Zabbix Web インターフェースで ホストを作成 します。
- ホスト名 フィールドにホスト名を入力します (例: git.zabbix.com)
- テンプレート フィールドに"Website by Browser"テンプレートを入力または選択します。このテンプレートの詳細については、Website by Browser を参照してください。
- ホストグループ フィールドにホストグループを入力または選択します (例: 新しいホストグループ"Websites")
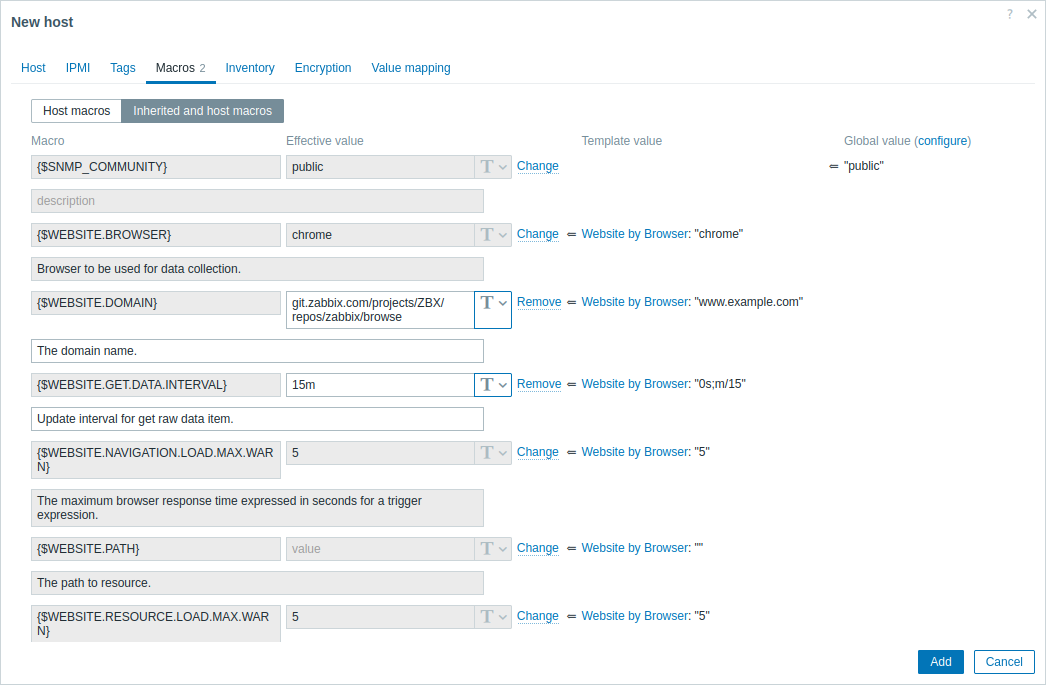
- マクロ タブで 継承およびホストマクロ に切り替え、以下のマクロを探し、マクロ値の横にある 変更 をクリックして更新します。
- {$WEBSITE.DOMAIN} - ドメイン名(例:git.zabbix.com/projects/ZBX/repos/zabbix/browse)
- {$WEBSITE.GET.DATA.INTERVAL} - アイテムデータの更新間隔(例:15分)
3. 追加 ボタンをクリックしてホストを作成します。このホストは、監視対象のウェブサイトを表します。
収集されたメトリクスの表示
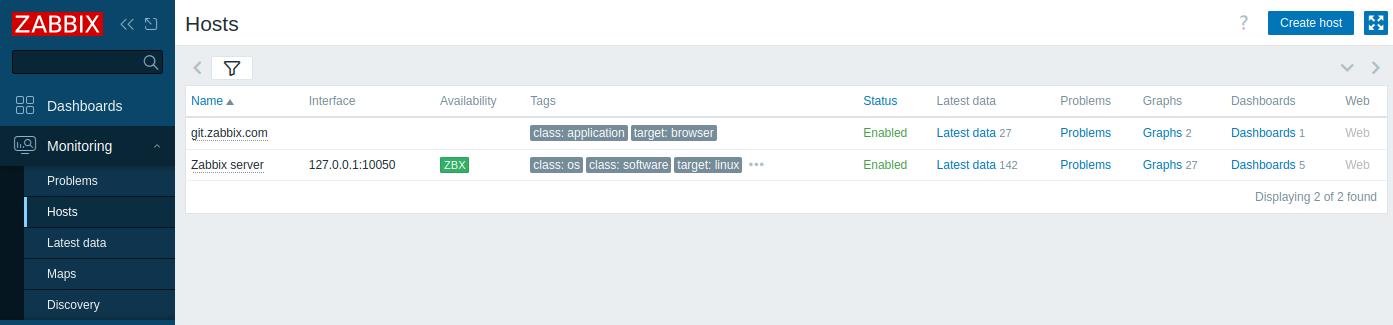
おめでとうございます!この時点で、Zabbix は指定したウェブサイトをすでに監視しています。
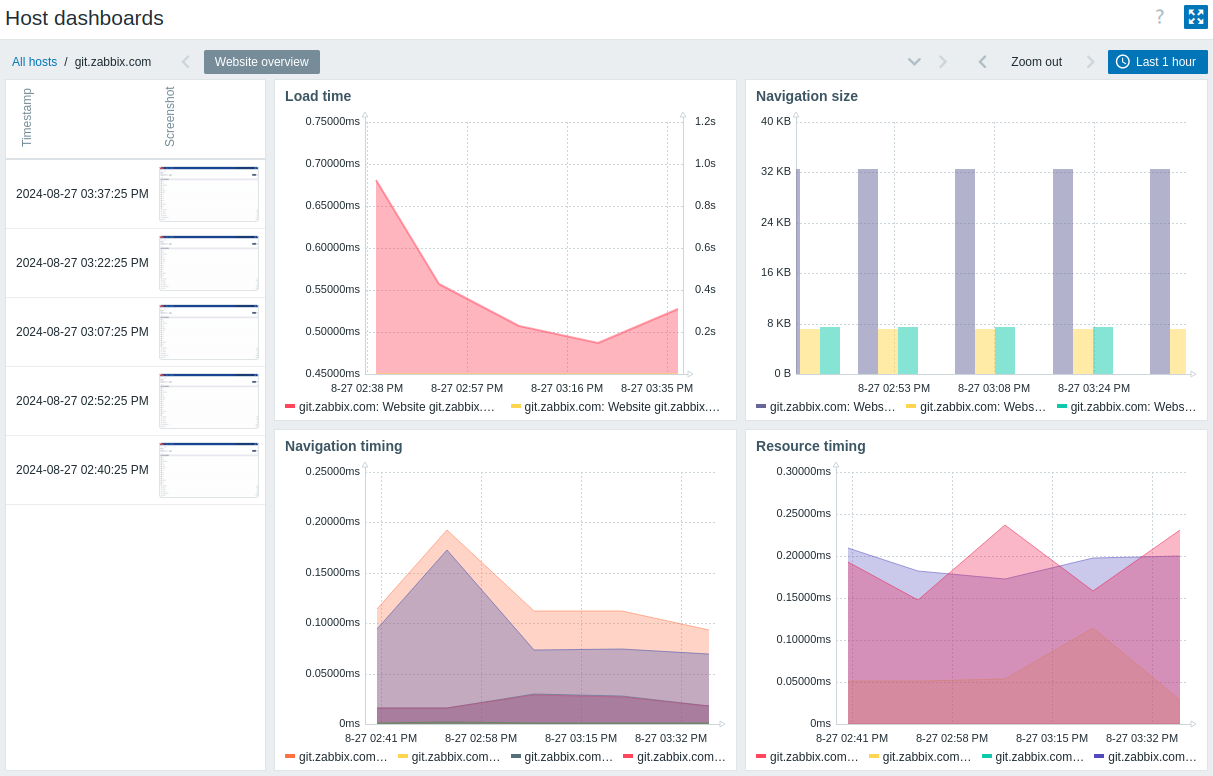
収集されたメトリクスを表示するには、監視 → ホスト メニューセクションに移動し、ホストの横にある ダッシュボード をクリックします。
この操作により、ウェブサイトから収集された最も重要なメトリクスを含むホストダッシュボード(テンプレートレベルで設定)が表示されます。
問題アラートの設定
Zabbixは、様々な方法でインフラストラクチャの問題を通知できます。
このガイドでは、メールアラートを送信するための基本的な設定手順を説明します。
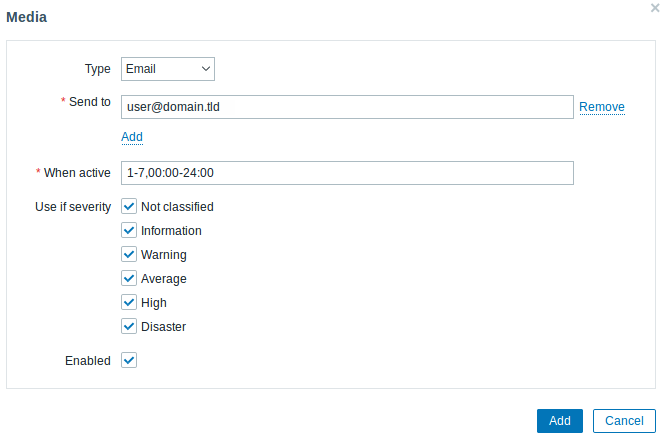
- ユーザー設定 → プロファイルに移動し、メディアタブに切り替えてメールアドレスを追加します。
- 問題通知の受信のガイドに従います。
次回以降、Zabbixが問題を検出すると、メールでアラートが届くようになります。
設定をテストする
設定をテストするには、Zabbix フロントエンドでホスト設定を更新することで、実際の問題をシミュレートできます。
1. Zabbix でウェブサイトのホスト設定を開きます。
2. マクロ タブに切り替えて、継承されたホストマクロ を選択します。
3. 例えば、以前に設定した} マクロ値の横にある 変更 をクリックし、正しいドメイン名(例:/git.zabbix.com/projects/ZBX/repos/zabbix/browse)を設定します。
4. 更新 をクリックして、ホスト設定を更新します。
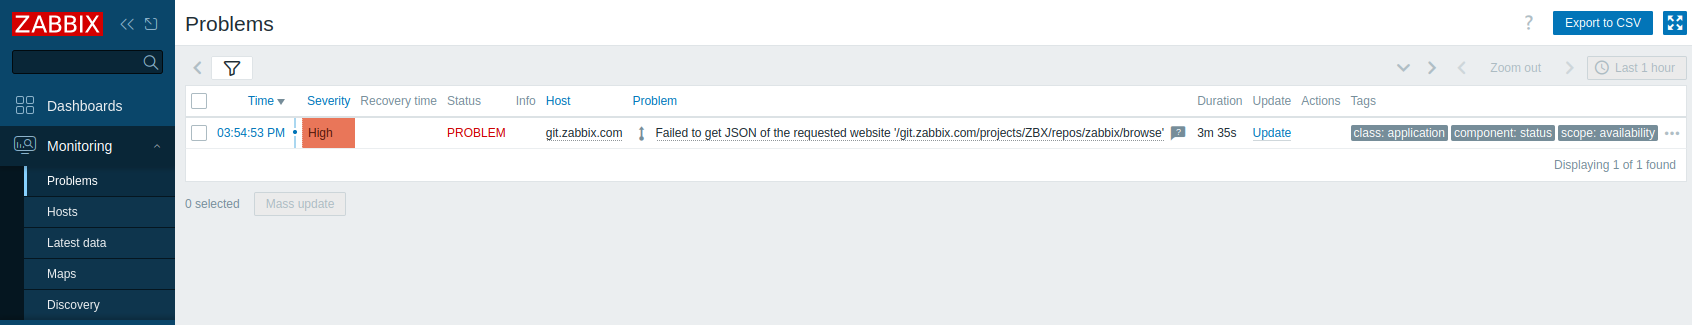
5. しばらくすると、Zabbix は指定されたウェブサイトに接続できないため、"要求されたウェブサイトの JSON を取得できませんでした"という問題を検出します。 問題はモニタリング → 問題に表示されます。
アラートが設定済みの場合は、問題通知も受信します。
6. マクロの値を以前の値に戻して問題を解決し、ウェブサイトの監視を継続します。
参照
- アイテムの作成 - 追加メトリックの監視を開始する方法
- 問題のエスカレーション - 複数ステップのアラートシナリオを作成する方法 (例: まずシステム管理者にメッセージを送信し、45分以内に問題が解決しない場合はデータセンター管理者にメッセージを送信する)
- ブラウザアイテム - ブラウザアイテムの設定方法
- テンプレート Website by Browser - Website by Browser テンプレートに関する追加情報