
- 5 What's new in Zabbix 3.0.0
- New web interface
- Encryption support
- Predictive trigger functions
- SMTP authentication options
- Item checking at specific times
- Custom parameter support for alert scripts
- Private maps, screens and slide shows
- Exporting and importing value maps
- Dependencies between trigger prototypes
- Multiple OID support in SNMP discovery
- Linking to applications based on discovery values
- Graph improvements
- Resolution of user macros made transparent
- Automated selection of host inventory mode
- Bulk acknowledgement made more flexible
- VMware monitoring improvements
- Context support in user macros
- Running Zabbix daemons in foreground
- Frontend improvements
- Daemon improvements
- Forced housekeeper execution
- Configuration parameters
- Performance improvements
- Value cache improvements
- Zabbix agent crash log on Windows platforms
- TCP connection timeout on Windows platforms
- Support for IPv6 addresses in Java gateway
- Proxy configuration size increase
- Logging IP addresses of incoming/outgoing connections between Zabbix server and Zabbix proxy
- Database recovery message on DebugLevel=2
- Host availability improvements
- Support for multiple escalators
- Printing defaults with --help option
- Dropping Inetd Zabbix agent
- History cache improvements
- Action and action condition caching
- Item changes/improvements
- Function improvements
- Macro improvements
- Commandline utility improvements
- API improvements
- Miscellaneous improvements
- See also
5 What's new in Zabbix 3.0.0
New web interface
Zabbix 3.0 comes with a completely new frontend design.
Along with visual improvements, there are several other changes for working with the frontend:
- For accessing the second-level menu, top level options (Monitoring, Inventory, Reports, etc) have actually to be clicked (previously a mouseover was enough)
- Configuration → Maps | Screens | Slide shows is not available any more. Instead, all configuration options for these entities have been moved to Monitoring → Maps and Monitoring → Screens
- Users section has been split into User groups and Users
- Audit and Notifications sections have been moved out of Administration and into Reports. Additionally, Audit has been split into Audit and Action log sections.
Encryption support
Network communications between Zabbix components (server, proxies,
agents and command-line utilities) can now be encrypted if Zabbix is
compiled with mbed TLS (PolarSSL), GnuTLS or OpenSSL library.
Details are specified with new TLS parameters in daemon configuration files for Zabbix server, Zabbix proxy, Zabbix agent, Zabbix Windows agent and new commandline options for zabbix_get and zabbix sender.
RSA certificates or pre-shared key (PSK) can be configured and used for encryption per host and proxy.
For more information, see the Encryption section.
Predictive trigger functions
Predictive capabilities are now available via forecast() and timeleft() trigger functions. These functions analyse item history and return the future value of the item or time in which the item value reaches a threshold respectively. They can be used in calculated items, trigger expressions and notifications to act in advance and avoid potential problems instead of waiting for them to happen and eliminating consequences afterwards. For more information, see:
- Predictive trigger functions
- Supported trigger functions (entries for 'forecast' and 'timeleft')
SMTP authentication options
Configuring e-mail as a media type for sending notifications has been extended with new SMTP authentication options. It is also possible now to specify the server port other than the hardcoded 25 before.
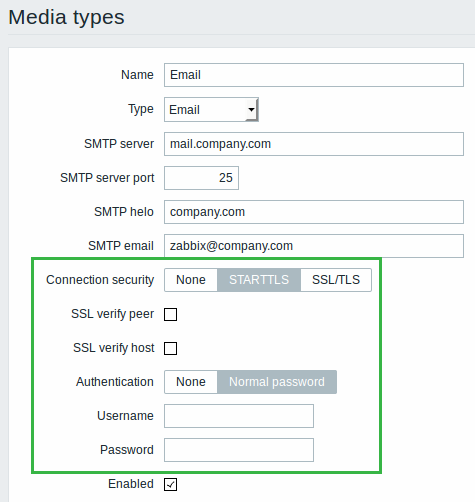
See e-mail configuration for more details.
Item checking at specific times
Item checking so far in Zabbix has centered around the concept of interval only. There has been the default update interval and the ability of specifying flexible update intervals. However, checking an item at a specific time and date - that was not previously supported.
In the new version flexible intervals have been supplemented with a new Scheduling format where item checking can be defined for specific time points.

In the example above item checking will take place at 8:59.59 on the 1st day of the month if it is a Monday.
When configuring an item, both flexible interval and scheduling formats are available under a new option called Custom intervals.
Custom parameter support for alert scripts
In previous Zabbix versions three hard-coded parameters were passed to custom alert scripts - Send to, Subject and Message.
Now users can define their own command-line parameters for the script in the media type configuration form:
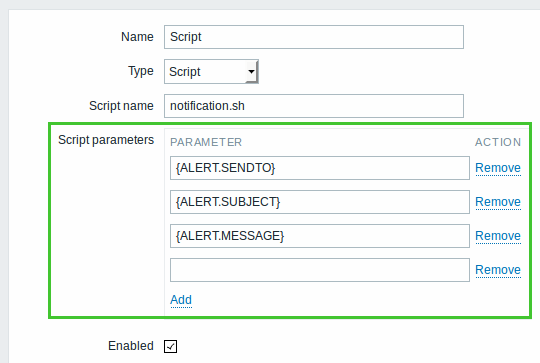
Additionally, three new macros are supported in parameter fields - {ALERT.SENDTO}, {ALERT.SUBJECT} and {ALERT.MESSAGE}, resolving to recipient, message subject and message body respectively.
For more details, see:
Private maps, screens and slide shows
All users in Zabbix (including non-admin users) can now create network maps, screens and slide shows. To enable that, the functionality for managing these entities has been moved out of the Configuration menu and into the Monitoring menu. Additionally, the minimum access rights to maps, screens and slide shows (and to adding elements to them) has been lowered from read-write to read permissions.
Maps, screens and slide shows can now be private or public. The public ones can be accessed by all users, while the private ones can be accessed by its owner (creator) and all users the entity has been shared with. There is a new Sharing tab in map/screen/slide show configuration for that purpose.
For more details, see:
- Managing maps
- Managing screens
- Configuring a network map
- Configuring a screen
- Configuring a slide show
Exporting and importing value maps
Support for exporting the configured value mappings together with exported hosts and templates has been implemented.
When importing value mappings, the rules provide options to create new and update existing value mappings from XML.
Value mappings can also be imported/exported separately.
Usage in items column
When viewing configured value mappings, there is a useful new column displaying whether the value mapping is used in any items.

Dependencies between trigger prototypes
While defining trigger dependencies has been a Zabbix feature for a long time, doing the same for trigger prototypes (defined in low-level discovery) was previously not possible.
Following a popular request, ability to define dependencies has now been implemented for trigger prototypes as well. To define dependencies you go to the Dependencies tab in the trigger prototype form (similarly as for real triggers).
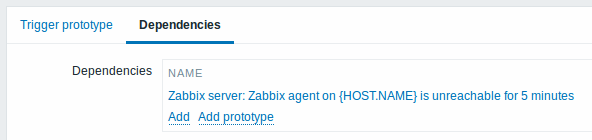
A trigger prototype may depend on another trigger prototype from the same low-level discovery (LLD) rule or on a regular trigger.
A trigger prototype may not depend on a trigger prototype from a different LLD rule or on a trigger created from trigger prototype. Host trigger prototype cannot depend on a trigger from a template.
Performance improvements
The processing of trigger prototypes has been optimized by reducing the number of SQL statements. As a result, the process of creating triggers takes only half of the time as before.
Multiple OID support in SNMP discovery
SNMP discovery has been improved to support discovery of multiple OIDs. The discovery SNMP OID now is specified by using the following format:
discovery[{#MACRO1}, oid1, {#MACRO2}, oid2, ...]The discovered OIDs are grouped by their indexes to produce entities with {#MACRO1}, {#MACRO2} ... macros set to corresponding OID values and {#SNMPINDEX} macro set to corresponding OID index.
For more information, see low level discovery documentation.
Linking to applications based on discovery values
To help with logical grouping of items created from item prototypes by low-level discovery (LLD), it is now possible to assign the discovered items to applications that are based on the values of LLD macros.
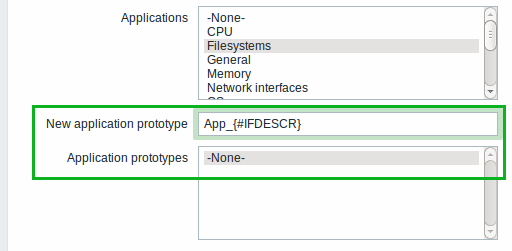
In addition to the options for linking to regular applications, a new option for creating application prototypes has been added to item prototype definition. Discovered items are linked to the applications created based on application prototypes.
Graph improvements
Better zoom
In previous versions the shortest period you could zoom into was one hour. Now this limit has been lowered significantly to one minute.
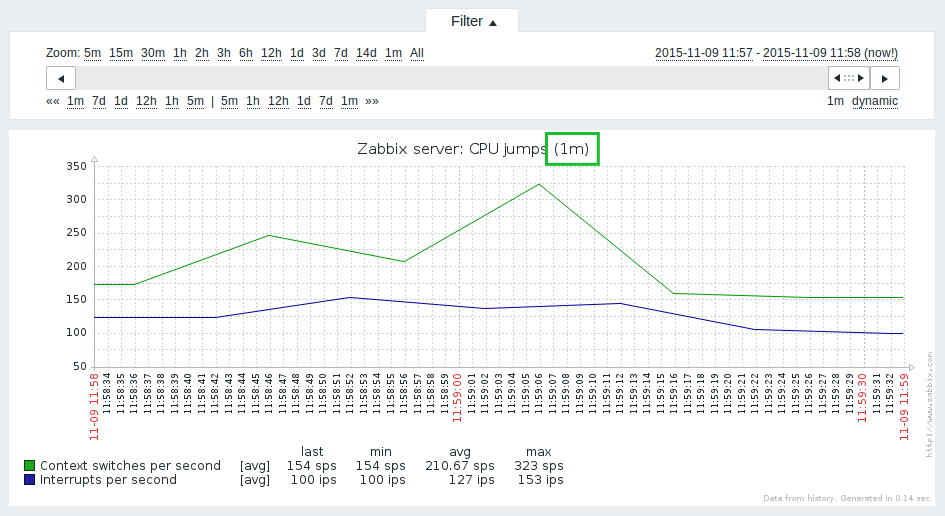
Predefined options in the time period selector now include such periods as 5 minutes, 15 minutes and 30 minutes.
Graphing log items
Log items (log, logrt, and eventlog) and item prototypes can
now be saved with any type of information
(not only "Log"), in line with the possibilities offered by the optional
output parameter. It means that log items could also be saved with
type of information set to integer ("Numeric (unsigned)"), and thus be
graphed.
Miscellaneous
- ISO date format of yyyy-mm-dd hh:mm:ss used
Several improvements focus on better readability of labels in graphs, especially large graphs showing data for several years:
- A change of year is clearly displayed on the X axis, with year always highlighted in red
- New time divisions used:
<!-- --> * 1 month as main interval and 15 days as sub-interval
* 1 year as main interval and 1/3/4/6 month(s) as sub-intervals
* 5 years as main interval and 1 year as sub-interval
* 10 years as main interval and 2 years as sub-interval
* 15 years as main interval and 3 years as sub-interval
* 20 years as main interval and 5 years as sub-interval
* 30 years as main interval and 10 years as sub-interval
* 40 years as main interval and 20 years as sub-interval
* 60 years as main interval and 30 years as sub-interval
* 80 years as main interval and 40 years as sub-interval
* Overall, the density of intervals displayed on X axis labels has been decreased by 8%Resolution of user macros made transparent
In previous Zabbix versions there was no easy way to determine what a user macro might resolve to, keeping in mind that user macros could be defined on host, template and global level.
The task could get even more complicated if macros in several levels of linked templates were used or in ambiguous cases when the same macro was defined in several same-level templates.
To make the resolution of macros transparent, there is now a new option in host and template configuration forms with macro resolution details. To see it you go to the Macros tab and select the Inherited and host macros option. That is where all defined user macros are displayed with the value they resolve to as well as their origin.
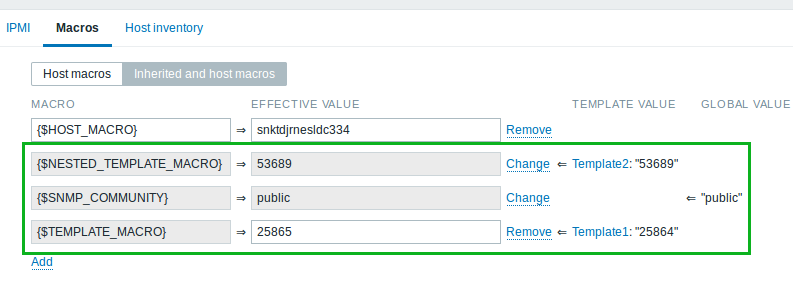
For convenience, links to respective templates and global macro configuration are provided. It is also possible to edit a template/global macro on the host level, effectively creating a copy of the macro on the host.
Automated selection of host inventory mode
In previous Zabbix versions all hosts were created with disabled host inventory by default and the only way to change that was through the properties of each individual host. The new Zabbix version comes with two new automated ways of selecting host inventory mode.
First, a Default host inventory mode option is added in Administration → General → Other. This options allows to customise which inventory option is selected by default for new hosts.
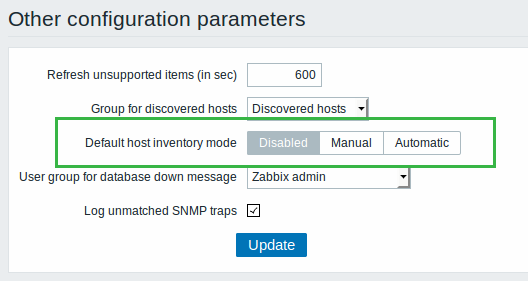
There is also a new action operation for host discovery/auto registration, in which you may choose between manual and automatic inventory modes for discovered hosts.
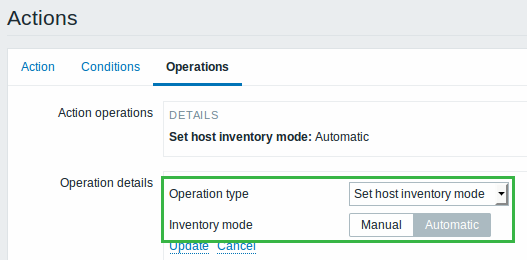
This operation overrides the Administration → General setting mentioned above.
Bulk acknowledgement made more flexible
In previous Zabbix versions, when bulk acknowledging problems, all unacknowledged events for the problem would be acknowledged. That imposed certain limitations, for example, you could not add a second acknowledgement message as all events were deemed acknowledged.
In Zabbix 3.0 you have more flexible options when using bulk acknowledgement. You may choose to acknowledge only the selected event, or all problems events as well, or all events for the problem. It is also possible to add several messages in bulk acknowledgement mode now.
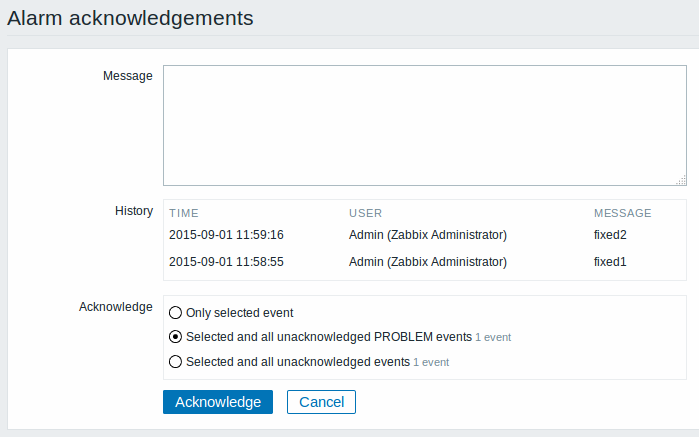
Another improvement sees increased performance for bulk acknowledgement of a large number of events - with events in hundreds of thousands or more, bulk acknowledgement should take place within several minutes at most.
VMware monitoring improvements
A new simple check to monitor VMware virtual machine CPU ready state was added. For more information see VMware monitoring item keys.
Context support in user macros
An optional context can be specified in user macros -
{$MACRO:context}. This allows to override the default macro value by a
context specific one. If there are no values defined for the specified
macro context then macro will resolve to its default value (the one
defined for the same macro without context).
For more information, see user macros documentation.
Running Zabbix daemons in foreground
Zabbix daemons now accept an -f (--foreground) command line option
to run in foreground. To redirect Zabbix logs to standard output when
running in foreground set LogType configuration parameter to
console.
Frontend improvements
Dropping IE8 support
Support for Microsoft Internet Explorer 8 will not be provided anymore.
Showing trigger description in Dashboard
Trigger description is now displayed in the popup when clicking on Issue in the Last 20 issues widget. This popup already displayed trigger events in previous versions. Now the description field is added, above trigger events.
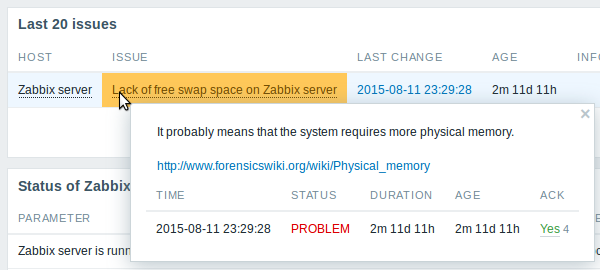
Displaying trigger description is very useful in cases when it can provide clues to resolving the problem. The description field has a maximum size and will be scrollable if the text is larger than the field. URLs within the description are clickable. Moreover, trigger URLs, if available are also displayed.
Trigger description is also displayed in Host issues and Host group issues screen elements.
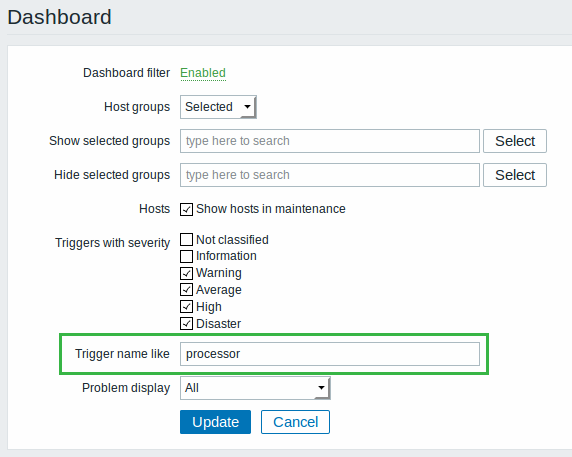
Filtering options
Filtering options across several frontend sections have been improved further.
Dashboard filtering by trigger name
When using the Dashboard filter, it is now possible to enter a string limiting the number of triggers displayed in the System status, Host status and Last 20 issues widgets.
Maps, screens, slide shows
Map, screen and slide show listings can now be filtered by name.

Triggers top 100
A much larger filter has been added to the Triggers top 100 report.
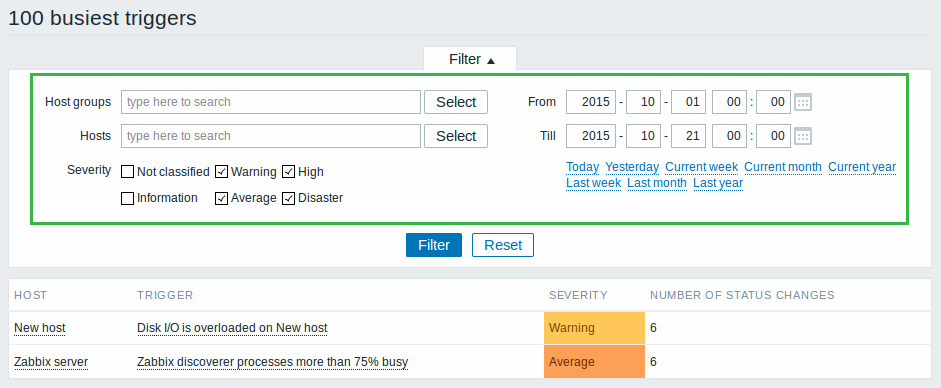
While previously it was only possible to filter here by some predefined time period, now you may filter by host group, host, trigger severity, predefined time period and custom time period.
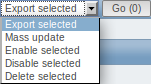
Mass editing buttons instead of dropdown
Options for mass-editing of entities in lists are now displayed as buttons. The previous option of a dropdown selection and then having to click on Go has been removed. It is expected that reinstating buttons will make it much quicker and easier to use these operations.
| Previous version: |
 |
| Zabbix 3.0: | 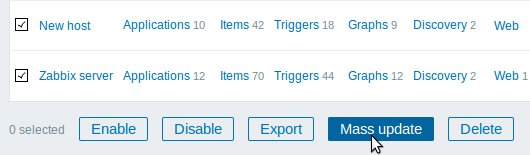 |
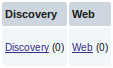
Zeroes not displayed
Zeroes are not displayed any more in lists for entities with no items. Whereas previously a (0) would be displayed next to the entity in a table column, now nothing is displayed.
| Previous version: |
 |
| Zabbix 3.0: |  |
User agent options in web monitoring
In web scenario definition it is now possible to select a 'Zabbix' user agent. That may be useful for filtering out requests coming from Zabbix in web server access log files. The 'Zabbix' agent now is the default choice for the frontend and API, unless specified otherwise.
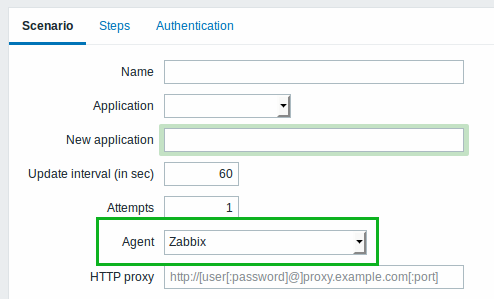
Note that when selecting the 'other' option for user agent now, an additional field is opened allowing to enter the string.
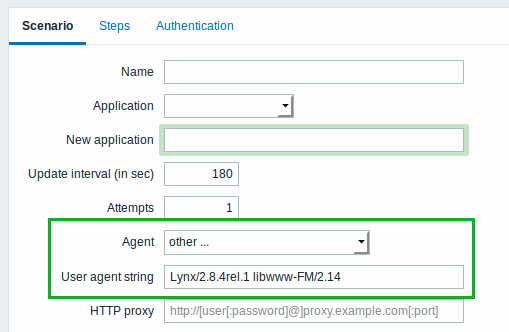
Additionally, the user agent list now contains updated browser versions.
Updated translations
- Czech
- English (United States)
- French
- Italian
- Japanese
- Korean
- Polish
- Portuguese (Brazil)
- Russian
- Slovak
- Ukrainian
These languages are available in Zabbix frontend. Other languages are disabled and are not available to be selected as their translation level has dropped below 75%.
XML import/export
It is now possible to import/export the Clock screen element with a "Host time" option.
Value mapping improvements
Value mapping setting "Host status" in Administration → General → Value mapping has been updated and renamed to "Host availability". This value now supports 3 host states by default:
*0 ⇒ not available
*1 ⇒ available
*2 ⇒ unknown
and matches the value of internal
check item
zabbix[host,<type>,available].
Miscellaneous improvements
- Value mappings can now also be cloned similarly to other frontend entities.
- Switching inventory mode in the host mass update form will no longer refresh the whole form.
- Translation of the byte unit prefixes - K for kilobytes, M for megabytes, etc. - has been removed because the "bytes" unit was not translated.
- Spaces, tabulation and multiple lines can now be used in IP ranges in network discovery and action conditions (e.g., "192.168.0.0/24, 192.168.1.0/24").
- The Dashboard Last 20 issues widget as well as "Host issues" and "Host group issues" screen elements now display all hosts from trigger expression.
- A table header has been added to the user media listing. Entries from the list can be deleted using the Remove link, rather than having to mark check-boxes and then click on Delete selected. Check-boxes have been removed.
Daemon improvements
Forced housekeeper execution
An additional runtime control option (housekeeper_execute) has been added to Zabbix server and Zabbix proxy to support manual housekeeping procedure execution. In this case the period of outdated history deleted in one housekeeping cycle will be 4 times the period since the last housekeeping cycle, but not less than 4 hours and not greater than 4 days.
The automatic housekeeping procedures can now be disabled by setting the configuration file HousekeepingFrequency parameter to zero.
Configuration parameters
Default configuration files have been changed to improve security and usability.
- DBUser has been changed to zabbix for proxy and server
- Default value for MaxHousekeeperDelete has been increased from 500 to 5000 for server
- LogSlowQueries has been increased from 0 to 3000 for proxy and server
- Timeout has been increased from 3 to 4 seconds for proxy and server
- Default value for MaxLinesPerSecond has been decreased from 100 to 20 for agent
- Prohibited characters have been listed for UnsafeUserParamaters
- It is possible to disable automatic housekeeping by setting HousekeepingFrequency to 0
- It is possible now to set DebugLevel=5 in server, proxy and agent configuration files. Previously it could be done using runtime control options only.
- A new LogType configuration parameter has been added for server,
proxy, agent and Windows agent. This parameter accepts the following
values:
- file (default) - write log messages to file configured by the LogFile parameter
- system - write log messages to syslog (Unix-like systems) or eventlog (Windows)
- console - write log messages to standard output (valid only when running in foreground mode)
- See also important upgrade notes
- HistoryIndexCacheSize parameter has been added for server and proxy
- Several new parameters have been added that are related to encryption support
Performance improvements
The process of trigger expression evaluation has been improved dramatically by using a hashing mechanism. Also configuration cache locking during that process has been reduced multiple times.
The nodata() function calculation has been improved to limit the database requests to the range specified in nodata() function.
When an active proxy connects to Zabbix server, the server identifies this proxy using information from server configuration cache (in earlier versions directly from database). This improves performance and reduces database load. On the other hand, changing active proxy settings via frontend or API now does not have an instant effect. It has to wait until server configuration cache is updated from the database (can be enforced from commandline).
The number of configuration cache locks done by pollers has been reduced. This should give slight performance improvement in peak situations.
Networking performance: in outgoing TCP connections Zabbix now combines header, data size and data (at least initial part) in one TCP packet.
Value cache improvements
Value cache now also tracks the item daily range and once per day updates the active range with daily range. This will cause unused values to be eventually removed if the item request range was reduced.
When working in low memory mode value cache will attempt to switch back to normal operational mode once per day. The current operational mode can be checked with zabbix[vcache,cache,mode] key. See the internal check documentation.
Zabbix agent crash log on Windows platforms
Zabbix agent will now log crash information on Windows similar to the one generated by agents on Unix-like platforms. However to obtain the full stack trace the program database file (zabbix_agentd.pdb) must be located in the same directory as Zabbix agent binary (zabbix_agentd.exe). Currently this file is not included in official Zabbix distributions, but can be found in build output directory after building Zabbix agent on Windows platform.
TCP connection timeout on Windows platforms
The configured timeout option is now properly applied when estabilishing TCP connections on Windows platform. This affects the following Zabbix agent keys:
- net.tcp.port
- net.tcp.service
- net.tcp.service.perf
- web.page.get
- web.page.perf
- web.page.regexp
Support for IPv6 addresses in Java gateway
IPv6 addresses like 2001:db8::6c09 can now be used in JMX interfaces.
Proxy configuration size increase
Server will include "lastlogsize" and "mtime" with every item sent to proxy. Despite these fields being used only for log file monitoring they will be currently sent with all items.
Logging IP addresses of incoming/outgoing connections between Zabbix server and Zabbix proxy
The messages printed to the log files will now contain IP addresses of incoming/outgoing connections between Zabbix server and Zabbix proxy. Please see the upgrade notes for details.
Database recovery message on DebugLevel=2
If a database query fails the following message will be printed to the
log file: database is down: reconnecting in 10 seconds. When the
database goes up database connection re-established will be printed.
There were no such messages on DebugLevel=2 previously.
Host availability improvements
Previously the host availability status in the frontend depended upon whether the last item check had been successful or not. In the absence of any new checks, the last known status would be displayed indefinitely. In the new version, displaying host availability has been made much more accurate.
Zabbix server will set the host availability icon to gray (unknown status) for the corresponding agents (Zabbix, SNMP, IMP, JMX) if:
- there are no enabled items on the corresponding interface - they were removed or disabled (Zabbix agent active checks, as before, do not influence host availability in any way),
- host is set to be monitored by proxy, a different proxy or by server if it was monitored by proxy,
- host is monitored by a proxy that appears to be offline (no updates received from the proxy during the maximum heartbeat interval - 1 hour),
- host is disabled.
Support for multiple escalators
Zabbix now supports multiple escalator processes. The number of
escalator processes can be configured with the StartEscalators
configuration file parameter (1
being the default value).
Printing defaults with --help option
Zabbix programs will now print default values (configuration file, port) when executed with the --help option.
Dropping Inetd Zabbix agent
The Inetd version of Zabbix agent (zabbix_agent) has been dropped as it did not seem to have any users.
History cache improvements
History cache will better handle the processing of a large number of values (100 and more values per item) coming from a low number of items (100 items or less).
Text-based values (character, text, log types) are now stored in history cache and the history text cache has been removed together with internal items used to monitor it.
History index cache has been added to keep index of the history cache. A
new zabbix[wcache,index,<mode>] internal check was added to monitor
history index cache usage. See Internal
checks for details.
Action and action condition caching
Actions and action conditions are now stored in configuration cache, improving action processing performance.
Item changes/improvements
A new proc.cpu.util item has been added to monitor process CPU utilisation. This item is supported on Linux and Solaris platforms.
net.udp.service and net.udp.service.perf items have been added with the possibility to check NTP service. Before Zabbix 3.0 checking of NTP service was done using net.tcp.service and net.tcp.service.perf items. Database upgrade patches automatically convert NTP service checks using net.tcp.service and net.tcp.service.perf to the new item.
New internal checks zabbix[host,,items] and zabbix[host,,items_unsupported] have been added. They return the number of items (unsupported items) on the target host.
A new service.discovery item has been added for the low-level discovery of Windows services, while the new service.info item will help retrieving information about a service. The service.info item should now be used instead of the deprecated service_state item.
A new db.odbc.discovery item has been introduced to support low-level discovery using ODBC SQL queries.
A connection protocol parameter has been added to net.dns and net.dns.record agent items. The accepted values are 'udp' and 'tcp' (udp being the default).
net.dns and net.dns.record items on Windows now bypass the internal DNS resolver cache.
net.tcp.listen on Linux 2.6.14 and upward kernel systems now tries to make use of the kernel's NETLINK interface. When building from source, this code is only compiled if netlink.h and inet_diag.h headers are found in the include path. The interface relies on the presence and operation of inet_diag and tcp_diag kernel modules. In the case of these modules not being loaded, the item will fall back on the old method of retrieving sockets by state via reading the /proc/net/tcp(6) file(s).
The methodology for reading the /proc/net/tcp(6) file(s) has been changed as well. Now the files aren't being read fully anymore, but only as long as entries related to sockets in a LISTEN state are being parsed. This relies on the assumption that sockets in the LISTEN state are listed before any other sockets. This has shown an increase in performance of varying magnitudes, but has never shown a decrease in performance.
proc.mem item now supports a 5th parameter - 'memtype' (only on AIX, FreeBSD, Linux, Solaris).
system.cpu.util now supports types 'guest' and 'guest_nice' on Linux kernels 2.6.24 and 2.6.33 and upwards, respectively.
vfs.fs.discovery item on Windows now returns an additional {#FSDRIVETYPE} macro with possible values of "unknown", "norootdir", "removable", "fixed", "remote", "cdrom", "ramdisk". Note, however, that if filtering by {#FSDRIVETYPE}, low-level discovery will ignore entities discovered by older agents which return responses without this macro.
Aggregate items now do not require setting the fourth parameter (timeperiod) if the third parameter (itemfunc) is set to last. In such cases, the fourth parameter is ignored, if set.
A check for valid reference has been added for global regular expressions in snmptrap, log, logrt and eventlog items. If entered reference is not valid, due to misspelling or missing referenced global regular expression, the item will become unsupported and appropriate error message will be displayed.
Log file monitoring (log, logrt and eventlog) was improved by sending actual log file meta information in specific cases and keeping it on Zabbix server side. Log file meta information includes "lastlogsize", "mtime" and "state". Now you can safely restart Zabbix agent or remove Zabbix proxy database while monitoring a log file without getting double alerts.
vm.memory.size[available] item on AIX now returns the sum of free and cached memory. Before Zabbix 3.0 only the free memory size was returned.
vm.memory.size[available] item on Linux now reads MemAvailable (the system's native estimate) from /proc/meminfo on Linux kernels 3.14 and above. Before Zabbix 3.0 it was always the sum of free, buffers, and cached memories.
Items proc.mem and proc.num now return 0 if the specified user does not exist. Before Zabbix 3.0 these items became not supported.
vfs.fs.inode item on CephFS will become not supported instead of returning invalid numbers if second parameter is other than empty or total.
vfs.fs.size used to return huge values when the disk space available to normal users was exhausted. The "df" command shows negative value in this case. Now, 0 is returned. This behaviour was noticed on FreeBSD platform.
net.if.in, net.if.out and net.if.total items on Windows get values from 64-bit counters if available. 64-bit interface statistics counters were introduced in Windows Vista and Windows Server 2008. If 64-bit counters are not available, the agent uses 32-bit counters as before.
system.uname item on Windows gets values from WMI Win32_OperatingSystem and Win32_Processor classes instead of volatile Windows APIs and undocumented registry keys.
Function improvements
forecast() and timeleft() predictive functions have been added.
A percentile() trigger function has been added, which returns the P-th percentile of a series of values. It can be used in calculated items, trigger expressions and notifications.
A check for valid reference has been added for global regular expressions in logeventid(), regexp() and iregexp() trigger functions. If entered reference is not valid, due to misspelling or missing referenced global regular expression, the trigger will switch to unknown state and appropriate error message will be displayed.
Macro improvements
Low-level discovery macros can be used in item prototype IPMI sensor and Units fields.
Host-level macros such as {HOST.HOST}, {HOST.NAME}, {HOST.IP}, {HOST.DNS}, {HOST.CONN} and {HOST.PORT} along with user macros {$MACRO} are now available in the trigger URL.
Commandline utility improvements
zabbix_get exit code now is 0 (success) or 1 (error). In earlier
versions it was 0 (success or error - cannot distinguish between them)
or 141 (SIGPIPE).
API improvements
Returning permissions with usergroup.get
Returning user group permissions for host groups is now supported with
the usergroup.get method. Setting
permissions was already allowed with the usergroup.create and
usergroup.update methods. Now it is also possible to retrieve rights
using a new "selectRights" parameter.
Both permission level and host group ID can be returned. Super admin users can select any user group and get their rights, while admin level users can select their own user group and get rights to host groups that are either "read" or "read-write".
Value mapping
A value map API has been implemented. It comes with the standard get, create, update and delete methods.
Trends
A trend API has been implemented. It comes with the standard get method.
Miscellaneous improvements
Value map changes
A new "HTTP response status code" value map has been added.