
On this page
3 Triggers top 100
Overview
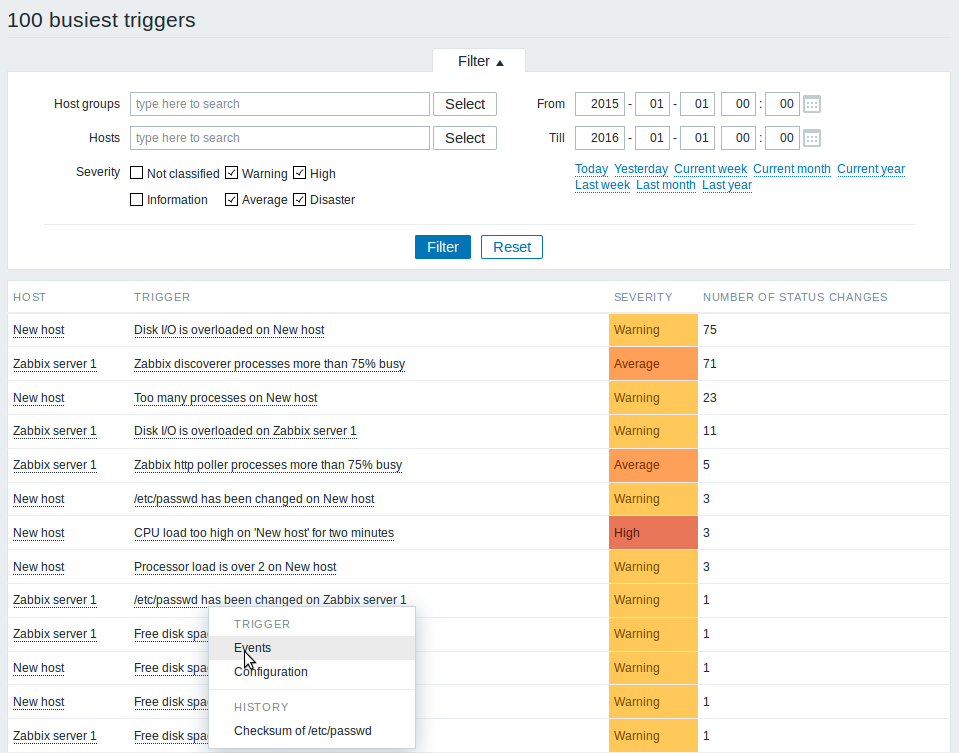
In Reports → Triggers top 100 you can see the triggers that have changed their state most often within the period of evaluation, sorted by the number of status changes.
** Using filter **
You may use the filter to display triggers by host group, host, trigger severity, predefined time period or a custom time period.
Both host and trigger column entries are links that offer some useful options:
- for host - links to user-defined scripts, latest data, inventory, graphs and screens for the host
- for trigger - links to latest events, the trigger configuration form and a simple graph