
On this page
1 Status of Zabbix
Overview
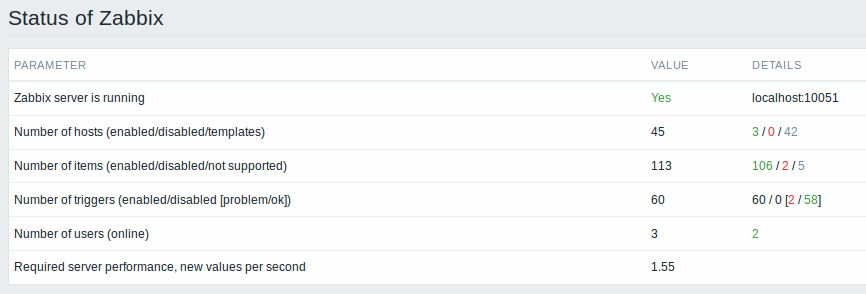
In Reports → Status of Zabbix a summary of key system data is displayed.
This report is also displayed as a widget in the Dashboard.
Displayed data
| Parameter | Value | Details |
|---|---|---|
| Zabbix server is running | Status of Zabbix server: Yes - server is running No - server is not running Note: To make sure the web frontend knows that the server is running there must be at least one trapper process started on the server (StartTrappers parameter in zabbix_server.conf file>0). |
Location and port of Zabbix server. |
| Number of hosts | Total number of hosts configured is displayed. Templates are counted as a type of host too. |
Number of monitored hosts/not monitored hosts/templates. |
| Number of items | Total number of items is displayed. Only items assigned to enabled hosts are counted. | Number of monitored/disabled/unsupported items. |
| Number of triggers | Total number of triggers is displayed. Only triggers assigned to enabled hosts and depending on enabled items are counted. | Number of enabled/disabled triggers. [Triggers in problem/ok state.] |
| Number of users | Total number of users configured is displayed. | Number of users online. |
| Required server performance, new values per second | The expected number of new values processed by Zabbix server per second is displayed. | Required server performance is an estimate and can be useful as a guideline. For precise numbers of values processed, use the zabbix[wcache,values,all] internal item.Enabled items from monitored hosts are included in the calculation. Log items are counted as one value per item update interval. Regular interval values are counted; flexible and scheduling interval values are not. The calculation is not adjusted during a "nodata" maintenance period. Trapper items are not counted. |