2 Overview
Overview
The Monitoring → Overview section offers an overview of trigger states or a comparison of data for various hosts at once.
The following display options are available:
- select all hosts or specific host groups in the Group dropdown
- choose what type of information to display (triggers or data) in the Type dropdown
- select horizontal or vertical display of information in the Hosts location dropdown
Overview of triggers
In the next screenshot Triggers are selected in the Type dropdown. As a result, trigger states of two local hosts are displayed, as coloured blocks (the colour depending on the state of the trigger):
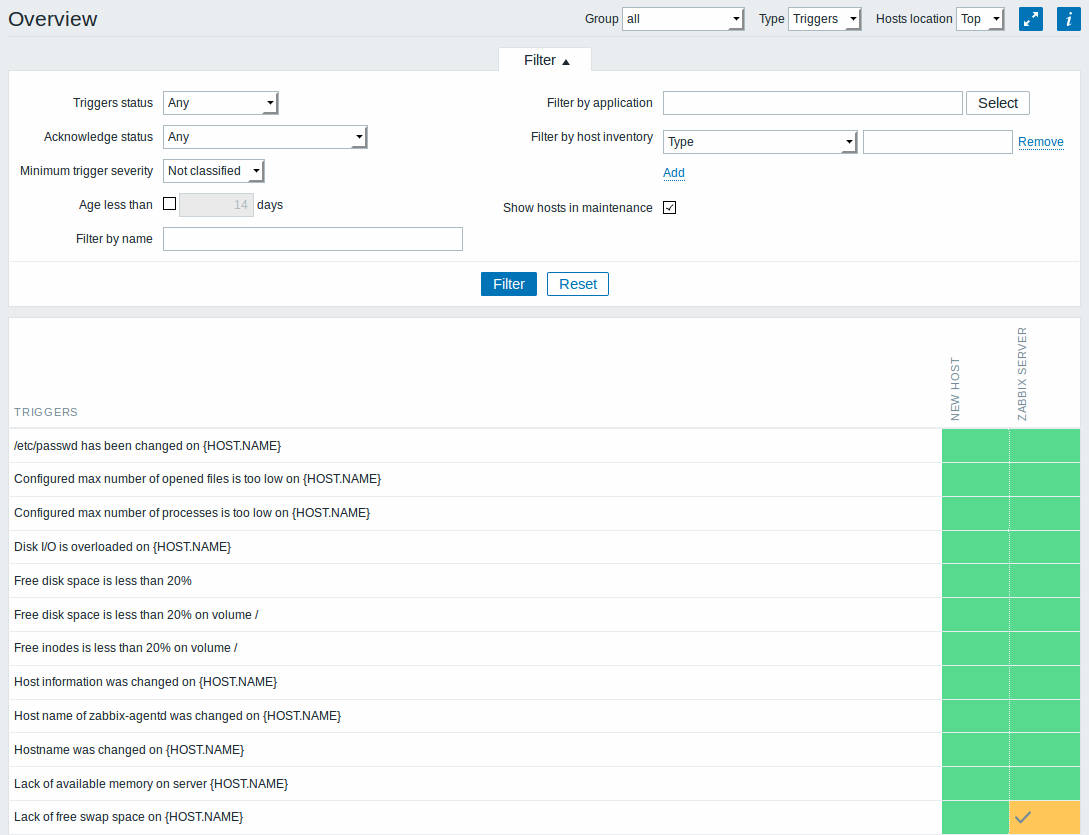
Note that recent trigger changes (within the last 30 minutes) will be displayed as blinking blocks.
Blue up and down arrows indicate triggers that have dependencies. On mouseover, dependency details are revealed.
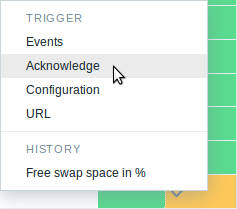
Clicking on a trigger block provides links to trigger events, configuration, the acknowledgement screen, URL or a simple graph/latest values list.
Overview of data
In the next screenshot Data is selected in the Type dropdown. As a result, performance item data of two local hosts are displayed.
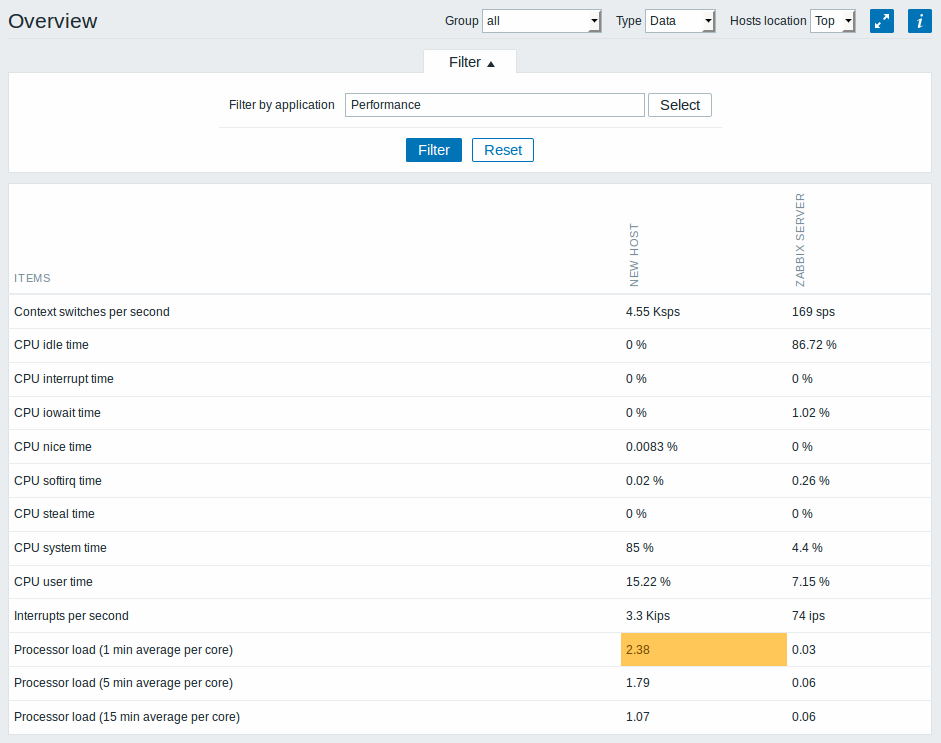
Only values that fall within the last 24 hours are displayed by default. This limit has been introduced with the aim of improving initial loading times for large pages of latest data. It is also possible to change this limitation by changing the value of ZBX_HISTORY_PERIOD constant in include/defines.inc.php.
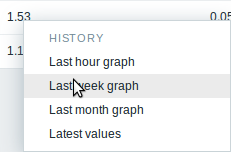
Clicking on a piece of data offers links to some predefined graphs or latest values.