
11 Queue
Overview
The queue displays items that are waiting for a refresh. The queue is just a logical representation of data. There is no IPC queue or any other queue mechanism in Zabbix.
Items monitored by proxies are also included in the queue - they will be counted as queued for the proxy history data update period.
Only items with scheduled refresh times are displayed in the queue. This means that the following item types are excluded from the queue:
- log, logrt and event log active Zabbix agent items
- SNMP trap items
- trapper items
- web monitoring items
- dependent items
Statistics shown by the queue is a good indicator of the performance of Zabbix server.
The queue is retrieved directly from Zabbix server using JSON protocol. The information is available only if Zabbix server is running.
Reading the queue
To read the queue, go to Administration → Queue.
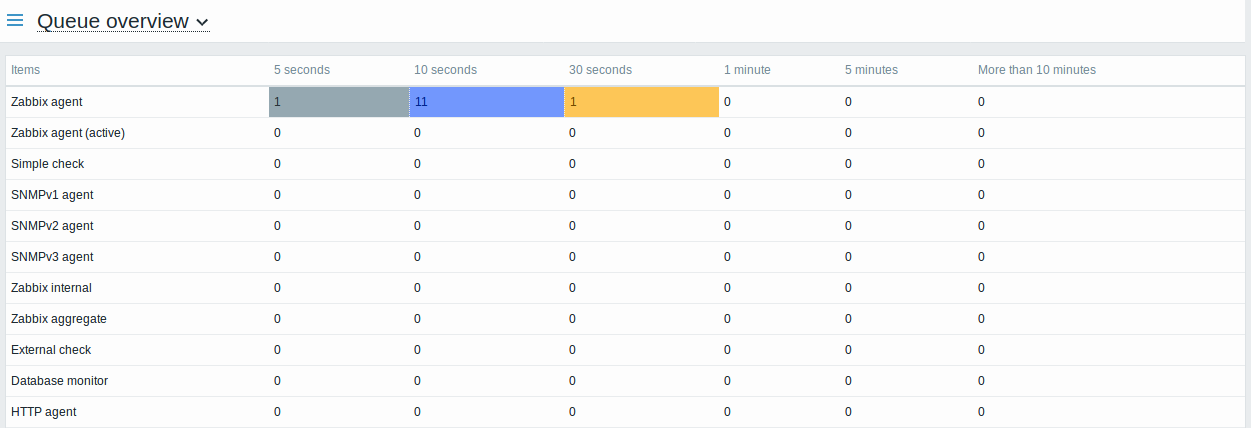
The picture here is generally "ok" so we may assume that the server is doing fine.
The queue shows some items waiting up to 30 seconds. It would be great to know what items these are.
To do just that, select Queue details in the title dropdown. Now you can see a list of those delayed items.
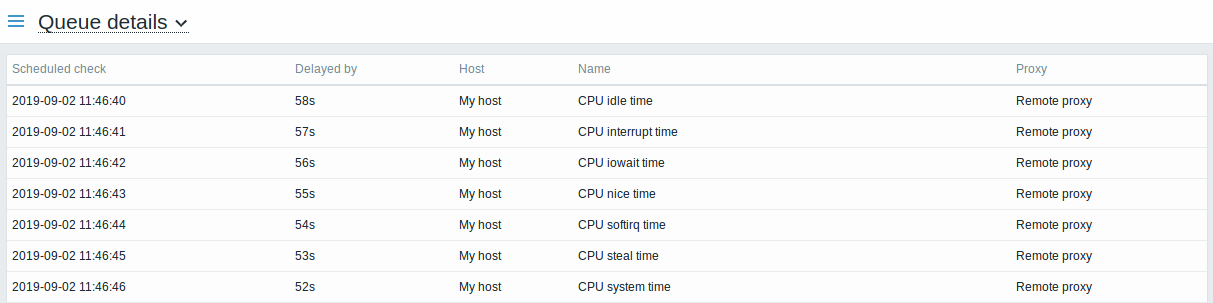
With these details provided it may be possible to find out why these items might be delayed.
With one or two delayed items there perhaps is no cause for alarm. They might get updated in a second. However, if you see a bunch of items getting delayed for too long, there might be a more serious problem.
Queue item
A special internal item zabbix[queue,<from>,<to>] can be used to monitor the health of the queue in Zabbix. It will return the number of items delayed by the set amount of time. For more information see Internal items.