
On this page
3 Hosts
Overview
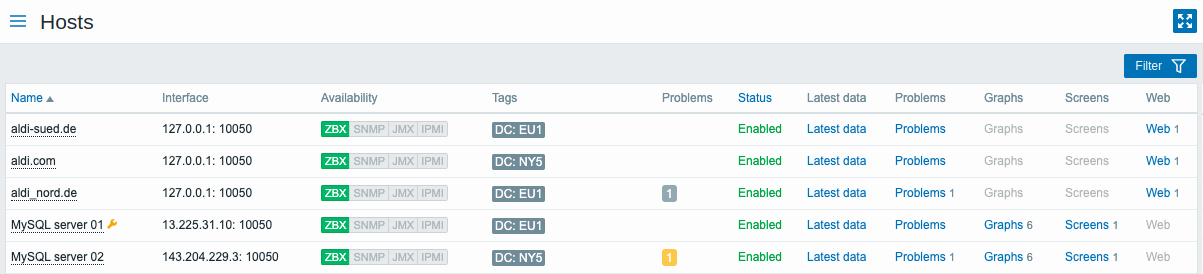
The Monitoring → Hosts section displays a full list of monitored hosts with detailed information about host interface, availability, tags, current problems, status (enabled/disabled), and links to easily navigate to the host's latest data, problem history, graphs, screens, and web scenarios.
| Column | Description |
|---|---|
| Name | Host's visible name. Clicking on the name brings up the host menu. An orange wrench icon Clicking on the header row in this column will sort hosts by name in ascending (default) or descending order. |
| Interface | The main interface of the host is displayed. |
| Availability | Availability of the host is displayed. Four icons each represent a supported interface (Zabbix agent, SNMP, IPMI, JMX). The current status of the interface is displayed by the respective color: Green - available Red - not available (upon mouseover, details of why the interface cannot be reached are displayed) Gray - unknown or not configured Note that active Zabbix agent items do not affect host availability. |
| Tags | Tags of the host and all linked templates, with macros unresolved. |
| Problems | Square icons that show current open problems. Icon color indicates problem severity. The number on an icon means the number of problems for the given severity. Use the filter to select whether suppressed problems should be included (not included by default). |
| Status | Host status is displayed - Enabled or Disabled. Clicking on the header row in this column will sort hosts by status in ascending or descending order. |
| Latest data | Clicking on the link will open Monitoring - Latest data page with all the latest data collected from the host. |
| Problems | Clicking on the link will open Monitoring - Problems section filtered to show only information for the given host. |
| Graphs | Clicking on the link will display graphs configured for the host. The number of graphs is displayed in gray. If a host has no graphs, the link is disabled (gray text) and no number is displayed. |
| Screens | Clicking on the link will display screens configured for the host. The number of screens is displayed in gray. If a host has no screens, the link is disabled (gray text) and no number is displayed. |
| Web | Clicking on the link will display web scenarios configured for the host. The number of web scenarios is displayed in gray. If a host has no web scenarios, the link is disabled (gray text) and no number is displayed. |
Buttons
View mode buttons being common for all sections are described on the Monitoring page.
Using filter
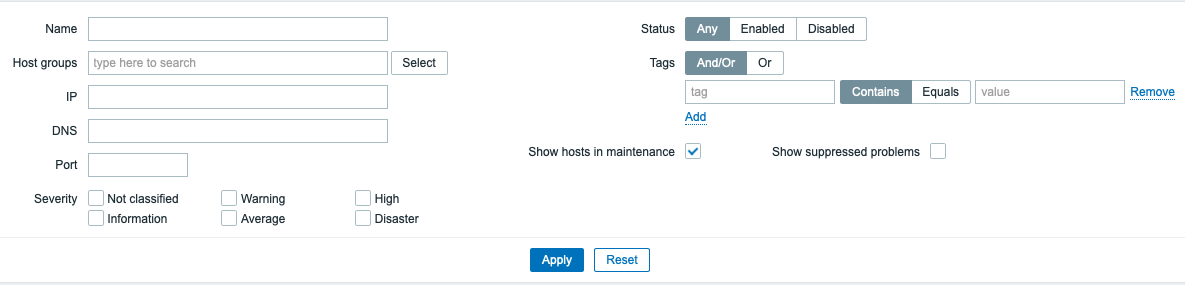
You can use the filter to display only the hosts you are interested in. The filter is located above the table. It is possible to filter hosts by name, host group, IP or DNS, interface port, tags, problem severity, status (enabled/disabled/any); you can also select whether to display suppressed problems and hosts that are currently in maintenance.
Notes:
- Name and Host group fields support multiple entries.\
- Specifying a parent host group implicitly selects all nested host groups.\
- By default problems of all severities are displayed, if not suppressed.\
- By default hosts in maintenance are displayed, but suppressed problems on these hosts are not shown.\
- When Severity filter is used and Show suppressed problems checkbox is unchecked, hosts with suppressed problems of the specified severity will not be displayed.\
- Hosts can be filtered by host-level tags as well as tags from all linked templates, including parent templates.