
2 Web scenarios
Overview
Host web scenario information can be accessed from Monitoring → Hosts by clicking on Web for the respective host.
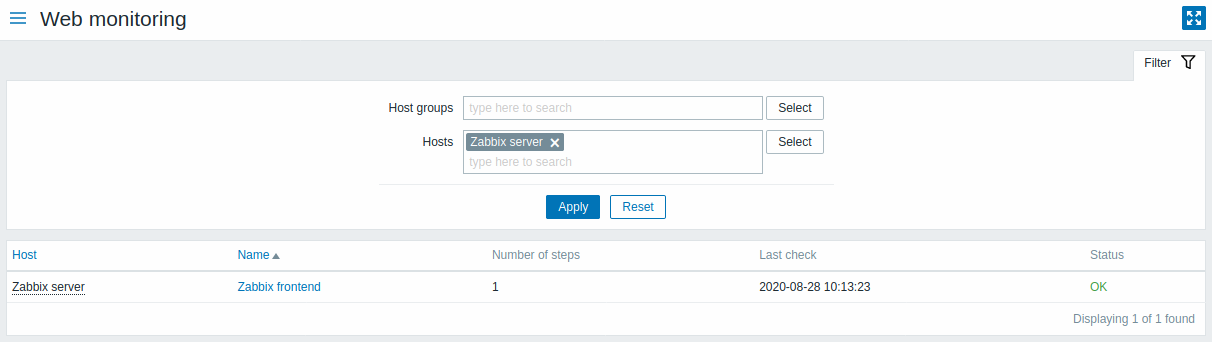
The page shows a list of all web scenarios of the selected host. To view web scenarios for another host or host group without returning to the Monitoring → Hosts page, select that host or group in the filter.
Data of disabled hosts is also accessible. The name of a disabled host is listed in red.
The maximum number of scenarios displayed per page depends on the Rows per page user profile setting.
Only values that fall within the last 24 hours are displayed by default. This limit has been introduced with the aim of improving initial loading times for large pages of web monitoring. It is also possible to change this limitation by changing the value of ZBX_HISTORY_PERIOD constant in include/defines.inc.php.
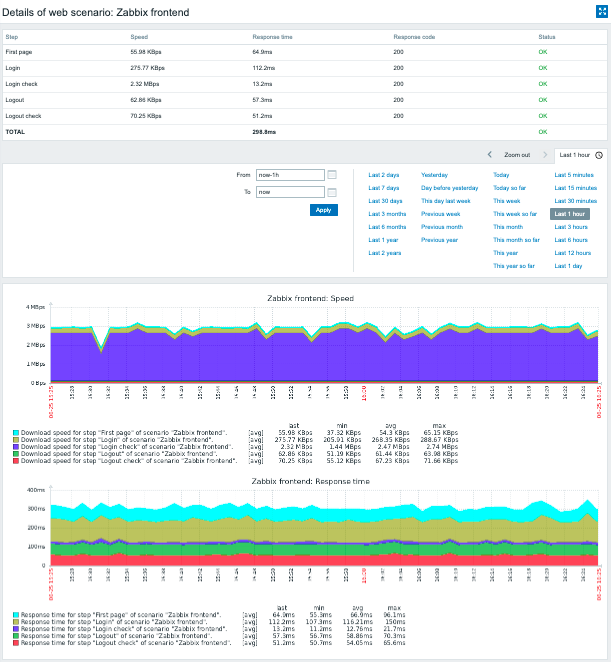
The scenario name is link to more detailed statistics about it:
Buttons
View mode buttons being common for all sections are described on the Monitoring page.