
13 JMX monitoring
Overview
JMX monitoring can be used to monitor JMX counters of a Java application.
JMX monitoring has native support in Zabbix in the form of a Zabbix daemon called "Zabbix Java gateway", introduced since Zabbix 2.0.
To retrieve the value of a particular JMX counter on a host, Zabbix server queries the Zabbix Java gateway, which in turn uses the JMX management API to query the application of interest remotely.
For more details and setup see the Zabbix Java gateway section.
Communication between Java gateway and the monitored JMX application should not be firewalled.
Enabling remote JMX monitoring for Java application
A Java application does not need any additional software installed, but it needs to be started with the command-line options specified below to have support for remote JMX monitoring.
As a bare minimum, if you just wish to get started by monitoring a simple Java application on a local host with no security enforced, start it with these options:
java \
-Dcom.sun.management.jmxremote \
-Dcom.sun.management.jmxremote.port=12345 \
-Dcom.sun.management.jmxremote.authenticate=false \
-Dcom.sun.management.jmxremote.ssl=false \
-Dcom.sun.management.jmxremote.registry.ssl=false \
-jar /usr/share/doc/openjdk-6-jre-headless/demo/jfc/Notepad/Notepad.jar
This makes Java listen for incoming JMX connections on port 12345, from local host only, and tells it not to require authentication or SSL.
If you want to allow connections on another interface, set the -Djava.rmi.server.hostname parameter to the IP of that interface.
If you wish to be more stringent about security, there are many other Java options available to you. For instance, the next example starts the application with a more versatile set of options and opens it to a wider network, not just local host.
java \
-Djava.rmi.server.hostname=192.168.3.14 \
-Dcom.sun.management.jmxremote \
-Dcom.sun.management.jmxremote.port=12345 \
-Dcom.sun.management.jmxremote.authenticate=true \
-Dcom.sun.management.jmxremote.password.file=/etc/java-6-openjdk/management/jmxremote.password \
-Dcom.sun.management.jmxremote.access.file=/etc/java-6-openjdk/management/jmxremote.access \
-Dcom.sun.management.jmxremote.ssl=true \
-Dcom.sun.management.jmxremote.registry.ssl=true \
-Djavax.net.ssl.keyStore=$YOUR_KEY_STORE \
-Djavax.net.ssl.keyStorePassword=$YOUR_KEY_STORE_PASSWORD \
-Djavax.net.ssl.trustStore=$YOUR_TRUST_STORE \
-Djavax.net.ssl.trustStorePassword=$YOUR_TRUST_STORE_PASSWORD \
-Dcom.sun.management.jmxremote.ssl.need.client.auth=true \
-jar /usr/share/doc/openjdk-6-jre-headless/demo/jfc/Notepad/Notepad.jar
Most (if not all) of these settings can be specified in
/etc/java-6-openjdk/management/management.properties (or wherever that
file is on your system).
Note that if you wish to use SSL, you have to modify startup.sh script
by adding -Djavax.net.ssl.* options to Java gateway, so that it knows
where to find key and trust stores.
See Monitoring and Management Using JMX for a detailed description.
Configuring JMX interfaces and items in Zabbix frontend
With Java gateway running, server knowing where to find it and a Java application started with support for remote JMX monitoring, it is time to configure the interfaces and items in Zabbix GUI.
Configuring JMX interface
You begin by creating a JMX-type interface on the host of interest.
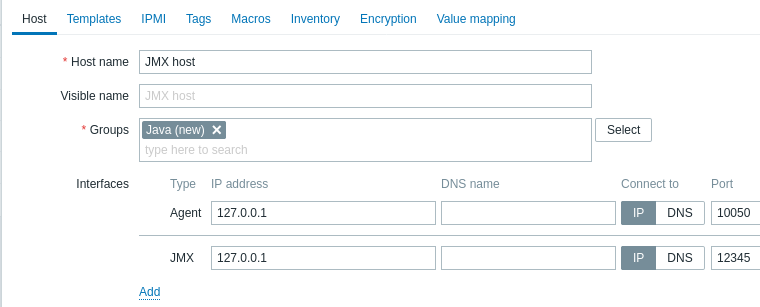
All mandatory input fields are marked with a red asterisk.
Adding JMX agent item
For each JMX counter you are interested in you add JMX agent item attached to that interface.
The key in the screenshot below says
jmx["java.lang:type=Memory","HeapMemoryUsage.used"].
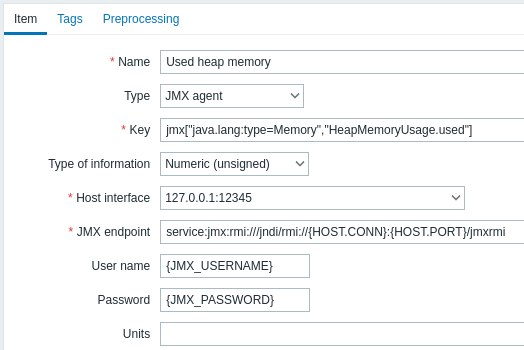
All mandatory input fields are marked with a red asterisk.
The fields that require specific information for JMX items are:
| Type | Set JMX agent here. |
| Key | The jmx[] item key contains three parameters:object name - the object name of an MBean attribute name - an MBean attribute name with optional composite data field names separated by dots unique short description - a unique description that allows multiple JMX items with the same object name and attribute name on the host (optional) See below for more detail on JMX item keys. Since Zabbix 3.4, you may discover MBeans and MBean attributes using a jmx.discovery[] low-level discovery item. |
| JMX endpoint | You may specify a custom JMX endpoint. Make sure that JMX endpoint connection parameters match the JMX interface. This can be achieved by using {HOST.*} macros as done in the default JMX endpoint. This field is supported since 3.4.0. {HOST.*} macros and user macros are supported. |
| User name | Specify the user name, if you have configured authentication on your Java application. User macros are supported. |
| Password | Specify the password, if you have configured authentication on your Java application. User macros are supported. |
If you wish to monitor a Boolean counter that is either "true" or "false", then you specify type of information as "Numeric (unsigned)" and select "Boolean to decimal" preprocessing step in the Preprocessing tab. Server will store Boolean values as 1 or 0, respectively.
JMX item keys in more detail
Simple attributes
An MBean object name is nothing but a string which you define in your Java application. An attribute name, on the other hand, can be more complex. In case an attribute returns primitive data type (an integer, a string etc.) there is nothing to worry about, the key will look like this:
jmx[com.example:Type=Hello,weight]In this example the object name is "com.example:Type=Hello", the attribute name is "weight", and the returned value type should probably be "Numeric (float)".
Attributes returning composite data
It becomes more complicated when your attribute returns composite data. For example: your attribute name is "apple" and it returns a hash representing its parameters, like "weight", "color" etc. Your key may look like this:
jmx[com.example:Type=Hello,apple.weight]This is how an attribute name and a hash key are separated, by using a dot symbol. Same way, if an attribute returns nested composite data the parts are separated by a dot:
jmx[com.example:Type=Hello,fruits.apple.weight]Attributes returning tabular data
Tabular data attributes consist of one or multiple composite attributes. If such an attribute is specified in the attribute name parameter then this item value will return the complete structure of the attribute in JSON format. The individual element values inside the tabular data attribute can be retrieved using preprocessing.
Tabular data attribute example:
jmx[com.example:type=Hello,foodinfo]Item value:
[
  {
    "a": "apple",
    "b": "banana",
    "c": "cherry"
  },
  {
    "a": "potato",
    "b": "lettuce",
    "c": "onion"
  }
]
Problem with dots
So far so good. But what if an attribute name or a hash key contains dot symbol? Here is an example:
jmx[com.example:Type=Hello,all.fruits.apple.weight]That's a problem. How to tell Zabbix that attribute name is "all.fruits", not just "all"? How to distinguish a dot that is part of the name from the dot that separates an attribute name and hash keys?
Before 2.0.4 Zabbix Java gateway was unable to handle such situations and users were left with UNSUPPORTED items. Since 2.0.4 this is possible, all you need to do is to escape the dots that are part of the name with a backslash:
jmx[com.example:Type=Hello,all\.fruits.apple.weight]Same way, if your hash key contains a dot you escape it:
jmx[com.example:Type=Hello,all\.fruits.apple.total\.weight]Other issues
A backslash character in an attribute name should be escaped:
jmx[com.example:type=Hello,c:\\documents]For handling any other special characters in JMX item key, please see the item key format section.
This is actually all there is to it. Happy JMX monitoring!
Non-primitive data types
Since Zabbix 4.0.0 it is possible to work with custom MBeans returning non-primitive data types, which override the toString() method.
Using custom endpoint with JBoss EAP 6.4
Custom endpoints allow working with different transport protocols other than the default RMI.
To illustrate this possibility, let's try to configure JBoss EAP 6.4 monitoring as an example. First, let's make some assumptions:
- You have already installed Zabbix Java gateway. If not, then you can do it in accordance with the documentation.
- Zabbix server and Java gateway are installed with the prefix
/usr/local/ - JBoss is already installed in
/opt/jboss-eap-6.4/and is running in standalone mode - We shall assume that all these components work on the same host
- Firewall and SELinux are disabled (or configured accordingly)
Let's make some simple settings in zabbix_server.conf:
JavaGateway=127.0.0.1
StartJavaPollers=5
And in the zabbix_java/settings.sh configuration file (or
zabbix_java_gateway.conf):
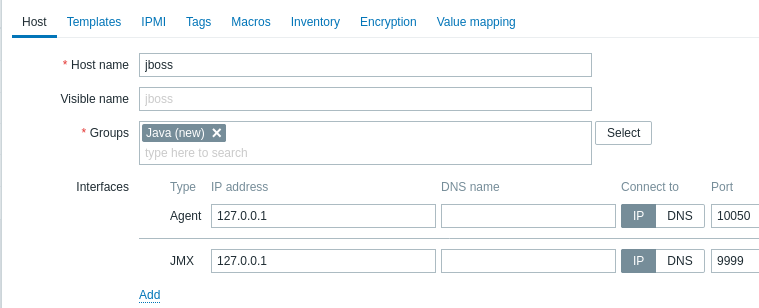
START_POLLERS=5Check that JBoss listens to its standard management port:
$ netstat -natp | grep 9999
tcp        0      0 127.0.0.1:9999          0.0.0.0:*               LISTEN      10148/java
Now let's create a host with JMX interface 127.0.0.1:9999 in Zabbix.
As we know that this version of JBoss uses the JBoss Remoting protocol instead of RMI, we may mass update the JMX endpoint parameter for items in our JMX template accordingly:
service:jmx:remoting-jmx://{HOST.CONN}:{HOST.PORT}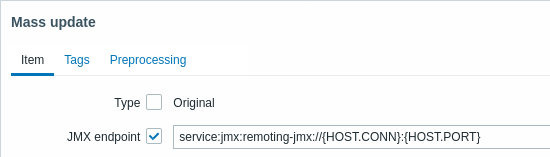
Let's update the configuration cache:
/usr/local/sbin/zabbix_server -R config_cache_reloadNote that you may encounter an error first.
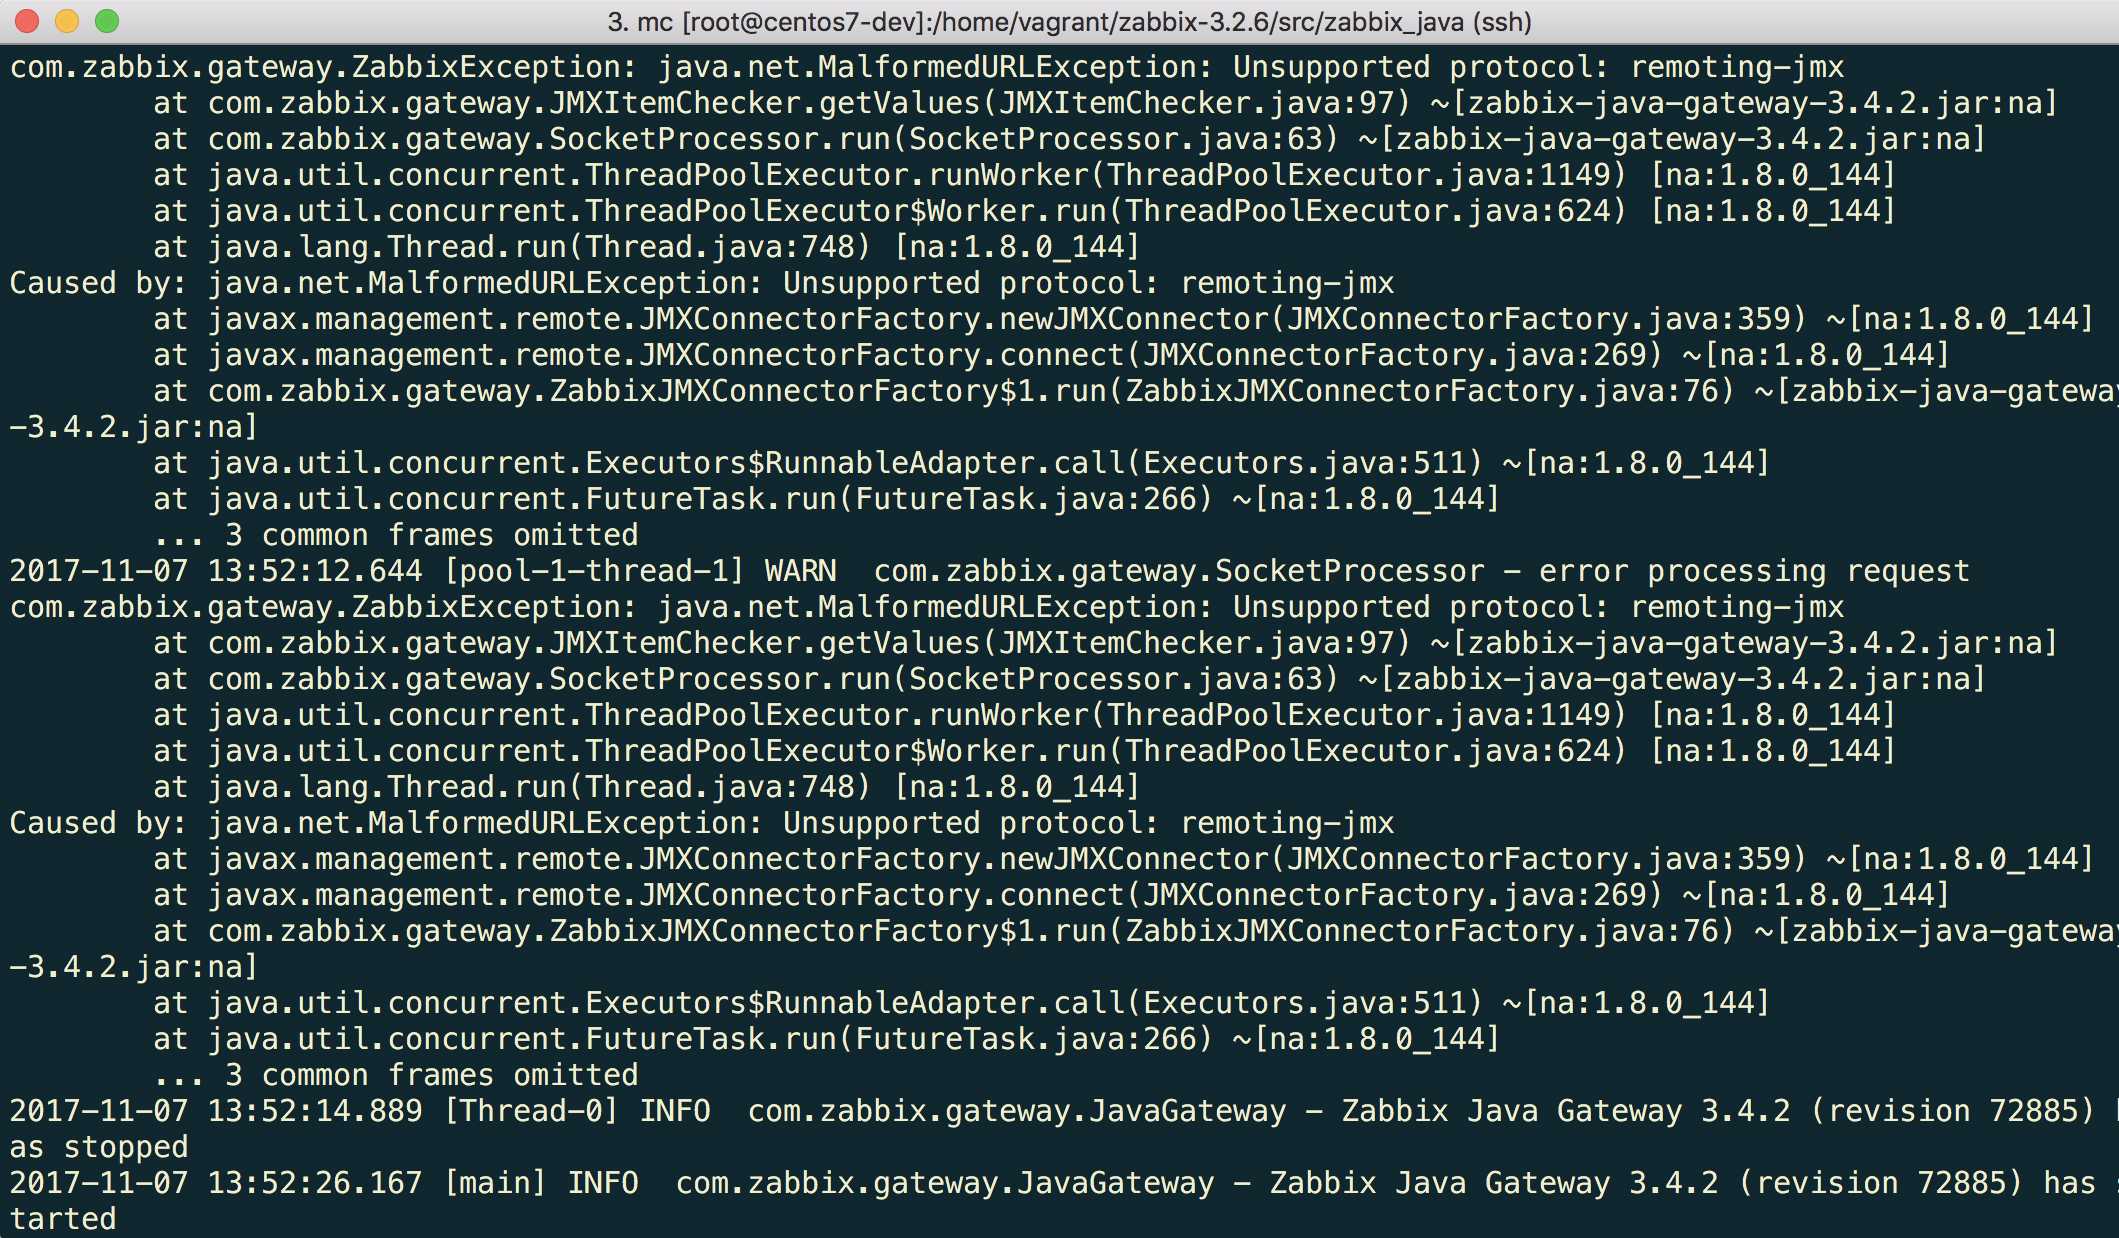
"Unsupported protocol: remoting-jmx" means that Java gateway does not
know how to work with the specified protocol. That can be fixed by
creating a ~/needed_modules.txt file with the following content:
jboss-as-remoting
jboss-logging
jboss-logmanager
jboss-marshalling
jboss-remoting
jboss-sasl
jcl-over-slf4j
jul-to-slf4j-stub
log4j-jboss-logmanager
remoting-jmx
slf4j-api
xnio-api
xnio-nio
and then executing the command:
for i in $(cat ~/needed_modules.txt); do find /opt/jboss-eap-6.4 -iname "${i}*.jar" -exec cp '{}' /usr/local/sbin/zabbix_java/lib/ \; ; doneThus, Java gateway will have all the necessary modules for working with jmx-remoting. What's left is to restart the Java gateway, wait a bit and if you did everything right, see that JMX monitoring data begin to arrive in Zabbix (see also: Latest data).