
- 5 What's new in Zabbix 6.0.0
- Widgets
- Functions
- Items
- Preprocessing
- Macros
- Databases
- Processes
- Templates
- Notifications
- Frontend
- Password requirements
- Audit log
- Template linking more visible
- Subfilter in latest data
- Usability improvements to custom graphs
- Creating hosts from Monitoring
- Host editing as popup
- Better navigation between item configuration and latest data
- Monitoring → Latest data updated
- Monitoring → Overview removed
- Miscellaneous
- Breaking changes
5 What's new in Zabbix 6.0.0
See breaking changes for this version.
High availability cluster for Zabbix server
The new version comes with a native high availability solution for Zabbix server.
The solution consists of multiple zabbix_server instances or nodes, where only one node can be active (working) at a time, while other nodes are on standby, ready to take over in case the current node is stopped or fails.
See also: High availability cluster.
Updated service monitoring
Several updates have been made to the monitoring of services. Service monitoring offers a high-level view of the monitored infrastructure in Zabbix.
Tag-based mapping of services to problems
The availability of services in previous Zabbix versions depended on triggers and their states. In the new version that is replaced by a tag-based mapping to problems for the respective service.
In service configuration, hard and soft dependencies no longer exist. Instead, a service can have multiple parent services.
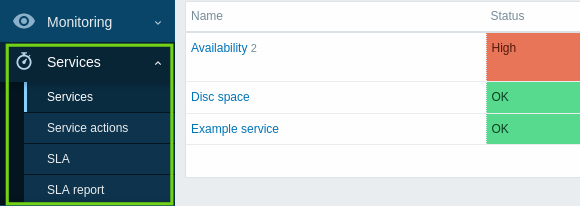
Services menu
There is now a new Services menu in Zabbix, with four menu sections:
- Services - for service overview and service configuration (moved from Monitoring -> Services)
- Service actions - for service actions (new action type)
- SLA - for configuring SLAs
- SLA report - for SLA reports (also available as dashboard widget)
Note that a separate section for service configuration no longer exists (previously in Configuration → Services).
Status calculation and propagation rules
There are new status calculation rules and flexible additional rules for calculating the status of a parent service based on the statuses and weight of direct children. It is now also possible to set flexible rules for propagating a service status to parent services.
Permissions
Flexible permissions to services have been implemented on user role level. Read-write or read-only access can be granted to all, none or selected services (based on name or tags).
Root cause analysis
A new Root cause column lists the underlying problems that directly or indirectly affect the service status.
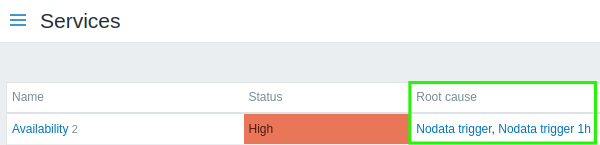
If you click on the problem name you can see more details about it in Monitoring → Problems.
Alerting on service status change
It is now possible to receive automated alerts about service status changes, similar to the alerts about trigger status changes.
A new service action functionality has been added, similar to other actions in Zabbix. Service actions may include steps for problem, recovery, and update operations related to services. It is possible to configure two types of actions: sending a message to the specified recipients and executing a remote command on Zabbix server. Similarly to trigger actions, service actions support problem escalation scenarios.
New message templates Service, Service recovery, and Service update have been added to media types and should be defined to enable correct sending of notifications for service actions.
Service cloning
Services now can be cloned. The Clone button has been added to the configuration form of a service. When a service is cloned, its parent links are preserved, while the child links are not.
Widgets
Several dashboard widgets have been added in the new version.
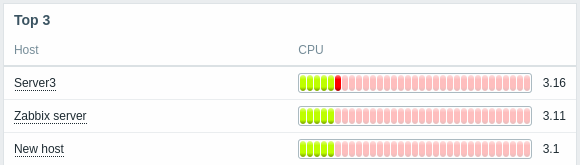
Top hosts
A Top hosts widget has been added to dashboard widgets. This widget is designed to replace the Data overview widget that is now deprecated.
The Top hosts widget allows to create custom tables for data overview, which is useful for Top N-like reports and bar-progress reports useful for capacity planning.
For more information, see Top hosts widget.
Item value
An Item value widget has been added to dashboard widgets.
This type of widget is useful for displaying values of single items prominently. Different visual styles of display are possible:
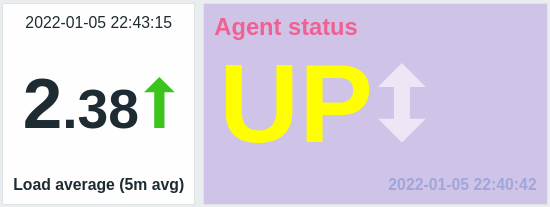
For more information, see Item value widget.
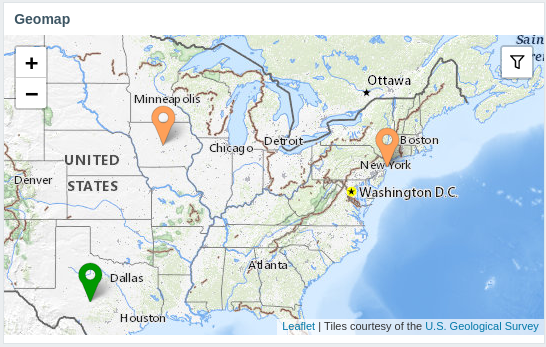
Geomap
A new geomap widget for the dashboards has been introduced providing a way to display hosts on geographical maps. For more information see the Geomap dashboard widget and geographical maps.
Functions
Functions for Prometheus histograms
It has been possible to collect Prometheus metrics in Zabbix for a while now, but some of the metrics are difficult to work with. Specifically, the metrics of histogram type can be presented in Zabbix as multiple items with the same key names, but different parameters. However, even though such items are logically related and represent the same data, it has been difficult to analyze the collected data without specialized functions. To cover this functionality gap in the new version, rate() and histogram_quantile() functions, producing the same result as their PromQL counterparts, have been added.
Other new additions to complement this functionality are the bucket_rate_foreach() and the bucket_percentile() functions. For more information see:
- History functions (see rate())
- Aggregate functions (see histogram_quantile(), bucket_percentile())
- Foreach functions (see bucket_rate_foreach())
Monotonic change
It is now possible to check for monotonic increase or decrease in item values using the new monoinc() or monodec() history functions.
Change count
A new history function changecount() has been added allowing to count the number of changes between adjacent values. The function supports three different modes for counting all changes, only decreases, or only increases. As an example, it can be used to track changes in the number of users or the number of system uptime decreases.
Entity count
New functions have been added to simplify the counting of specific hosts, items, or values, returned by foreach functions.
Aggregate functions:
- count - total number of values in an array returned by a foreach function (returns an integer);
- item_count - total number of currently enabled items that match filter criteria (returns an integer).
Foreach function:
- exists_foreach - number of currently enabled items that match filter criteria (returns an array).
Baseline monitoring
Set of available baseline monitoring options has been extended with the two new functions baselinedev and baselinewma.
- baselinedev - compares the last data period with the same data periods in preceding seasons and returns the number of deviations;
- baselinewma - calculates the baseline by averaging data from the same timeframe in multiple equal time periods ('seasons') using the weighted moving average algorithm.
In context of these functions, the term 'season' refers to a configurable timeframe, which could be hours, days, weeks, months or years. The length of a season and the number of seasons to analyse is set in function parameters.
See history functions for more info.
Anomaly detection
Zabbix 5.2 introduced new trend functions useful for baseline monitoring. However, they still require defining relative thresholds (e.g. check that web traffic in September, 2021 is less than 2x higher compared to September, 2020). There are use cases when such thresholds are hard to define. For instance, the web traffic of a new but highly popular web site can organically grow many times over a year but the growth rate is unknown. Yet, a sudden traffic spike due to DDOS attack must generate an alert regardless of organic traffic growth.
Anomaly detection algorithms do exactly this - find data that doesn't look normal (outliers) in a context of other values.
New trend function trendstl() has been added which uses 'decomposition' method to calculate the anomaly rate. It splits a single time series sequence into three other sequences:
- trend sequence that only contains big changes in the original data (e.g. website traffic shows growth)
- season sequence that only contains seasonal changes (e.g. less website traffic in summer, more in autumn)
- remainder sequence that only contains residual values that can not be interpreted as parts of trend or season
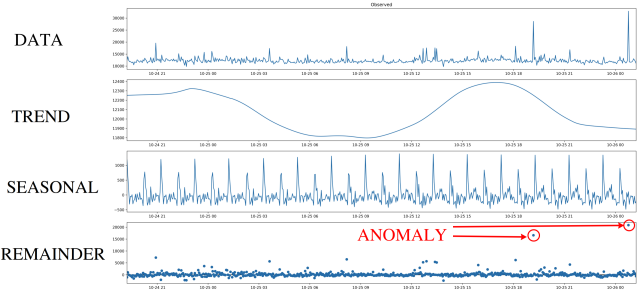
Anomaly detection works with remainder sequence and checks if there are values that are too far from the majority of remainder values. "Far" means that the absolute value from the remainder sequence is N times greater than the standard or mean deviation.
String functions
String function concat now allows concatenating more than two parameters. It can be used to combine strings and values in different combinations or append two or more values to each other. Numeric data types are also supported.
Items
Automated type selection
Item configuration form now automatically suggests the matching type of information, if selected item key returns data only of the specific type (for example, log[] item requires Type of information: Log). Type of information parameter is now located under the Key parameter on the primary Item tab and is duplicated on the Preprocessing tab if at least one preprocessing step is specified. If Zabbix detects a possible mismatch of the selected type of information and key, a warning icon will be displayed next to the Type of information field.
Agent items
Several new items have been added to Zabbix agent/agent 2:
- agent.hostmetadata - return host metadata
- kernel.openfiles - return the number of open file descriptors
- net.tcp.socket.count[] - return the number of TCP sockets that match parameters
- net.udp.socket.count[] - return the number of UDP sockets that match parameters
- vfs.dir.get[] - return list of directory files as JSON
- vfs.file.get[] - return information about a file as JSON
- vfs.file.owner[] - return the ownership of a file
- vfs.file.permissions[] - return a 4-digit string containing octal number with Unix permissions
Additionally:
- vfs.file.cksum[] now supports a second
modeparameter (crc32, md5, sha256) - vfs.file.size[] now supports a second
modeparameter (bytes or lines) - vfs.fs.discovery and vfs.fs.get now return an {#FSLABEL} macro on Windows (with volume names)
For more details see agent items.
Calculated items
Calculated items now support not only numeric, but also text, log, and character types of information.
Bulk processing for Prometheus metrics
Bulk processing of dependent items has been introduced in the preprocessing queue to improve the performance of retrieving Prometheus metrics.
See Prometheus checks for more details.
JavaScript methods
HTTP methods PATCH, HEAD, OPTIONS, TRACE, CONNECT have been added to the JavaScript engine. Also, the engine now allows sending custom HTTP method requests with the new JS method HttpRequest.customRequest.
See also: Additional JavaScript objects.
Compressed content in web monitoring
The ability to handle compressed content has been added to Zabbix web monitoring. All encoding formats supported by libcurl are supported.
Preprocessing
Prometheus query language
Zabbix Prometheus preprocessing query language now supports two additional label matching operators:
- != -- select labels that are not equal to the provided string;
- !\~ -- select labels that do not regex-match the provided string.
Result processing for Prometheus pattern
A Prometheus pattern step in the preprocessing can produce a result where multiple lines are matched. To handle this situation, a new result processing parameter has been added to the Prometheus pattern preprocessing step that allows to aggregate the data of potentially multiple matching lines by introducing functions such as sum, min, max, avg, and count.
Macros
New macros
New macros are now supported for trigger expression debugging and internal actions.
Expression debugging macros simplify the process of debugging trigger expressions:
- {TRIGGER.EXPRESSION.EXPLAIN}, {TRIGGER.EXPRESSION.RECOVERY.EXPLAIN} - resolve to a partially evaluated trigger or recovery expression, where only item-based functions are applied;
- {FUNCTION.VALUE<1-9>}, {FUNCTION.RECOVERY.VALUE<1-9>} - resolve to the results of the Nth item-based function at the time of the event.
Macros for internal actions contain the reason why an item, an LLD-rule, or a trigger became unsupported:
- {ITEM.STATE.ERROR} - for item-based internal notifications;
- {LLDRULE.STATE.ERROR} - for LLD-rule based internal notifications;
- {TRIGGER.STATE.ERROR} - for trigger-based internal notifications.
For more details, see Supported macros.
Simple macros replaced by expression macros
A new expression syntax for triggers and calculated items was introduced in Zabbix 5.4. However, the old syntax still remained in use in simple macros. In the new version, the functionality of simple macros has been transferred to expression macros and the new expression syntax is used. See the comparison below for details of the change:
| In Zabbix 6.0 | Before Zabbix 6.0 |
|---|---|
{?avg(/host/key,1h)}Example of an expression macro in the new version. |
{host:key.avg(1h)}Example of a simple macro in previous versions. |
The existing simple macros will be converted to expression macros during the upgrade. The scope of expression macros covers the same that was offered by simple macros. Thus, expression macros can be used in:
- problem notifications and commands
- problem update notifications and commands
- map element labels
- map link labels
- map shape labels
- graph names
Positional macros no longer supported
The support for positional macros in item name ($1, $2...$9), deprecated since Zabbix 4.0, has been fully removed.
User macros in item name no longer supported
The support for user macros in item names (including discovery rule names), deprecated since Zabbix 4.0, has been fully removed.
Databases
To create the optimal user experience and ensure the best Zabbix performance in various production environments, the support of some older database releases has been dropped. This primarily applies to the database versions that are nearing their end of service life point and versions with unfixed issues that may interfere with normal performance.
Starting from Zabbix 6.0, the following database versions are officially supported:
- MySQL/Percona 8.0.X
- MariaDB 10.5.X - 10.6.X
- PostgreSQL 13.X - 14.X
- Oracle 19c - 21c
- TimescaleDB 2.0.1-2.3
- SQLite 3.3.5-3.34.X
By default, Zabbix server and proxy will not start if an unsupported database version is detected. It is now possible, though not recommended, to turn off DB version check by modifying AllowUnsupportedDBVersions configuration parameter for the server or proxy.
Primary keys
Primary keys are now used for all tables, including history tables, in new installations.
There is no automatic upgrade to primary keys for existing installations. Instructions for a manual upgrade of history tables to primary keys in pre-existing installations are available for MySQL/MariaDB, PostgreSQL, TimescaleDB v1 and v2, and Oracle.
utf8mb4 support for MySQL
utf8mb4 encoding with utf8mb4_bin collation is now supported for Zabbix installations with the MySQL/MariaDB database.
Previously only utf8 encoding was supported, which with MySQL stands for utf8mb3 encoding and thus supports only a subset of proper UTF-8 characters. In the new version utf8mb4 support has been added with support for the full UTF-8 character set. Old installations using utf8mb3 are kept intact and may continue using that encoding.
See also instructions on executing utf8mb4 conversion post-upgrade to 6.0.
Processes
User parameter reload without agent restart
User parameters now can be reloaded from the configuration file without
restarting the agent. To do so, run the new userparameter_reload
runtime control option, e. g.:
zabbix_agentd -R userparameter_reloador
zabbix_agent2 -R userparameter_reloadUserParameter is the only agent configuration option that will be reloaded with this command.
PCRE2 support
Support for PCRE2 has been added and Zabbix installation packages for RHEL 7 and newer, SLES (all versions), Debian 9 and newer, Ubuntu 16.04 and newer have been updated to use PCRE2. PCRE is still supported, but Zabbix can only be compiled with one of the libraries PCRE or PCRE2, both cannot be used at the same time.
Zabbix get and Zabbix sender timeout
Zabbix get and Zabbix sender utilities now support a -t <seconds> or
--timeout <seconds> timeout parameter. The valid range is:
- 1-30 seconds for Zabbix get (default: 30 seconds)
- 1-300 seconds for Zabbix sender (default: 60 seconds)
Extended SNMP gateway functionality
SNMP gateway can now provide information about triggers in a problem state and reveal host information in trigger details.
Additionally, it is now possible to limit the rate of SNMP traps sent by SNMP gateway.
The list of supported OIDs has been extended with a new OID .10 for a comma-delimited list of trigger hostnames.
New parameters have been added to the SNMP gateway configuration file:
- ProblemBaseOID - OID of the problem trigger table;
- ProblemMinSeverity - minimum severity, triggers having lower severity will not be included;
- ProblemHideAck - if specified, only triggers with unacknowledged problems will be included;
- ProblemTagFilter - if specified, only triggers with the specified tag name will be included;
- TrapTimer - if set, Zabbix will send no more than one trap of the highest severity in the given time frame.
For details, see Zabbix SNMP Gateway.
Separate processing for ODBC checks
Processing ODBC checks has been moved from regular poller processes to separate server/proxy processes ODBC pollers. This change allows limiting the number of connections to the database created by poller processes. Previously, ODBC checks were performed by regular pollers, which also work with Zabbix agent items, SSH checks, etc.
A new configuration parameter StartODBCPollers has been added to Zabbix server and proxy configuration files.
You can use internal item zabbix[process,<type>] to monitor ODBC pollers load.
Runtime command transfer
Zabbix server and proxy runtime commands are now sent via socket instead of Unix signals. This change allowed to improve user experience working with runtime control options:
- Results of the command execution are now printed to the console.
- It is possible to send longer input parameters, such as HA node name instead of node number.
Runtime controls on BSD-based OS
Previously, Zabbix server and Zabbix proxy runtime control options were not supported on BSD-based systems. Changing the runtime command transfer method has allowed to withdraw this limitation. Now the majority of the commands are supported on, FreeBSD, NetBSD, OpenBSD, and other operating systems from the *BSD family.
For the exact list, see Runtime control for Zabbix server or proxy.
Zabbix agent 2 plugins
Separate configuration files
Each Zabbix agent 2 plugin now has a separate configuration file. By
default, these files are located in the ./zabbix_agent2.d/plugins.d/ directory. The path is specified in the Include
parameter of the agent 2 configuration file and can be relative to the
zabbix_agent2.conf or
zabbix_agent2.win.conf file location.
External plugin loader
Previously, plugins could only be compiled into Zabbix agent 2, which required recompiling the agent every time you need to change the set of available plugins. Now, with the addition of the external plugin loader, plugins don't have to be integrated into the agent 2 directly and can be added as separate external add-ons (loadable plugins), thus making the creation process of additional plugins for gathering new monitoring metrics easier.
Introduction of loadable plugins caused the following configuration parameter changes:
- Plugins.<PluginName>.Path parameter has been moved to Plugins.<PluginName>.System.Path.
- Plugins.<PluginName>.Capacity parameter, while still supported, has been deprecated, please use Plugins.<PluginName>.System.Capacity instead.
Templates
New official templates are available for monitoring.
Kubernetes
- Kubernetes nodes by HTTP
- Kubernetes cluster state by HTTP
- Kubernetes API server by HTTP
- Kubernetes Controller manager by HTTP
- Kubernetes Scheduler by HTTP
- Kubernetes kubelet by HTTP
To enable Kubernetes monitoring, you need to use the new tool Zabbix Helm Chart, which installs Zabbix proxy and Zabbix agents in the Kubernetes cluster.
To learn more about configuring templates, see HTTP template operation.
Mikrotik
- MikroTik <device model> SNMP - 53 new model-specific templates for monitoring various models of MikroTik ethernet routers and switches, see full list;
- Mikrotik SNMP - a generic template for monitoring MikroTik devices.
You can get these templates:
- In Configuration → Templates in new installations;
- When upgrading from previous versions, the latest templates can be downloaded from the Zabbix Git repository and manually imported into Zabbix in the Configuration → Templates section. If a template with the same name already exists, check the Delete missing option before importing to achieve a clean import. This way the items that have been excluded from the updated template will be removed (note that history of the deleted items will be lost).
Notifications
Webhook integrations
A new integration is available allowing to use the webhook media type for creating Github issues from Zabbix notifications.
Notification about canceled escalations
When configuring action operations, it is now possible to cancel notifications about canceled escalations by unmarking the checkbox of the corresponding option.
Frontend
Password requirements
Custom password complexity requirements can now be provided for Zabbix internal authentication method. To prevent Zabbix users from setting weak passwords, it is possible to enforce the following restrictions:
- Set the minimum password length.
- Require a password to contain a combination of uppercase and lowercase letters, digits, and/or special characters.
- Prohibit usage of most common and easily guessable passwords.
Audit log
Records
The audit log now contains records about all configuration changes for all Zabbix objects, including changes that occurred as a result of executing an LLD rule, a network discovery action, an autoregistration action, or a script execution. Previously, configuration changes initiated from Zabbix server, for example, as a result of executing a discovery rule, were not recorded. Now such object modifications will be stored as audit records attributed to the user System.
Record filter
A functionality for filtering records by the frontend operation that caused these entries has been added. If several log records have been created as a result of a single operation, for example, linking/unlinking a template, such records will have the same Recordset ID.
Audit settings
New section Audit log has been added to the Administration→General menu allowing to enable or disable audit logging. Housekeeping settings for audit, previously located under the Housekeeper section, have also been moved to the new Audit log section.
Template linking more visible
To make template linking more visible, it is now placed in the first tab of the host, host prototype and template configuration forms and host/template mass update forms.
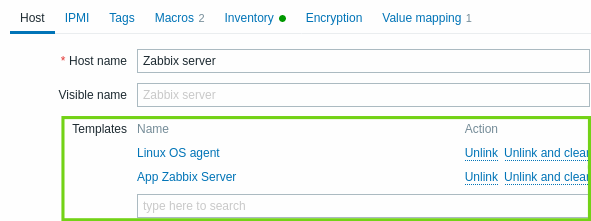
Consequently, a separate tab for template linking has been removed from all the respective forms.
In a related development, in host prototype configuration the fields for host group/host group prototype selection have also been moved from a separate tab to the first tab.
Subfilter in latest data
A subfilter has been added in the Latest data section. The subfilter is useful for a quick one-click access to groups of related items.
The subfilter shows clickable links allowing to filter items based on a common entity - the host, tag name or tag value. As soon as the entity is clicked, items are immediately filtered.
For more details, see the latest data section.
Usability improvements to custom graphs
The graph page in Monitoring → Hosts → Graphs has seen several usability improvements:
- There is no longer a 20 graph limit in the page
- A subfilter has been added allowing to quickly select groups of related graphs based on a common tag or tag value
- Simple graphs for the host can be displayed alongside custom graphs
For more details, see the graph page.
Creating hosts from Monitoring
It is now also possible to create new hosts from Monitoring → Hosts.
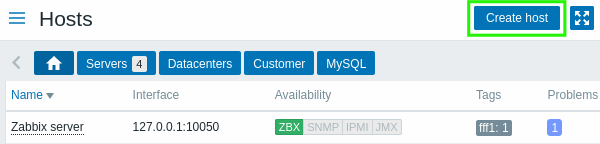
The Create host button is available for Admin and Super Admin users.
Host editing as popup
The form for host creation and editing is now opened in a modal (popup) window, in Configuration → Hosts, Monitoring → Hosts and in any page, where there is a host menu or other direct link to the host configuration.
Direct links to the host edit page still work and are opening the host edit page in full page.
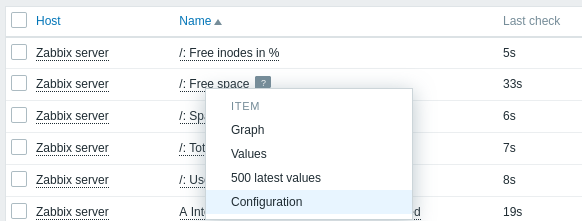
Better navigation between item configuration and latest data
A new context menu for items has been introduced in Latest data allowing to access the item configuration and available graphs:
Conversely, a new context menu has been introduced in the item list in configuration menu allowing to access the latest data for the item and other useful options:
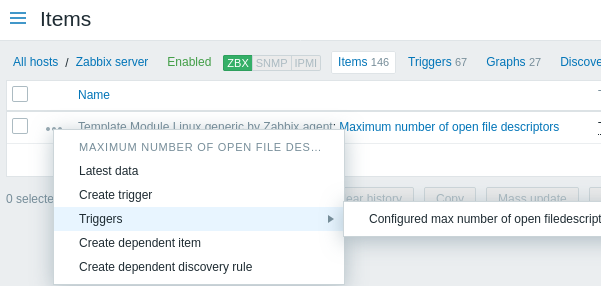
This menu replaces the wizard option in previous versions. A similar menu has also been introduced for template items and item prototypes.
Monitoring → Latest data updated
Several improvements have been made to the Latest data section:
- Time since last check (for example, 1m 20s) is now displayed instead of the last item execution time.
- Hovering over an item's last value will show the raw value without units or value mapping applied.
- If a host is in maintenance, an orange wrench icon will be visible next to the host name.
Monitoring → Overview removed
The Overview section in the Monitoring menu has been removed completely. The same functionality can be still accessed by using the Data overview and Trigger overview dashboard widgets.
Miscellaneous
- Maximum field size has been increased for the following fields:
- Item preprocessing parameters
- Media type message
- The default language of Zabbix web interface has been changed from British to American English. Support of British English has been dropped.
- The Share link in the main menu has been replaced by an Integrations link, leading to the Integrations page on the Zabbix website.
- If Zabbix web interface is opened in one of the languages available on the Zabbix website, clicking the Integrations link will open the Integrations page in the appropriate language. For all other languages, including English, the Integrations page will be opened in English.
- A custom expression, used in action configuration for calculating conditions, now can be up to 1024 characters long (previously 255).
- Monitoring->Hosts section now shows link to host problems screen even if no problems are currently open.
Breaking changes
Audit log
In order to implement the changes in audit log functionality, the previously existing database structure
had to be reworked. During the upgrade auditlog and auditlog_details DB tables will be replaced by the new table
auditlog with a different format. Existing audit log records will be deleted.
Supported DB versions check
Zabbix server and proxy will now check the database version before launch and will not start if the version is out of the supported range. For more details, see databases.
PCRE2 support
Zabbix now supports both PCRE and PCRE2. Zabbix packages for RHEL 7 and newer, SLES (all versions), Debian 9 and newer, Ubuntu 16.04 and newer have been updated to compile with PCRE2 instead of PCRE. When compiling from sources, users can choose to specify ''--with-libpcre'' or ''--with-libpcre2'' flag. If you are upgrading an existing installation, changing PCRE to PCRE2 may lead to some regular expressions behaving differently - see Known issues for details.