
On this page
13 Host availability
Overview
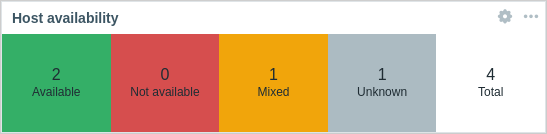
In the host availability widget, high-level statistics about host availability are displayed in colored columns/lines, depending on the chosen layout.
Horizontal display (columns):
Vertical display (lines):
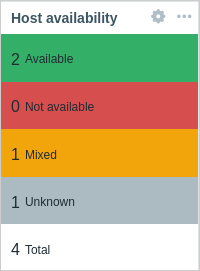
Host availability in each column/line is counted as follows:
- Available - hosts with all interfaces available
- Not available - hosts with all interfaces not available
- Mixed - hosts with at least one interface unavailable and at least one either available or unknown; others can have any value, including "unknown"
- Unknown - hosts with at least one interface unknown (none unavailable)
- Total - total of all hosts
For Zabbix agent (active checks), the Mixed cell will always be empty since this type of items cannot have multiple interfaces.
Configuration
To configure, select Host availability as type:
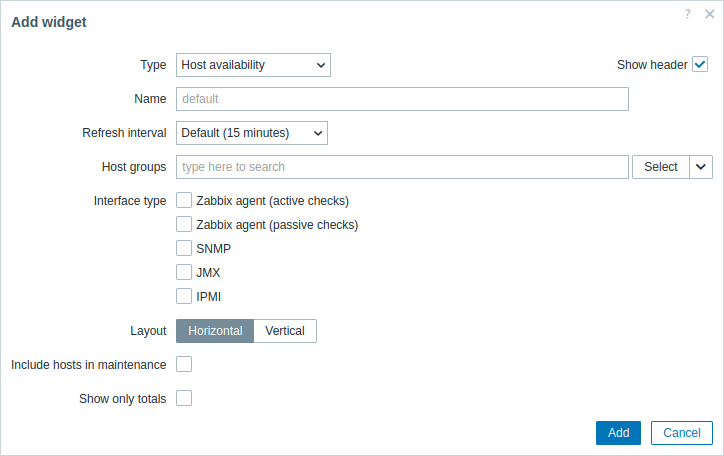
In addition to the parameters that are common for all widgets, you may set the following specific options:
| Host groups | Select host groups. Alternatively, select a compatible widget as the data source for host groups. This field is auto-complete, so starting to type the name of a group will offer a dropdown of matching groups. This parameter is not available when configuring the widget on a template dashboard. |
| Interface type | Select which host interfaces you want to see availability data for. Availability of all interfaces is displayed by default if nothing is selected. |
| Layout | Select horizontal display (columns) or vertical display (lines). |
| Include hosts in maintenance | Include hosts that are in maintenance in the statistics. This parameter is labeled Show data in maintenance when configuring the widget on a template dashboard. |
| Show only totals | If checked, the total of hosts, without breakdown by interfaces, is displayed. This option is disabled if only one interface is selected. |