
- 5 What's new in Zabbix 7.0.0
- AGPL-3.0 license
- Software update check
- Asynchronous pollers
- Browser monitoring
- Proxy load balancing and high availability
- Proxy memory buffer
- JIT user provisioning
- Configurable timeouts per item
- Oracle DB deprecated
- JSON protocol for passive agent checks
- Unified agent/agent2 protocols
- Flexible/scheduling interval support in active checks
- Automatic disabling of lost resources
- Sending data to Zabbix server via Zabbix API
- Scripts
- Performance
- Widgets
- Gauge
- Pie chart
- Honeycomb
- Top triggers
- Item history and Plain text
- Host navigator and Item navigator
- Communication framework for widgets
- Time periods for aggregation in item value/top hosts widgets
- Expanded widget availability on template dashboards
- Extended sorting in Top hosts widget
- Increased functionality of Host availability widget
- Variable legend size in Graph widget
- Functions
- Items
- Consistent default history storage period
- Floating point values trimmed for integer items
- Counting of lines in Windows event log
- Asynchronous single-OID SNMP requests
- Internal items
- New and updated agent items
- Simple checks
- Logging of duplicate SNMPv3 Engine IDs
- Documentation link for each standard item
- Preprocessing
- Macros
- Scheduled reports
- Notifications
- Databases
- Processes
- Discovery
- Connectors
- Templates
- Frontend
- Multi-factor authentication
- US time format
- Cloning simplified
- Icons replaced by fonts
- Modal forms
- Collapsible advanced configuration
- Improved menu section for top triggers
- Increased character limit for configuration fields
- Item and preprocessing test result truncation
- Host dashboards tabs
- Audit log
- Latest data filter
- Minimum required PHP version
- Renamed elements
- Miscellaneous
- Plugins
- Installation
5 What's new in Zabbix 7.0.0
See breaking changes for this version.
AGPL-3.0 license
Zabbix software is now is written and distributed under the AGPL-3.0 license (previously GPL v2.0 license).
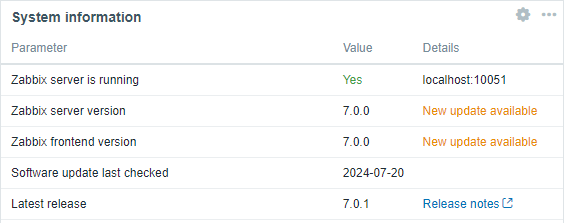
Software update check
A software update check is now added by default to new and existing installations - Zabbix frontend will communicate to the public Zabbix endpoint to check for updates.
The news about available Zabbix software updates are displayed in Reports -> System information and (optionally) in the System Information dashboard widget.
You can disable the software update check by setting AllowSoftwareUpdateCheck=0 in server configuration.
Asynchronous pollers
New poller processes have been added capable of executing multiple checks at the same time:
agent pollerhttp agent pollersnmp poller(forwalk[OID]andget[OID]items)
These pollers are asynchronous - they are capable of starting new checks without the need to wait for a response, with concurrency that is configurable up to 1000 concurrent checks.
Asynchronous pollers have been developed because, in comparison, the synchronous poller processes can execute only one check at the same time and most of their time is spent on waiting for the response. Thus the efficiency could be increased by starting new parallel checks while waiting for network response, and the new pollers do that.
You can start asynchronous agent pollers by modifying the value of StartAgentPollers - a new server/proxy parameter. HTTP agent pollers can be started by modifying StartHTTPAgentPollers respectively. SNMP pollers can be started by modifying StartSNMPPollers respectively.
The maximum concurrency for asynchronous pollers (agent, HTTP agent and SNMP) is defined by MaxConcurrentChecksPerPoller.
Note that after the upgrade all agent, HTTP agent and SNMP walk[OID] checks will be moved to asynchronous pollers.
As part of the development, the persistent connections cURL feature has been added to HTTP agent checks.
Browser monitoring
A new item type - Browser item - has been added to Zabbix, enabling the monitoring of complex websites and web applications using a browser. Browser items allow the execution of user-defined JavaScript code to simulate browser-related actions such as clicking, entering text, navigating through web pages, etc.
This item collects data over HTTP/HTTPS and partially implements the W3C WebDriver standard with Selenium Server or a plain WebDriver (for example, ChromeDriver) as a testing endpoint.
Note that the support of Browser items is currently experimental.
Additionally, this feature adds the Website by Browser template and new elements to configuration export/import, Zabbix server/proxy configuration files, timeouts, and the zabbix_js command-line utility.
For more information, see Upgrade notes to 7.0.0.
Proxy load balancing and high availability
Proxy load balancing is implemented by introducing proxy groups in Zabbix. Proxy groups provide automatic distribution of hosts between proxies, proxy load re-balancing and high availability - when a proxy goes offline, its hosts are immediately distributed among other proxies in the group.
For more information, see proxy load balancing and high availability.
Proxy memory buffer
A memory buffer has been developed for Zabbix proxy. The memory buffer allows to store new data (item values, network discovery, host autoregistration) in the buffer and upload to Zabbix server without accessing the database.
In installations before Zabbix 7.0 the collected data was stored in the database before uploading to Zabbix server. For these installations this remains the default behavior after the upgrade.
For optimized performance, it is recommended to configure the use of memory buffer on the proxy. This is possible by modifying the value of ProxyBufferMode from "disk" (hardcoded default for existing installations) to "hybrid" (recommended) or "memory". It is also required to set the memory buffer size (ProxyMemoryBufferSize parameter).
In hybrid mode the buffer is protected from data loss by flushing unsent data to the database if the proxy is stopped, the buffer is full or data too old. When all values have been flushed into database, the proxy goes back to using memory buffer.
In memory mode, the memory buffer will be used, however, there is no protection against data loss. If the proxy is stopped, or the memory gets overfilled, the unsent data will be dropped.
The hybrid mode (ProxyBufferMode=hybrid) is applied to all new installations since Zabbix 7.0.
Additional parameters such as ProxyMemoryBufferSize and ProxyMemoryBufferAge define the memory buffer size and the maximum age of data in the buffer, respectively.
New internal items have been added to monitor the proxy memory buffer.
JIT user provisioning
Previously provisioned users were limited only to the media created during provisioning without the flexibility of editing such properties as working hours or severities.
Now more flexibility is available for provisioned users in Zabbix:
- provisioned user media can be disabled/enabled;
- provisioned user media fields such as When active, Use if severity and Enabled can be manually edited;
- additional user media can be added (for example, additional email addresses) for provisioned users manually;
- manually added user media can be deleted (provisioned user media cannot).
Additionally, when configuring user media mapping for provisioning such fields as When active, Use if severity and Enabled are now available. Note that changes to user media type mapping form will take effect only for new media created during provisioning.
Configurable timeouts per item
Timeout configuration per item is now available for more item types (see supported item types). In addition to setting the timeout values on the item level, it is possible to define global and proxy timeouts for various item types.
Timeouts configured on the item level have the highest priority. By default, global timeouts are applied to all items; however, if proxy timeouts are set, they will override the global ones.
Oracle DB deprecated
The support for Oracle as a backend database has been deprecated and is expected to be completely removed in future versions.
JSON protocol for passive agent checks
A JSON-based protocol for passive agent checks has been implemented.
For compatibility with older agents, a failover to the old plaintext protocol has been added. If the agent returns "ZBX_NOTSUPPORTED", Zabbix will cache the interface as old protocol and retry the check by sending only the plaintext item key.
Zabbix get can now be run with a new option -P --protocol <value> where "value" is either:
- auto - connect using JSON protocol, fall back and retry with plaintext protocol (default);
- json - connect using JSON protocol key;
- plaintext - connect using plaintext protocol where just the item key is sent.
If an item key is not supported, Zabbix get will return the exit code 1.
Unified agent/agent2 protocols
Zabbix agent and agent 2 protocols have been unified by switching Zabbix agent to Zabbix agent 2 protocol. The difference between Zabbix agent and Zabbix agent 2 requests/responses is expressed by the "variant" tag value ("1" - Zabbix agent, "2" - Zabbix agent 2).
See also: Passive and active agent checks.
Flexible/scheduling interval support in active checks
Flexible/scheduling intervals are now supported in active checks by both Zabbix agent and Zabbix agent 2 (previously only Zabbix agent 2).
Automatic disabling of lost resources
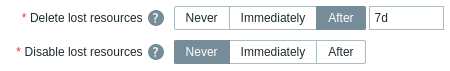
Resources that are no longer discovered by low-level discovery now can be disabled automatically. They can be disabled immediately, after a specified time period or never (see the new Disable lost resources parameter in the discovery rule configuration).
Lost resources (hosts, items, triggers) are marked by an icon in the info column. The tooltip text provides details on their status.
Within the same development the Keep lost resources period parameter was renamed to Delete lost resources with options to delete immediately, after a specified time period or never.
Sending data to Zabbix server via Zabbix API
Previously sending specific data to Zabbix server was possible using the Zabbix sender utility or by implementing a custom JSON-based communication protocol similar to that used in Zabbix sender.
Now it is also possible to send data to Zabbix server via HTTP protocol using the history.push API method.
Note that receiving sent data requires a configured trapper item or an HTTP agent item (with trapping enabled).
In addition, correct history.push operations are recorded in Reports → Audit log that has additional filtering options (a new Push action and History resource),
and the history.push API method is also available in the Allow/Deny list of API methods when configuring a user role.
Scripts
Script execution on active agents
It is now possible to execute scripts on agents operating in active mode. Once the script execution is triggered by action operation or manual script execution, the command is included in active check configuration and executed once the active agent receives it.
Manual scripts are sent to the active agent along with the server/proxy timeout for script execution. Please increase the default server/proxy timeout for script execution. The timeout must be higher than the active check refresh frequency, otherwise the timeout is exceeded before the active agent receives the script and is able to return the result.
Note that older active agents ignore any remote commands included in the active checks configuration. For more information, see Passive and active agent checks.
Manual user input for scripts
Manual user input for frontend scripts allows to supply a custom parameter on each execution of the script. This saves the necessity to create multiple similar user scripts with only a single parameter difference.
For example, you may want to supply a different integer or a different URL address to the script during execution.
To enable manual user input:
- use the {MANUALINPUT} macro in the script (commands, script, script parameter) where required; or in the URL field of URL scripts;
- in advanced script configuration, enable manual user input and configure input options:
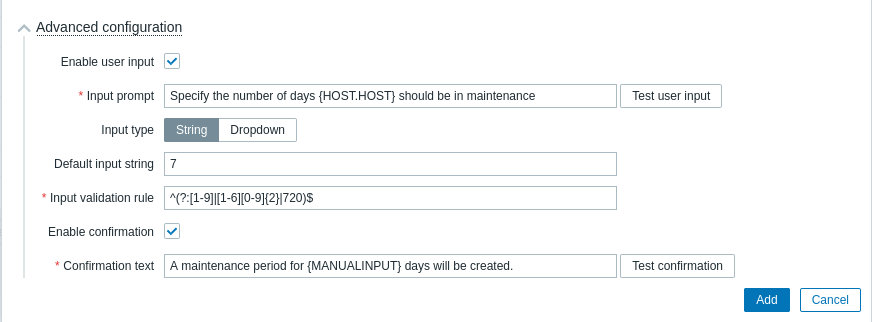
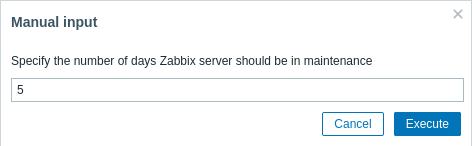
With user input enabled, before script execution, a Manual input popup will appear to the user asking to supply a custom value. The supplied value will replace {MANUALINPUT} in the script.
Depending on the configuration, the user will be asked to enter a string value or select the value from a dropdown of pre-determined options.
Performance
Faster reaction to host maintenance period update
Previously maintenances were recalculated only every minute causing a possible latency of up to 60 seconds for starting or stopping a maintenance period.
Now maintenances are still recalculated every minute or as soon as the configuration cache is reloaded if there are changes to the maintenance period.
Every second the timer process checks if any maintenances must be started/stopped based on whether there are changes to the maintenance periods after the configuration update. Thus the speed of starting/stopping maintenance periods depends on the configuration update interval (10 seconds by default). Note that maintenance period changes do not include Active since/Active till settings. Also, if a host/host group is added to an existing active maintenance period, the changes will only be activated by the timer process at the start of next minute.
Faster permission checks
Permission checks have been made much faster by introducing several intermediary tables for checking non-privileged user permissions.
These tables keep hashes (SHA-256) of user group sets and host group sets for each user/host respectively. Additionally, there is a permission table storing only the accessible combinations of users and hosts, specified by the hash IDs.
This improvement makes the loading of permission-heavy frontend pages (i.e. hosts, problems) much faster. Note that hashes and permissions are not calculated for Super-admin users.
Faster trigger action execution
Trigger action operation, recovery operation and update operation execution on Zabbix server now occurs immediately (less than 100 milliseconds) after a trigger status change, whereas previously users could experience up to 4 seconds of latency.
The reduction in latency is made possible by implementing interprocess communication (IPC) mechanisms between multiple processes (escalator and its escalation‐dispatch module, escalator and alerter, preprocessing manager and history syncer).
Widgets
Several new widgets have been added in the new version, while the available functionality in others has been enhanced. Additionally, dashboard widgets can now connect and communicate with each other, making widgets and dashboards more dynamic.
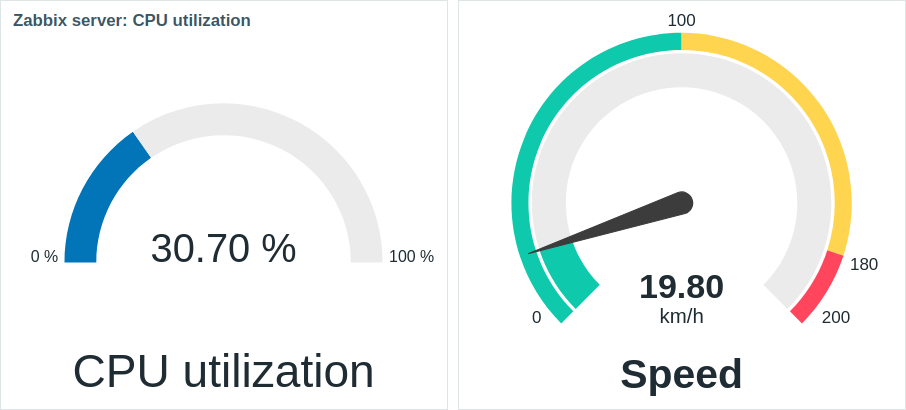
Gauge
A Gauge widget has been added to dashboard widgets, allowing to display the value of a single item as a gauge. For more information, see Gauge.
Pie chart
A Pie chart widget has been added to dashboard widgets, allowing to display values of selected items as:
- pie chart;
- doughnut chart.
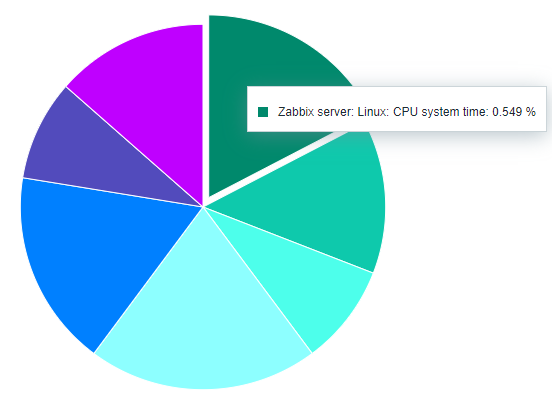 Pie chart. |
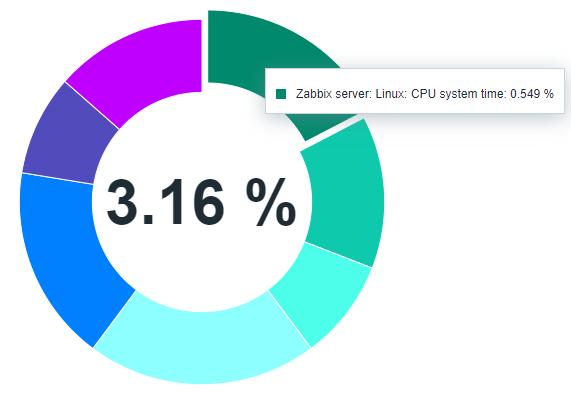 Doughnut chart. |
For more information, see Pie chart.
As part of this development, a Show aggregation function checkbox has been added to the graph widget configuration (in Legend tab).
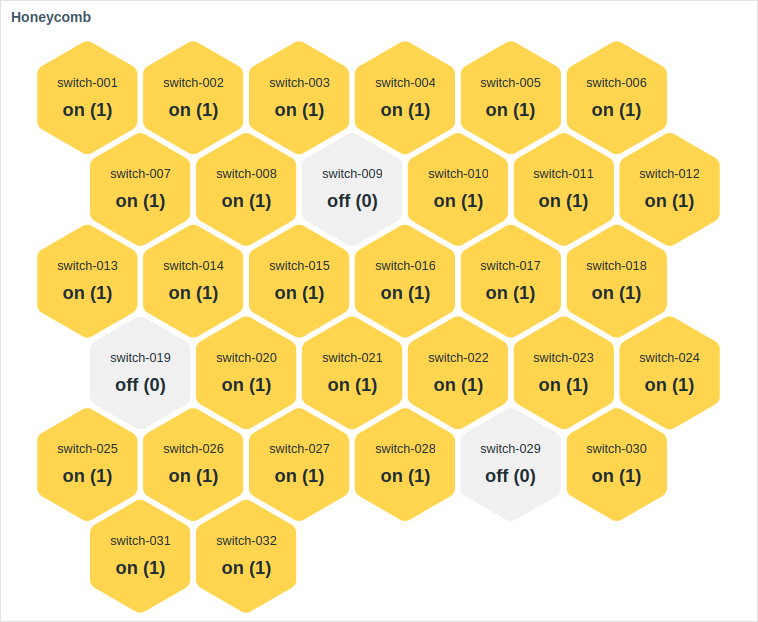
Honeycomb
A Honeycomb widget has been added to dashboard widgets, which offers a dynamic and vibrant overview of the monitored network infrastructure and resources, where host groups, such as virtual machines and network devices, along with their respective items, are visually represented as interactive hexagonal cells. For more information, see Honeycomb.
Top triggers
A Top triggers widget has been added to dashboard widgets, which allows viewing the triggers with the highest number of problems.
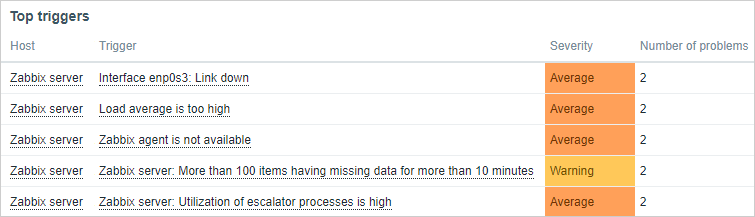
For more information, see: Top triggers.
Item history and Plain text
The new Item history dashboard widget has replaced the Plain text widget, offering several improvements.
Unlike the Plain Text widget, which only displayed the latest item data in plain text, the Item History widget supports various display options for multiple item types (numeric, character, log, text, and binary). For example, it can show progress bars or indicators, images for binary data types (useful for browser items), and highlight text values (useful for log file monitoring).
For more information, see Item history. For details about the replacement of the Plain text widget, see Upgrade notes for 7.0.0.

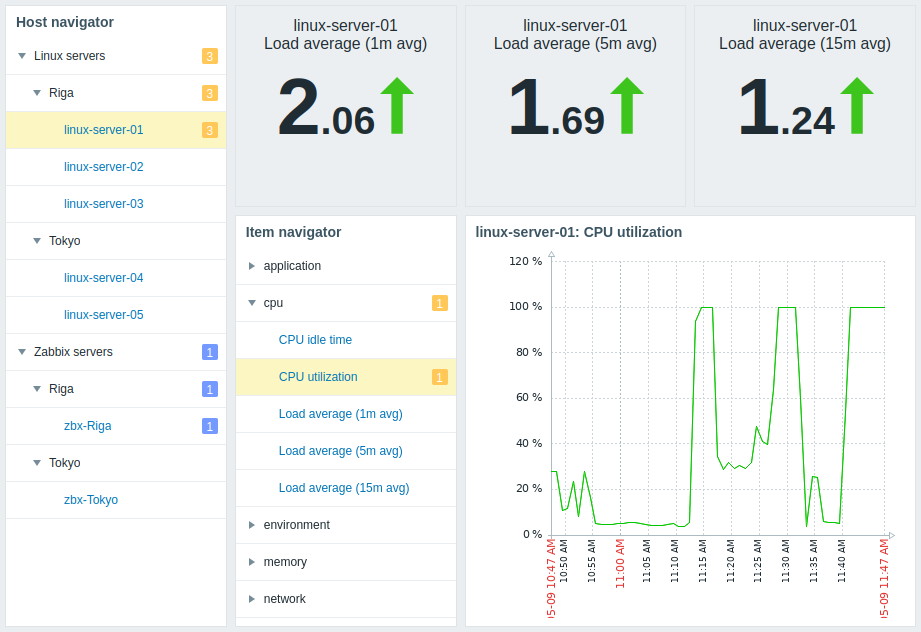
Host navigator and Item navigator
Host navigator and Item navigator widgets have been added to dashboard widgets. These widgets display hosts or items, respectively, based on various filtering and grouping options, and allow to control the information displayed in other widgets based on the selected host or item. For more information, see Host navigator and Item navigator.
Communication framework for widgets
Dashboard widgets can now connect and communicate with each other, making widgets and dashboards more dynamic. Multiple widgets have parameters that enable them to share configuration data between compatible widgets or the dashboard.
This feature introduces the following changes:
- Host groups, Hosts, and Item parameters allow you to select either the respective entities or a data source providing them.
- Enable host selection parameter has been replaced with the Override host parameter, which allows you to select a data source that provides hosts.
- Time period parameter has been added to multiple widgets, which allows you to select a data source that provides a time period.
- Map parameter in Map widget allows to select either a map or another widget as a data source for maps.
- Graph parameter in Graph (classic) widget allows to select either a graph or another widget as a data source for graphs.
Depending on the widget and its parameters, the data source can be either a compatible widget from the same dashboard or the dashboard itself. For more information, see Dashboard widgets.
For changes to stock templates that are shipped with Zabbix, see Template changes.
Time periods for aggregation in item value/top hosts widgets
Time periods now can be configured in the Item value and Top hosts widgets.
It is also now possible to display an aggregated value in the item value widget for the chosen period. The aggregated value can be displayed as:
- minimum
- maximum
- average
- count
- sum
- first
- last
These added features are useful for creating data comparison widgets. For example, in one widget you may display the latest value, while in another the average value for a longer period. Or several widgets can be used for side-by-side comparison of aggregated values from various periods in the past.
Expanded widget availability on template dashboards
Previously, on a template dashboard, you could create only the following widgets: Clock, Graph (classic), Graph prototype, Item value, Plain text, URL.
Now template dashboards support the creation of all widgets.
Extended sorting in Top hosts widget
Now, besides sorting by Item value, it is also possible to set Host name or Text column as the order column in Top hosts widget.
Increased functionality of Host availability widget
Host availability widget now allows displaying the hosts with Zabbix agent (active checks) interface. One more availability status has been added, i.e., Mixed, which corresponds to the situation when at least one interface is unavailable and at least one is either available or unknown. Moreover, the possibility to see only the total of hosts, without breakdown by interfaces, has been introduced.
Variable legend size in Graph widget
The Graph widget now supports configuring a variable number of legend rows determined by the number of configured items.
Functions
New functions
New functions have been added for use in trigger expressions and calculated items:
- jsonpath() - returns the JSONPath result;
- xmlxpath() - returns the XML XPath result.
See also: String functions
Updated functions
Several functions have been updated:
- Aggregate functions now also support non-numeric types for calculation. This may be useful, for example, with the count and count_foreach functions.
- The count and count_foreach aggregate functions support optional parameters operator and pattern, which can be used to fine-tune item filtering and only count values that match given criteria.
- All foreach functions no longer include unsupported items in the count.
- The function last_foreach, previously configured to ignore the time period argument, accepts it as an optional parameter.
- Supported range for values returned by prediction functions has been expanded to match the range of double data type. Now timeleft() function can accept values up to 1.7976931348623158E+308 and forecast() function can accept values ranging from -1.7976931348623158E+308 to 1.7976931348623158E+308.
Items
Consistent default history storage period
The default period for keeping item history has been made consistent at 31 days in the frontend and in the database. This change affects item, template item and item prototype configuration forms as well as the history storage period override in low-level discovery.
Floating point values trimmed for integer items
Now, if a floating point value is received for an unsigned integer item, the value will be trimmed from the decimal part and saved as an integer. Previously a floating point value would make an integer item unsupported.
Counting of lines in Windows event log
A new eventlog.count item has been added to Zabbix agent/agent 2 on Windows.
This item returns an integer value with the count of lines in the Windows event log based on the specified parameters.
Asynchronous single-OID SNMP requests
A new get[OID] SNMP item has been added allowing to query for a single OID value asynchronously.
Internal items
Internal checks are now handled by a new internal poller Zabbix server/proxy process.
Internal items have been added to monitor the proxy memory buffer:
zabbix[proxy_buffer,buffer,<mode>]- returns the proxy memory buffer usage statistics;zabbix[proxy_buffer,state,changes]- returns the number of state changes between disk/memory buffer modes since start;zabbix[proxy_buffer,state,current]- returns the current working state where the new data are being stored.
The following internal items have also been added:
zabbix[discovery_queue]- allows to monitor the number of discovery checks in the queue;zabbix[vps,written]- allows to monitor the total number of history values written to database.
New and updated agent items
New items have been added to Zabbix agent/agent 2:
net.dns.perfitem returns the number of seconds spent waiting for a response from a service, timing thenet.dnsitem execution.net.dns.getZabbix agent 2 item returns detailed DNS record information.
The following Zabbix agent/agent 2 items have been updated:
net.dnsandnet.dns.recorditems now accept the DNS name in reversed and non-reversed format when performing reverse DNS lookups;proc.getitems in "process" and "summary" mode now also return the PSS (proportional set size) memory on Linux;system.sw.packagesandsystem.sw.packages.getitems are now supported on Gentoo Linux;system.hostnameitem can now return a Fully Qualified Domain Name, if the new fqdn option is specified in the type parameter;wmi.getandwmi.getallitems used with Zabbix agent 2 now return JSON with boolean values represented as strings (for example,"RealTimeProtectionEnabled": "True"instead of"RealTimeProtectionEnabled": truereturned previously) to match the output format of these items on Zabbix agent;oracle.ts.discoveryZabbix agent 2 item now returns a new {#CON_NAME} LLD macro with container name;oracle.ts.statsZabbix agent 2 item has a new conname parameter to specify the target container name. The JSON format of the returned data has been updated. When no tablespace, type, or conname is specified in the key parameters, the returned data will include an additional JSON level with the container name, allowing differentiation between containers.
Simple checks
The vmware.eventlog item now supports optional filtering by severity in the third parameter.
The vmware.vm.discovery item now also returns data on virtual machine network interfaces.
This data can be used to configure custom host interfaces.
The vmware.vm.net.if.discovery item now also returns an array of network interface addresses.
A new options parameter has been added to the following items:
This parameter can be used to specify whether redirected responses should be treated as target host up or target host down. See simple checks for more details.
Logging of duplicate SNMPv3 Engine IDs
Engine IDs in SNMPv3 are used as unique identifiers of the device. Sometimes Engine IDs are the same in several devices because of misconfiguration or factory settings. As SNMP standards require Engine IDs to be unique, items sharing the same Engine ID become unsupported in Zabbix leading to availability issues with these devices.
To help troubleshoot such issues, information about SNMPv3 devices sharing the same Engine ID will now be logged periodically by Zabbix server. Note that duplicate Engine ID detection works in each SNMP poller separately.
Documentation link for each standard item
Each standard item now has a direct link from the frontend to its documentation page.
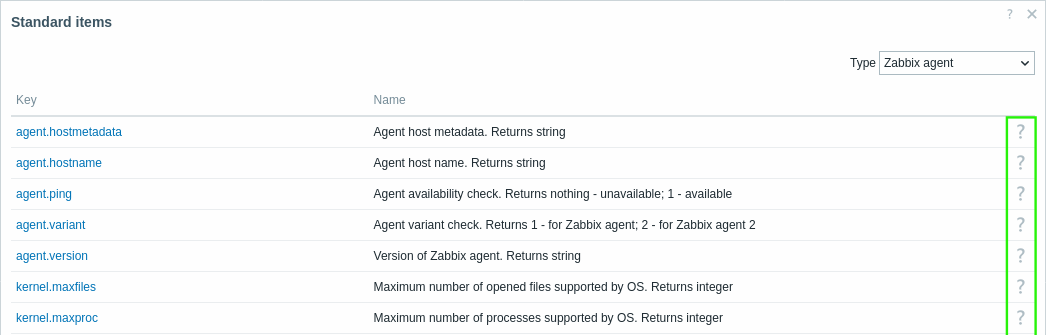
The links are placed under the question mark icon, when opening the item helper window from the item configuration form (click on Select next to the item key field).
Preprocessing
Advanced root-cause handling for unsupported item state
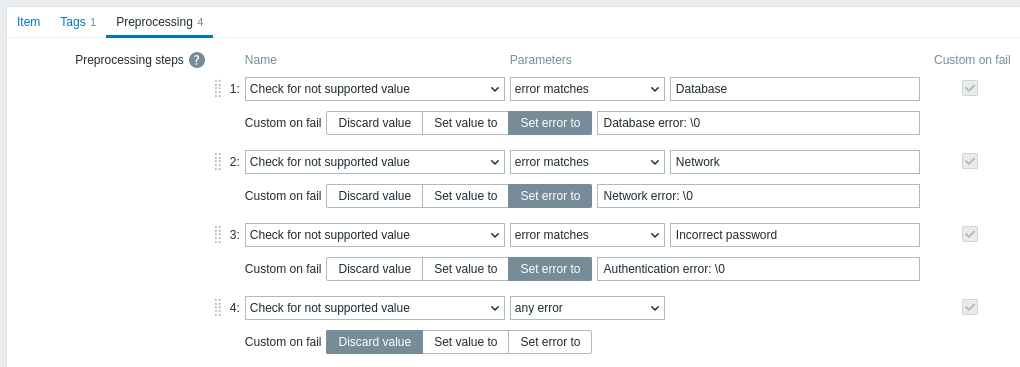
Error handling in case of a failure to retrieve an item value (and thus it becoming unsupported) previously lacked the ability to distinguish the reason or runtime stage where the process failed. All errors had to be handled using one and the same option for error handling - either to discard the value, set a specified value or set a specified error message.
It is now possible to match the error message to a regular expression. If the error matches (or does not match) it is possible to specify how the error case should be processed. For example, a specific error message can be "mapped" to a more general case to be matched for and handled by a further preprocessing step, or some intermittent (e.g., network connectivity) issue can be handled differently to a definite failure to acquire the item value.
Multiple Check for not supported value preprocessing steps can now be added. Note that there can be only one "any error" matching step at the end of the pipeline probing for unsupported state of the item. If present, it is activated if none of the specific checks (mis)matched the according pattern, or a (modified) error message was carried over - i.e., no "Discard value" or "Set value to" override came into effect.
See also: Check for not supported value
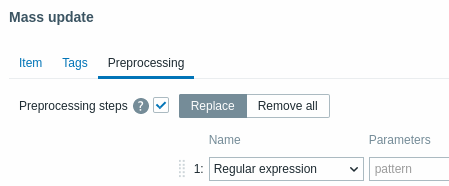
Better usability for preprocessing step mass update
The previous design of the item mass update form was not sufficiently clear if the preprocessing step update would add or replace preprocessing steps. In the new design Replace and Remove all radio buttons have been added, making it clear for users what to expect as the result of preprocessing step mass update:
Macros
User macros supported in item and item prototype names
User macros are now supported in item names and item prototype names.
Note that user macro support was removed from item/item prototype names in Zabbix 6.0. Now it has been restored. It is also now supported to search for item name with the macros resolved, which previously was not supported.
The item name with resolved macros is stored in a separate database table (item_rtname), which is an extension of the items table. For each record in the items table, a corresponding item_rtname record is created (except for item prototypes, discovery rule items and template items). The name with resolved macros is limited to 2048 characters.
The item name with resolved macros is displayed in all frontend locations except the Data collection section.
A new configuration syncer worker server process has been added that is responsible for resolving and synchronizing the user macro values in item names.
Extended support of macro functions
Macro functions are now supported with all types of macros:
Macro functions can be used in all locations supporting the listed macros. This applies unless explicitly stated that only a macro is expected (for example, when configuring host macros or low-level discovery rule filters).
Scheduled reports
The scheduled reports functionality is no longer experimental.
Multi-page reporting
For multi-paged dashboards, reports are now returned with all the pages of the dashboard, with each PDF page corresponding to one dashboard page. Previously this functionality was limited to returning only the first dashboard page.
Notifications
Tag processing support for internal events
The processing of tags returned by the webhook script is now also supported for internal events.
Also, {EVENT.TAGS.<tag name>}, {EVENT.TAGS}, {EVENT.TAGSJSON}, {EVENT.RECOVERY.TAGS}, {EVENT.RECOVERY.TAGSJSON} macros are now supported for internal event notifications.
These changes allow to use webhooks for updating or closing an external issue/support ticket by internal event recovery notification.
Databases
Auditlog converted to hypertable on TimescaleDB
The auditlog table has been converted to hypertable on TimescaleDB in new installations to benefit from automatic partitioning on time (7 days by default) and better performance.
To successfully upgrade existing installations, see Upgrading TimescaleDB schema.
See also: Supported TimescaleDB versions
Separate database table for proxies
Proxy records have been moved out of the hosts table and are now stored in the new proxy table.
Also, operational data of proxies (such as last access, version, compatibility) have been moved out of the host_rtdata table and is now stored in the new proxy_rtdata table.
Processes
Multithreading
Several changes have been made as part of transitioning to a multithreaded architecture:
- A new configure parameter has been added:
--with-stacksize. This parameter allows to override the default thread stack size used by the system (in kilobytes). - User macro resolving has been moved from the preprocessing manager to preprocessing workers.
Server environment hardening
It is now possible to restrict some Zabbix functions to harden the security of the server environment:
- global script execution on Zabbix server can be disabled by setting EnableGlobalScripts=0 in server configuration. For new installations, global script execution on Zabbix server is disabled by default.
- user HTTP authentication can be disabled by setting
$ALLOW_HTTP_AUTH=falsein the frontend configuration file (zabbix.conf.php). - GSM modem for SMS notifications now can be specified in the new SMSDevices parameter limiting the ability to misconfigure the GSM modem path from the frontend.
Configuration file validation
The possibility of configuration file validation has been added to the maintenance commands of Zabbix server, proxy, agent, agent 2, and web service. The validation can be done using the -T --test-config option. In case of successful validation, the exit code will be "0"; otherwise, the component will exit with non-zero exit code and a corresponding error message. Warnings (e.g., in case of a deprecated parameter) will not affect successful exit code.
Detecting cURL library features at runtime
Previously cURL library features were detected at build time of Zabbix server, proxy or agent. If cURL features were upgraded, to make use of them the respective Zabbix component had to be recompiled.
Now only a restart is required for upgraded cURL library features to become available in Zabbix. Recompilation is no longer required. This is true for Zabbix server, proxy or agent.
See also the upgrade notes.
Agent 2 configuration
Buffer size
The default value of the BufferSize configuration parameter for Zabbix agent 2 has been increased from 100 to 1000.
Empty values allowed
Empty values are now allowed in plugin-related configuration parameters on Zabbix agent 2.
Setting Windows agent service startup type
The option to set the startup type of the Zabbix agent/agent 2 Windows service (-S --startup-type) has been added.
This option allows configuring the agent/agent 2 service to start automatically at Windows startup (automatic), after the automatically started services have completed startup (delayed), when started manually by a user or application (manual) or to disable the service entirely (disabled).
When performing Windows agent installation from MSI, the default startup type on Windows Server 2008/Vista and later versions is now delayed if not specified otherwise in the STARTUPTYPE command-line parameter.
This improves the reliability and performance of the Zabbix agent/agent 2 Windows service, particularly during system restarts.
Support for the old numeric type dropped
The old style of floating point values, previously deprecated, is no longer supported, as numeric values of extended range are used.
Vault prefix parameter added to configuration files
The configuration files zabbix_server.conf and zabbix_proxy.conf have been supplemented with a new, optional parameter Vault Prefix; zabbix.conf.php has been supplemented with the optional $DB['VAULT_PREFIX'], and setup.php has been updated accordingly.
The vault paths for CyberArk and HashiCorp are therefore no longer hardcoded to allow for vault deployments with non-standard paths.
Discovery
Concurrency in network discovery
Previously each network discovery rule was processed by one discoverer process. Thus all service checks within the rule could only be performed sequentially.
In the new version the network discovery process has been reworked to allow concurrency between service checks. A new discovery manager process has been added along with a configurable number of discovery workers (or threads).
The discovery manager processes discovery rules and creates a discovery job per each rule with tasks (service checks). The service checks are picked up and performed by the discovery workers. Only those checks that have the same IP and port are scheduled sequentially because some devices may not allow concurrent connections on the same port.
A new zabbix[discovery_queue] internal item allows to monitor the number of discovery checks in the queue.
The StartDiscoverers parameter now determines the total number of
available discovery workers for discovery. The default number of StartDiscoverers has been upped from 1 to 5, and the range from 0-250 to 0-1000.
The discoverer processes from previous Zabbix versions have been dropped.
Additionally:
- All service checks are now performed asynchronously, except for LDAP checks;
- The number of simultaneous asynchronous checks per each service check type (or the number of available workers for all synchronous service checks) is now configurable in the frontend (see Maximum concurrent checks per type). This parameter is optional.
- HTTP service check previously was the same as TCP check. Now HTTP/HTTPs checking is done via libcurl. If Zabbix server/proxy is compiled without libcurl, then HTTP checks will work like previously (i.e. as TCP checks), but HTTPS checks will not work.
- Errors in the network discovery process will now be displayed in the frontend (in Data collection -> Discovery), for example:
- fping errors;
- incorrect SNMP OID;
- incorrect macro for item timeout;
- address range errors.
Adding host tags during discovery/autoregistration
Additional operations are now available for discovery and autoregistration events:
- Add host tags
- Remove host tags
Sharing discovered host groups
Low-level discovery rules can now link already discovered and existing host groups to hosts created by the same low-level discovery rules. This affects host groups previously discovered and created by other low-level discovery rules based on the specified group prototypes.
Connectors
The data streaming functionality is no longer experimental.
Stream selective data and configure attempt intervals
When streaming item values from Zabbix to external systems, you can now configure which item values the connector should stream based on their type of information (numeric (unsigned), numeric (float), character, etc.).
In addition, to avoid unsuccessful attempts to stream item values or events (for example, if the HTTP endpoint is busy or rate-limited), you can now also configure the attempt interval - how long the connector should wait after an unsuccessful attempt to stream data.
201, 202, 203, and 204 HTTP response codes are now also accepted by connectors as success (previously only 200).
Stream data to Apache Kafka
A new tool for streaming data to external systems - the Kafka connector for Zabbix server - is now available. The Kafka connector is a lightweight server written in Go, designed to forward item values and events from a Zabbix server to a Kafka broker.
Templates
For new templates and changes to existing templates, see Template changes.
Frontend
Multi-factor authentication
Multi-factor authentication (MFA) with Time-Based One-Time Password (TOTP) or Duo Universal Prompt authentication method can now be used to sign in to Zabbix, providing an additional layer of security beyond just a username and password.
US time format
Time and date displays in the frontend now conform to the US standard time/date display when the default (en_US) frontend language is used.
| Before | Now |
|---|---|
 |
 |
Cloning simplified
Previously it was possible to Clone and Full clone hosts, templates and maps.
Now the option Clone has been removed, and the option Full clone has been renamed to Clone while still preserving all of the previous functionality of Full clone.
Icons replaced by fonts
All icons in the frontend have been switched from icon image sheets to fonts.
Modal forms
Several frontend forms are now opened in modal (pop-up) windows:
- Network discovery rule configuration;
- Global script configuration;
- Event correlation configuration;
- Module configuration;
- Media type configuration;
- Template configuration;
- Trigger and trigger prototype configuration;
- Item and item prototype configuration.
Collapsible advanced configuration
The Advanced configuration checkboxes, responsible for displaying advanced configuration options, have been replaced with collapsible blocks (see, for example, Connector configuration, Service configuration, Clock widget configuration, etc.). This improves user experience, as collapsing these blocks and saving the configuration will no longer reset the configured advanced options to their default values.
Improved menu section for top triggers
The menu section for viewing the top triggers is now named Top 100 triggers. The possibility to filter triggers by problem name and tags has been added. Also, the number of detected problems instead of the number of status changes is now displayed for each trigger.
Increased character limit for configuration fields
URL fields
The character limit for all URL fields is now 2048 characters. This now includes: Tile URL for settings related to geographical maps, Frontend URL for configuring miscellaneous frontend parameters, URLs for network maps and network map elements, URL A-C for host inventory fields, and URL for the URL dashboard widget.
Authentication fields
The character limit for authentication fields User/User name and Password is now 255 characters. This applies to configuring HTTP authentication for HTTP agent items, web scenarios, and connectors, as well as configuring authentication for simple checks, ODBC monitoring, SSH checks, Telnet checks, and JMX monitoring.
Item and preprocessing test result truncation
When testing items or testing preprocessing steps, values retrieved from a host and test results are now truncated to a maximum size of 512KB when sent to the frontend. Note that data larger than 512KB is still processed fully by Zabbix server.
Host dashboards tabs
All of the configured host dashboards for the selected host are now displayed as tabs under the host dashboards page header, replacing the previous dropdown in the upper right corner. This allows easy transition between various host dashboards and improves navigation through monitoring data.
Audit log
In Administration → Audit log, you can now enable/disable audit logging of low-level discovery, network discovery and autoregistration activities performed by the server (System user).
The default period of storing audit log records before those are deleted by the housekeeper has been changed from 365 days to 31 days.
Latest data filter
In Monitoring → Latest data, the subfilter and data are no longer displayed by default if the filter is not set.
If upgrading from previous Zabbix versions, see also: Upgrade notes for 7.0.0.
Minimum required PHP version
The minimum required PHP version has been raised from 7.4.0 to 8.0.0.
Renamed elements
- Some dashboard widget parameters with the label Tags have been renamed for more clarity: Item tags (for Data overview widget), Scenario tags (for Web monitoring widget); Problem tags (for Graph, Problem hosts, Problems, Problems by severity, and Trigger overview widgets);
- The action link to editing of the map contents, available from the map list in the Monitoring → Maps section, has been renamed from Constructor to Edit;
- The fields for setting history and trend storage periods in the item and item prototype configuration forms have been renamed;
- In Top hosts widget configuration, the fields Order column and Host count have been renamed Order by and Host limit to better describe their functions.
- In Graph widget configuration, the legend field Display min/max/avg has been renamed to Display min/avg/max, and data set fields host pattern and item pattern have been renamed to host patterns and item patterns.
- In User profile settings, the Messaging tab has been renamed to Frontend notifications, in which the Frontend messaging option has also been renamed to Frontend notifications.
Miscellaneous
- Icons of the main menu have been updated;
- Messages indicating the absence of data or unset filters (in widgets or pop-up filters with no data to display) have been updated. Additionally, the "Displaying 0 of 0 found" footer has been removed in cases where there is no data to display or when filtering (or using global search) results in no matches.
- Zabbix frontend and Zabbix server version numbers are now viewable on the System information page;
- All actions where the media type is used are now displayed in the media type list (Used in actions column). Previously actions where the Send only to option in action operation configuration was "All" were not included in the media type Used in actions column;
- New filtering option has been added to Latest data section: it now allows you to filter items by their state (supported/unsupported);
- New Acknowledgement status filtering option has been added to Problems section: it now allows you to filter problems by their state (unacknowledged/acknowledged/acknowledged by me);
- Standard window close button has been added to popup windows intended for configuring and mass updating of the map elements and shapes;
- Configuration of user group permissions and tags for filtering viewable problems has been refined. Now it is possible to select several host/template groups at once for assigning the same permissions to those.
- Snoozing global notifications in one browser will now snooze them across all browsers/devices where the user is logged in.
- The Override host parameter in the Item value widget has been moved before the Advanced configuration section for better usability.
Plugins
Ember+
A new plugin for direct monitoring of Ember+ by Zabbix agent 2 has been added.
For more information, see:
Installation
Separate installation packages for RHEL derivatives
Dedicated installation packages are available for versions 8 and 9 of AlmaLinux, CentOS Stream, Oracle Linux, and Rocky Linux. Earlier, single installation packages were provided for RHEL and RHEL-based distributions. Now separate packages are used for RHEL and each of its above-mentioned derivatives to avoid potential problems with binary incompatibility.
Support for ARM64/AArch64
ARM64/AArch64 installation packages are now available for Debian, RHEL 8, 9 and its derivatives, as well as SLES/OpenSUSE Leap 15.