
On this page
5 Discovery
Overview
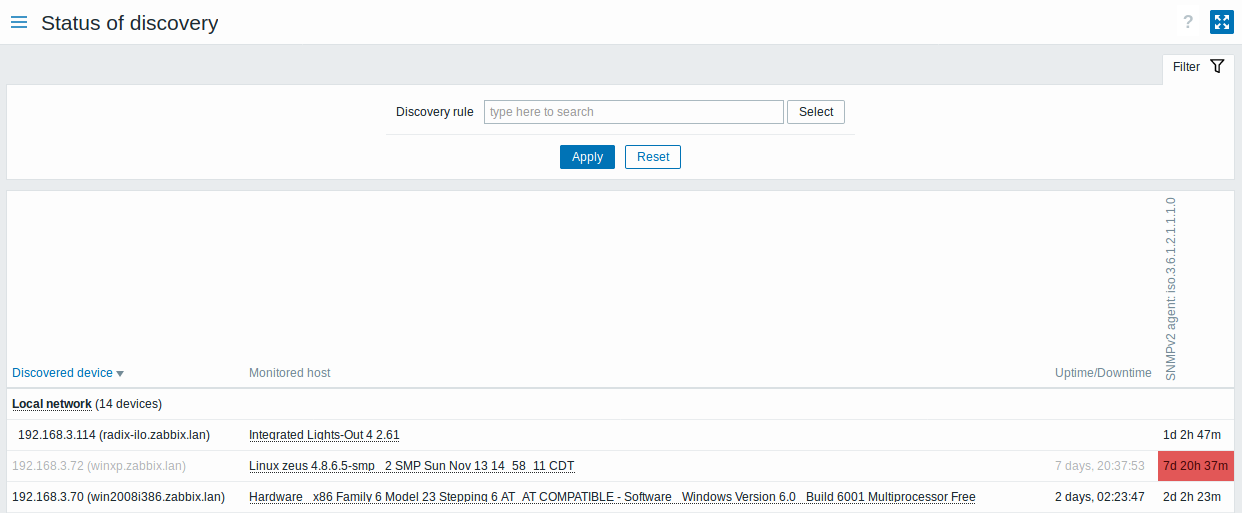
In the Monitoring → Discovery section results of network discovery are shown. Discovered devices are sorted by the discovery rule.
Displayed data:
| Column | Description |
|---|---|
| Discovered device | Discovered devices are listed, grouped by the discovery rule. Clicking on the discovery rule brings up the rule menu containing the link to the discovery rule configuration form. |
| Monitored host | If a device is already monitored, the host name will be listed in this column. Clicking on the host name brings up the host menu. |
| Uptime/Downtime | The duration of the device being discovered or lost after previous discovery is displayed in this column. |
| Discovery check | The state of the individual service (discovery check) for each discovered device is displayed. A red cell shows that the service is down. Service uptime or downtime is included within the cell. This column is displayed only if the service has been found on at least one discovered device. |
Buttons
View mode buttons being common for all sections are described on the Monitoring page.
Using filter
You can use the filter to display only the discovery rules you are interested in. For better search performance, data is searched with macros unresolved.
With nothing selected in the filter, all enabled discovery rules are displayed. To select a specific discovery rule for display, start typing its name in the filter. All matching enabled discovery rules will be listed for selection. More than one discovery rule can be selected.