
On this page
27 Top triggers
Overview
In the Top triggers widget, you can see the triggers with the highest number of problems.
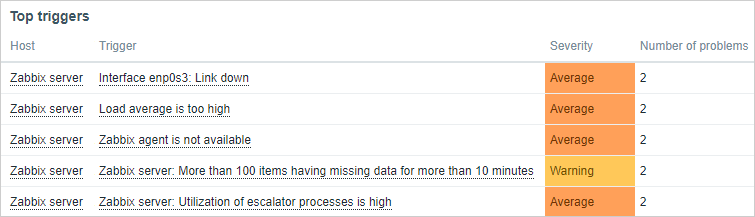
The maximum number of triggers that can be shown is 1000 (100 before Zabbix 7.0.6). When viewing the widget on a dashboard, it is possible to select the time period for displaying the data.
The information on top triggers is also available in the Reports → Top 100 triggers menu section.
Configuration
To configure, select Top triggers as widget type:
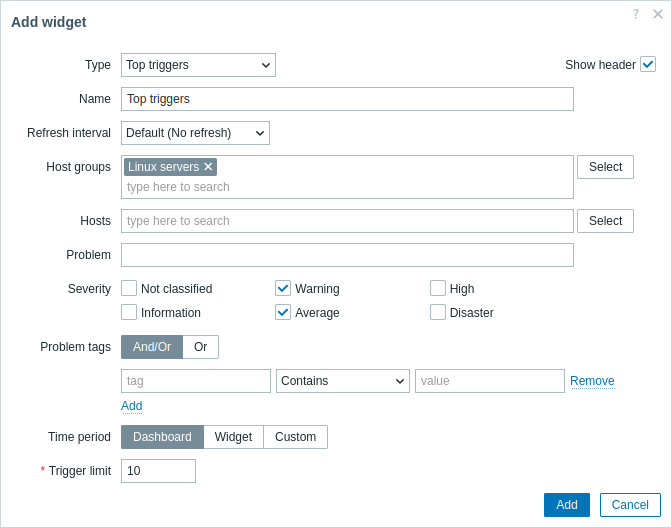
In addition to the parameters that are common for all widgets, you may set the following specific options:
| Host groups | Select host groups to display problems of in the widget. This field is auto-complete, so starting to type the name of a group will offer a dropdown of matching groups. Specifying a parent host group implicitly selects all nested host groups. Problems from these host groups will be displayed in the widget; if no host groups are entered, problems from all host groups will be displayed. This parameter is not available when configuring the widget on a template dashboard. |
| Hosts | Select hosts to display problems of in the widget. This field is auto-complete, so starting to type the name of a host will offer a dropdown of matching hosts. If no hosts are entered, problems of all hosts will be displayed. This parameter is not available when configuring the widget on a template dashboard. |
| Problem | You can view the triggers for particular problems only. For this, enter the string to be matched in the problem name. Macros are not expanded. |
| Severity | Mark trigger severities to filter triggers to be displayed in the widget. If no severities are marked, all triggers will be displayed. |
| Problem tags | Specify the tags of the problems to be displayed in the widget. It is possible to include as well as exclude specific tags and tag values. Several conditions can be set. Tag name matching is always case-sensitive. There are several operators available for each condition: Exists - include the specified tag names; Equals - include the specified tag names and values (case-sensitive); Contains - include the specified tag names where the tag values contain the entered string (substring match, case-insensitive); Does not exist - exclude the specified tag names; Does not equal - exclude the specified tag names and values (case-sensitive); Does not contain - exclude the specified tag names where the tag values contain the entered string (substring match, case-insensitive). There are two calculation types for conditions: And/Or - all conditions must be met, conditions having the same tag name will be grouped by the Or condition; Or - enough if one condition is met. |
| Time period | Select the data source for the time period: Dashboard - set the Time period selector as the data source; Widget - set a compatible widget specified in the Widget parameter as the data source; Custom - set the time period specified in the From and To parameters as the data source; if set, a clock icon will be displayed in the top right corner of the widget, indicating the set time on mouseover. |
| Widget | Enter or select a compatible widget (Graph, Graph (classic), Graph prototype) as the data source for the time period. This parameter is available if Time period is set to "Widget". |
| From | Enter or select the start of the time period. Relative time syntax ( now, now/d, now/w-1w, etc.) is supported.This parameter is available if Time period is set to "Custom". |
| To | Enter or select the end of the time period. Relative time syntax ( now, now/d, now/w-1w, etc.) is supported.This parameter is available if Time period is set to "Custom". |
| Trigger limit | Set the number of triggers to be displayed. Possible value range: 1-1000 (1-100 before Zabbix 7.0.6). |