Learn about the most critical Zabbix features, get a brief overview of our professional services, and find out how to easily download and install Zabbix. (12:17)
Dive deeper in to technical details, including supported monitoring methods, business service and SLA monitoring, and distributed monitoring with Zabbix proxies. (8:25)
Register for free with your email address to explore Zabbix in detail with this comprehensive demonstration. If you prefer a more personalized experience, you can also request a live demo with our experts. (48:00)
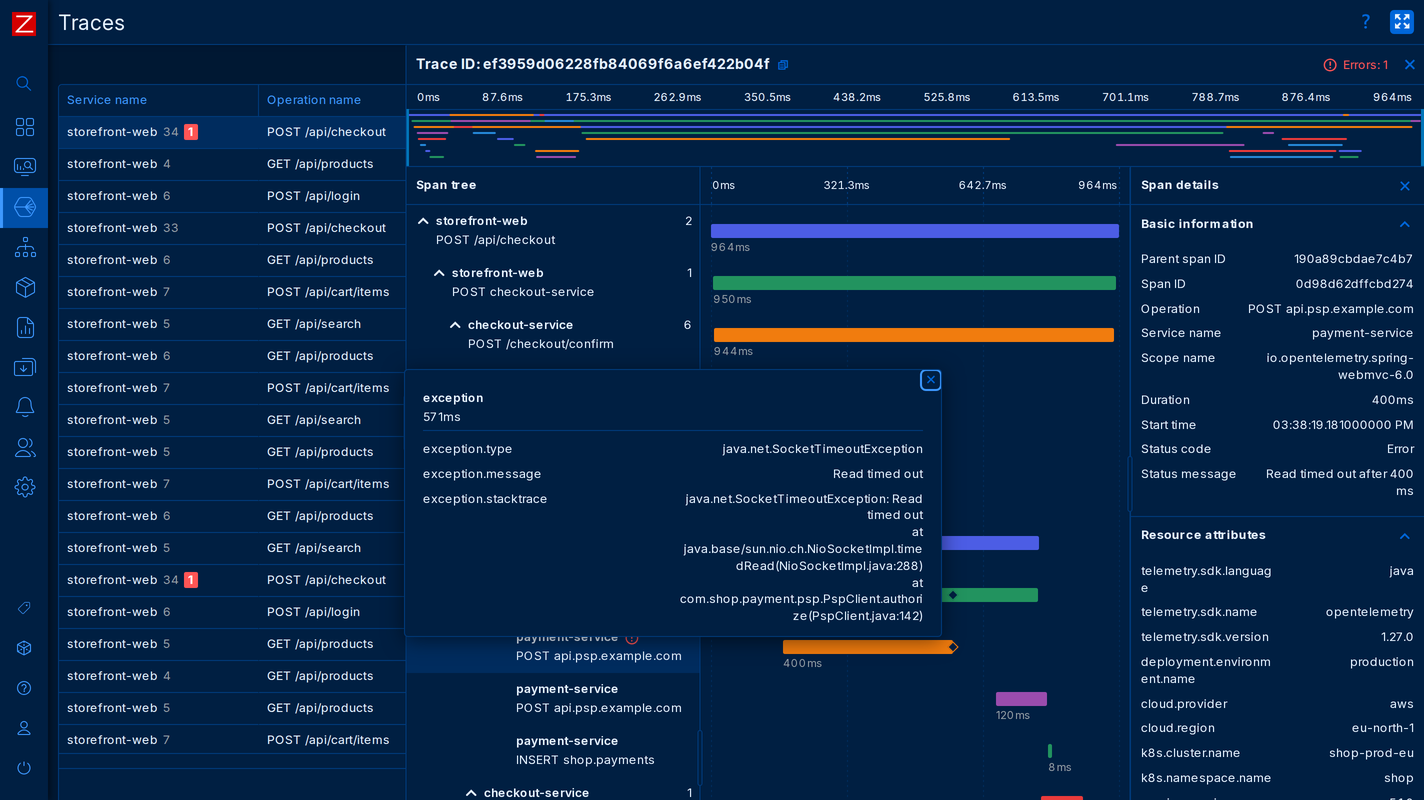
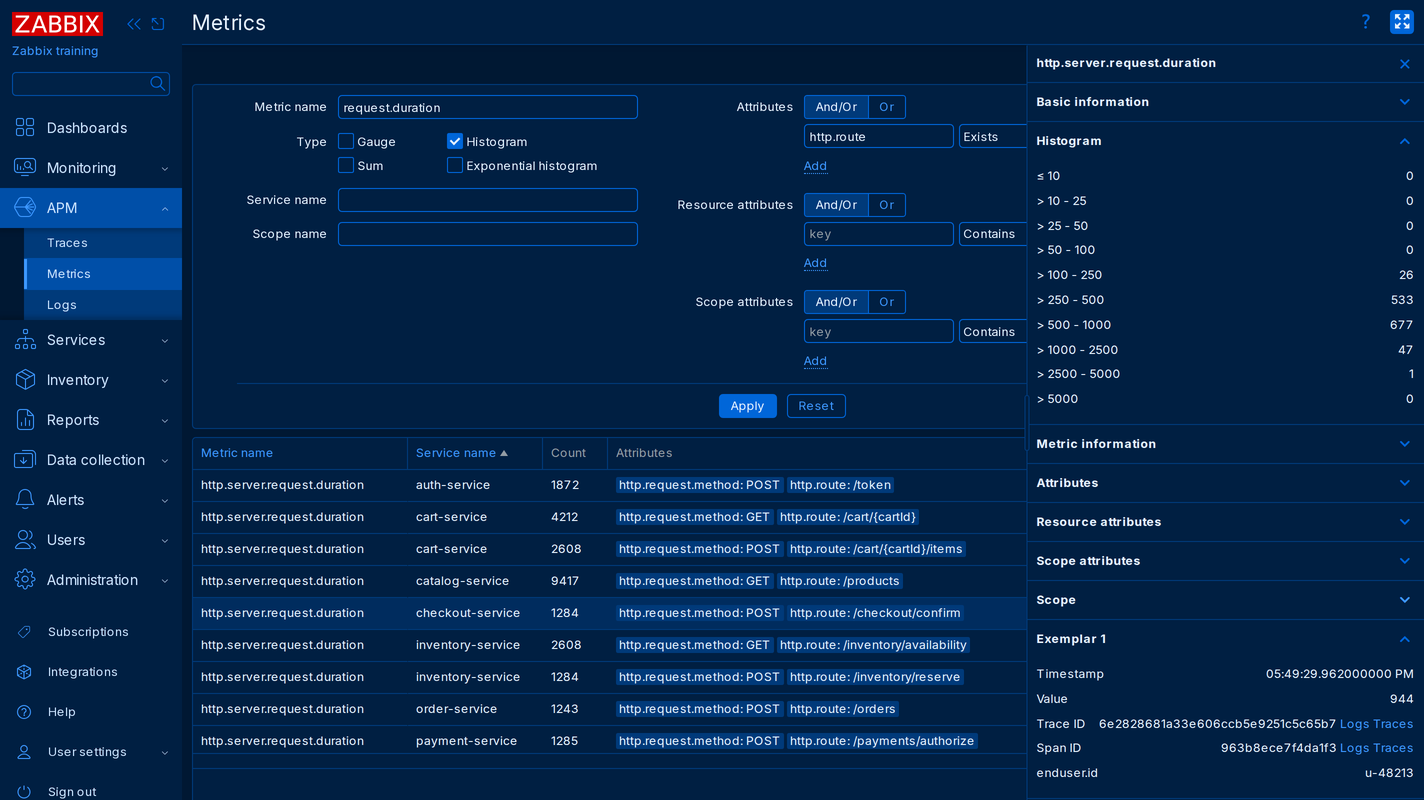
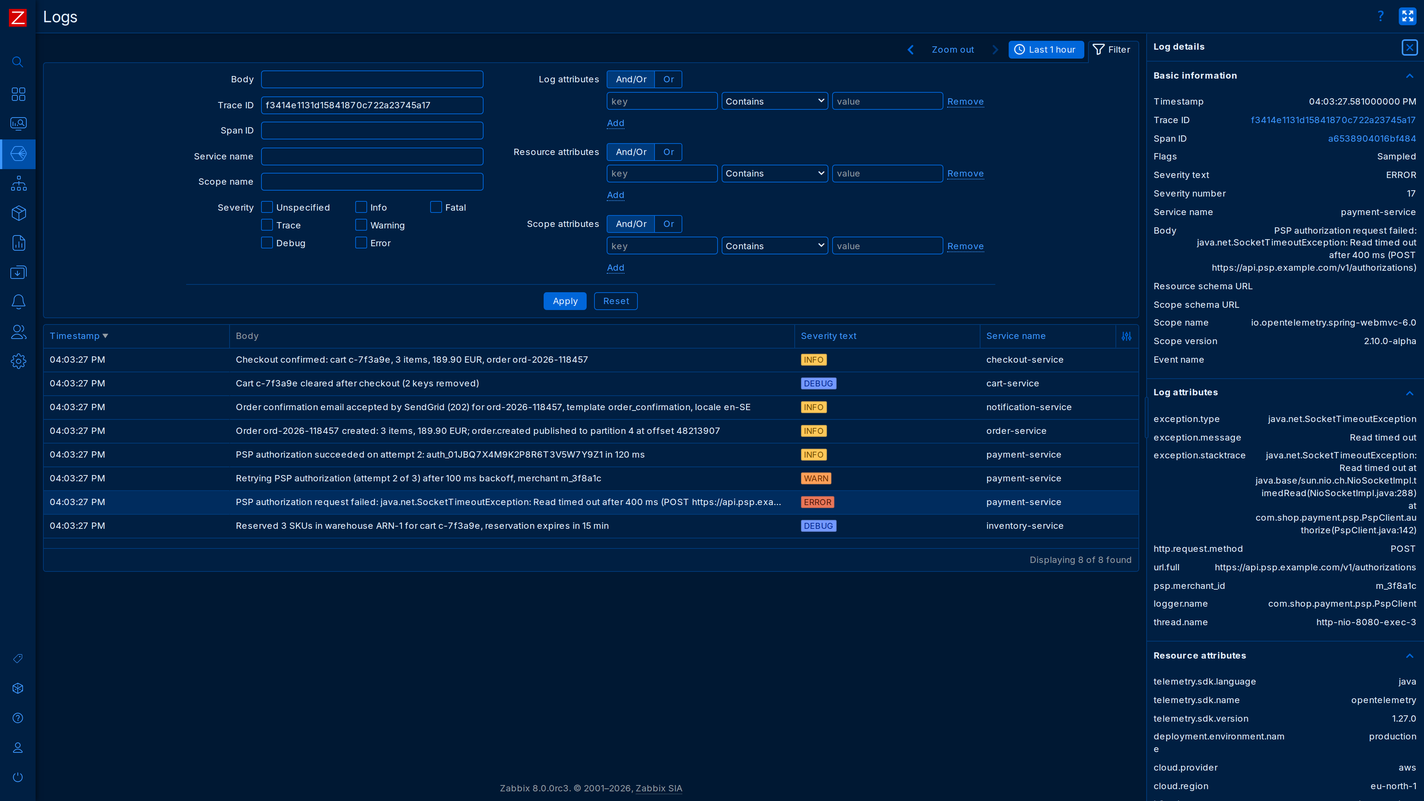
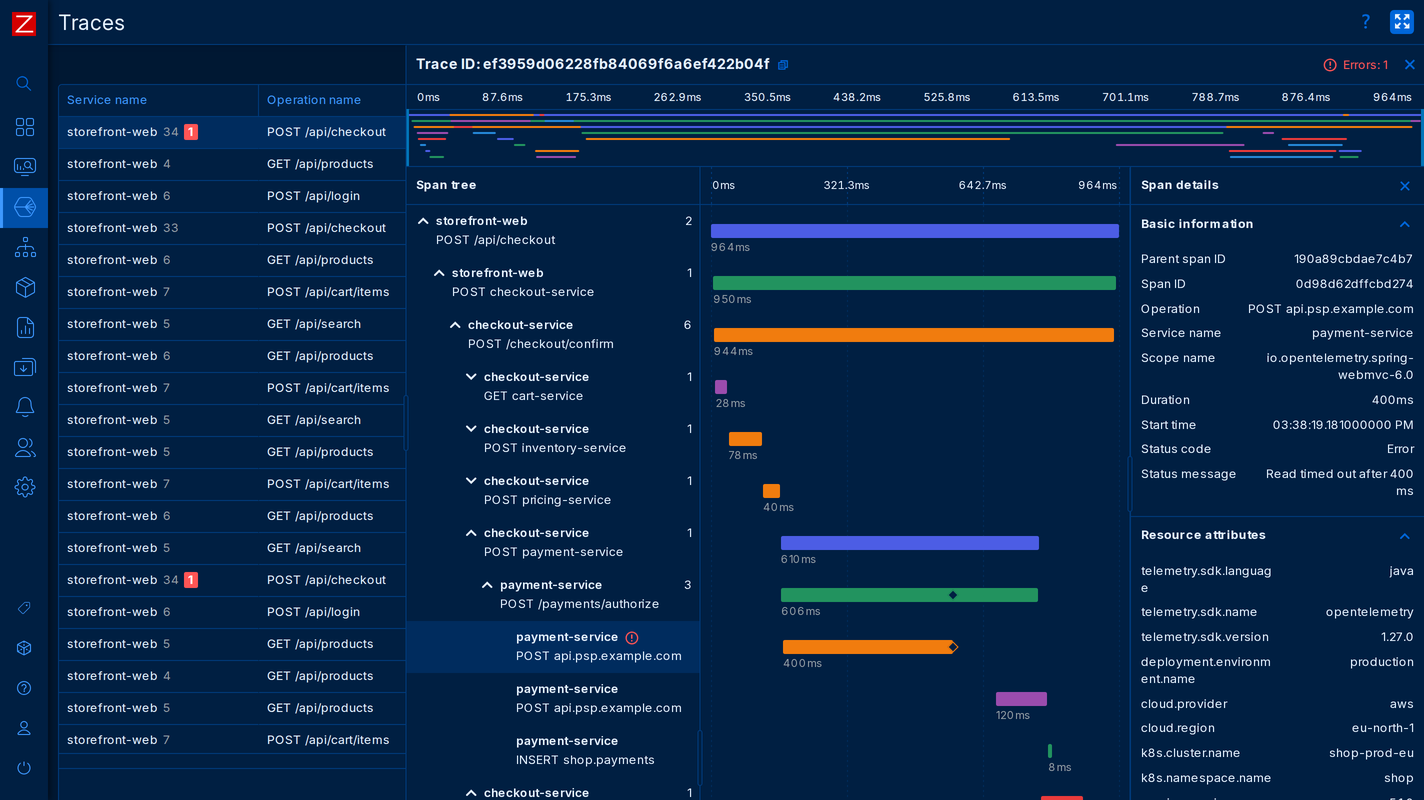
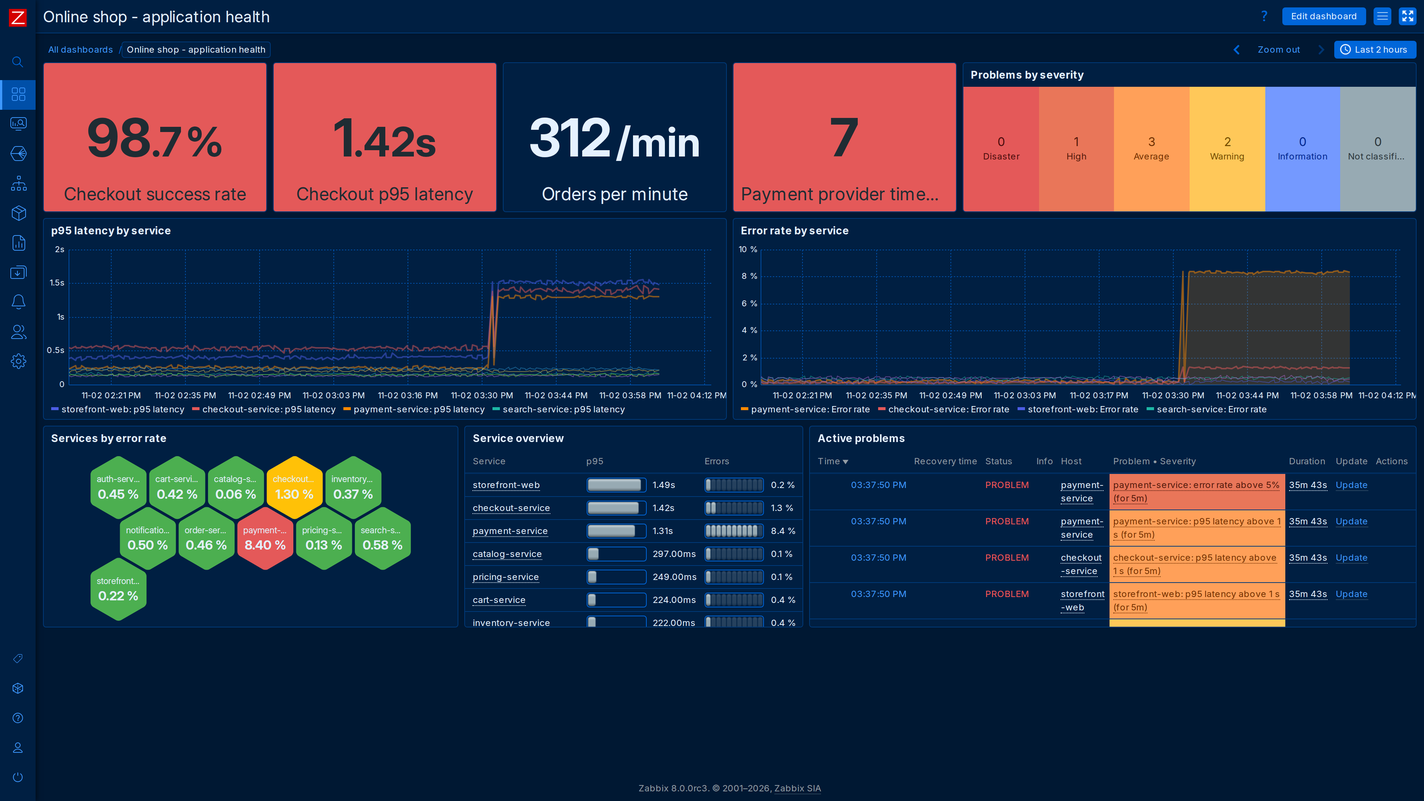
Monitor application performance with OpenTelemetry, the open standard for traces, metrics and logs. Follow requests across services to investigate slowdowns and errors.
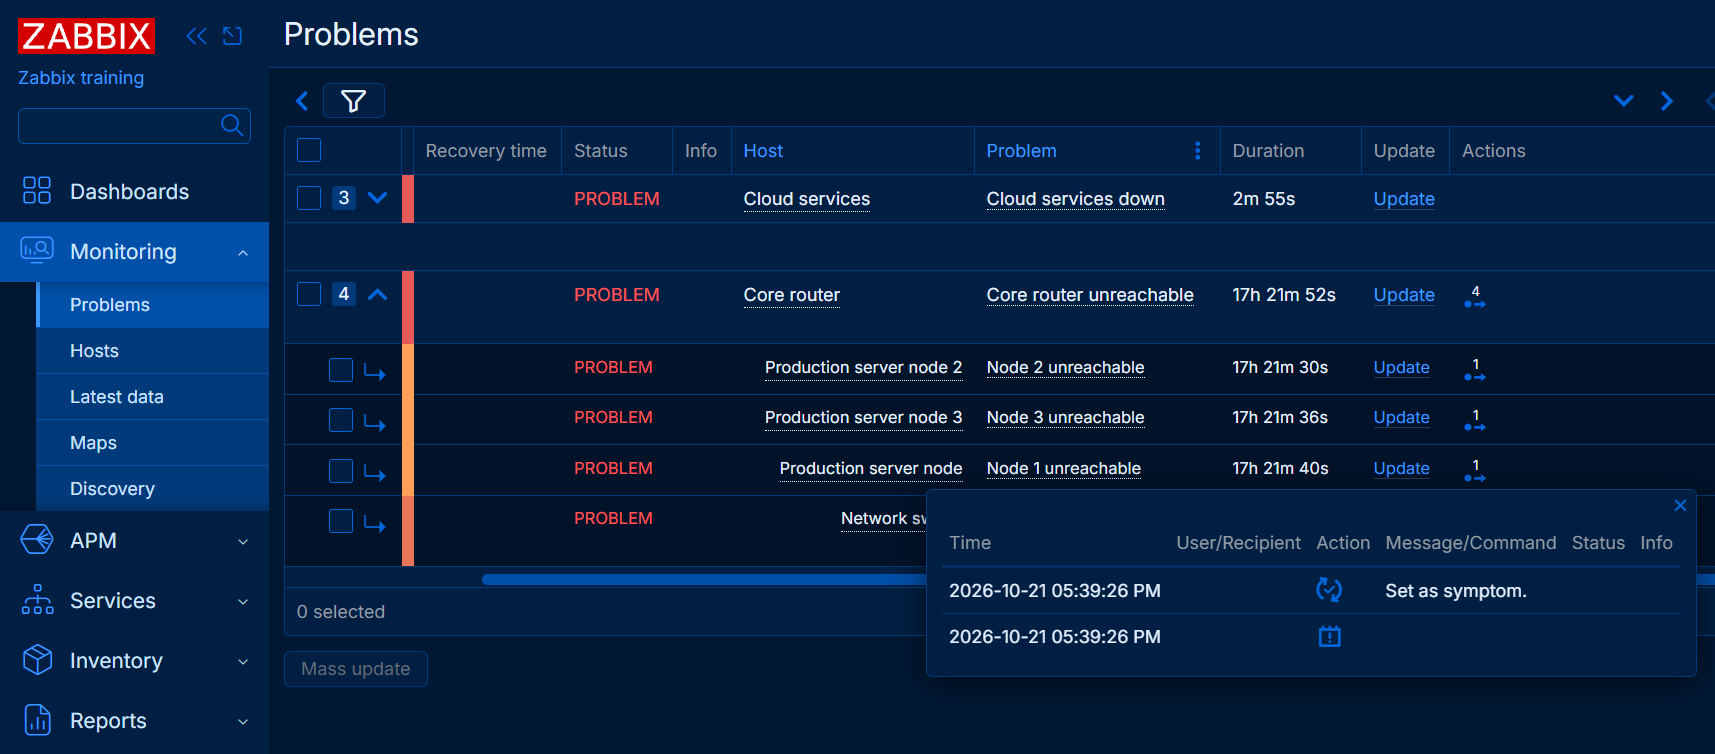
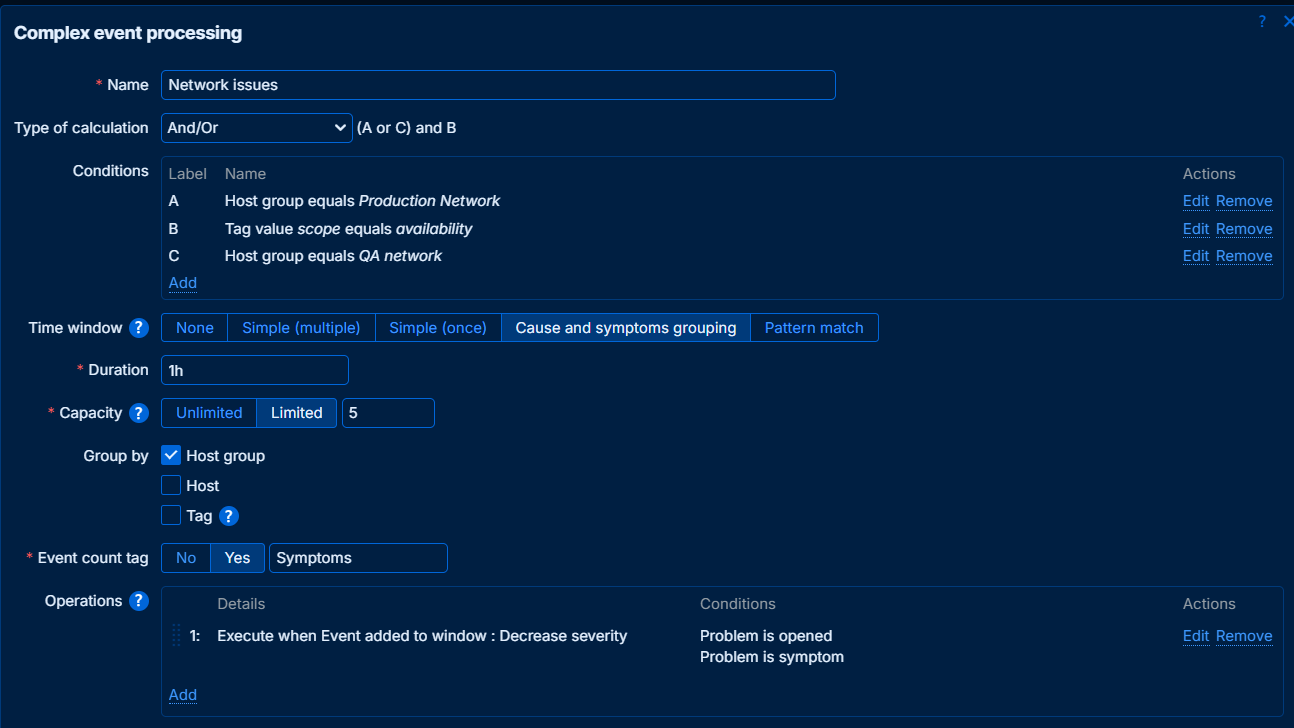
Turn thousands of raw events into a few actionable problems with root cause analysis, reducing alert fatigue and speeding up incident resolution.
Apply configurable rules to group related events, reduce duplicates and detect patterns across time windows.
On-demand one-click maintenance: suppress alerts for selected monitored targets, triggers or event patterns, and see in each event's history whether and why it was suppressed.
Fully programmable: write custom matching and correlation logic in JavaScript when built-in rules are not enough.
Use cases: network operations centers that need one alarm console, security monitoring and SIEM-style correlation, fraud detection, and high-volume IoT and OT event streams.
Detect problems automatically as metrics arrive:
Compose problem conditions as formulas using comparisons, averages and other functions. For example, alert when a value falls below a limit or a five-minute average equals a target. Combine conditions with AND or OR.
Anticipate capacity limits and performance problems:
Use historical baselines to detect unusual metric behavior:
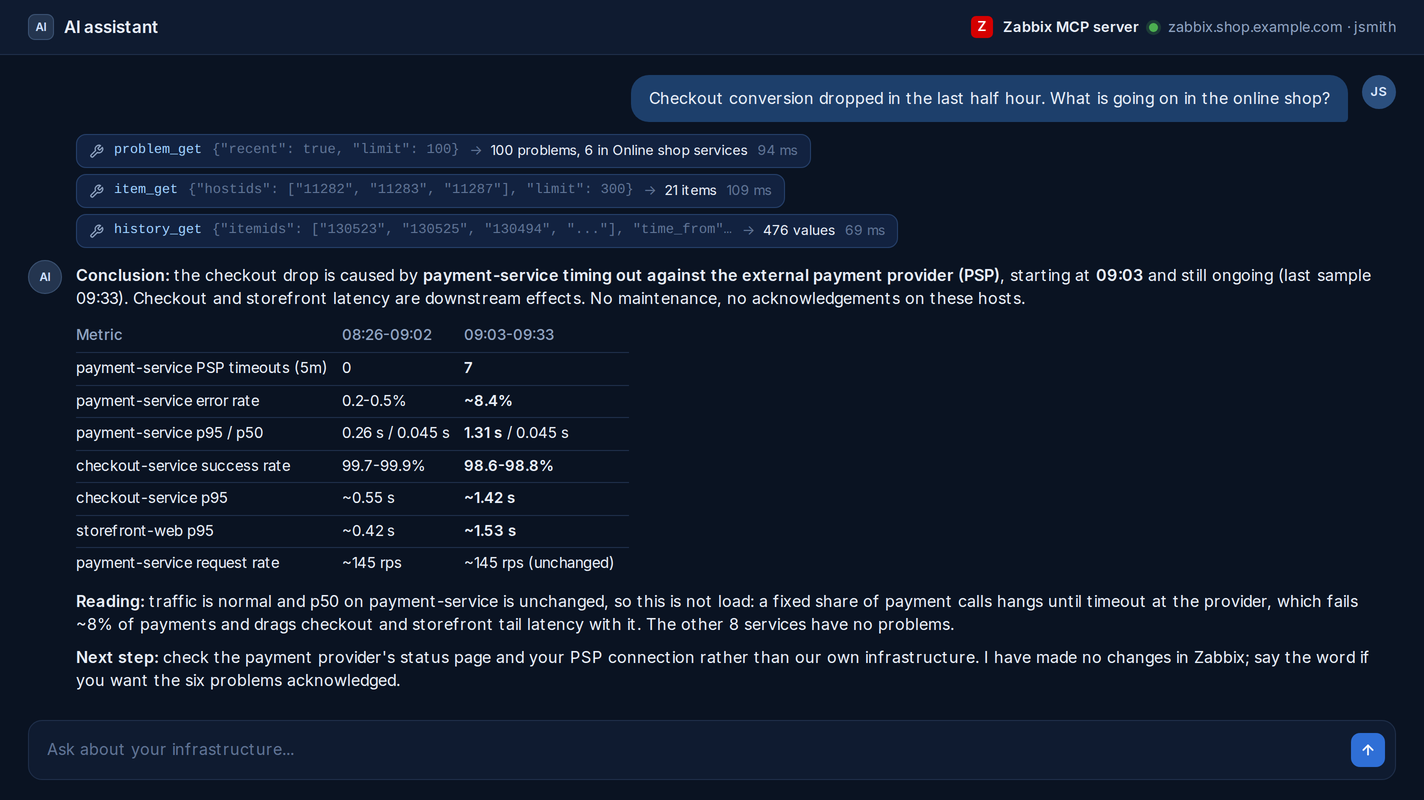
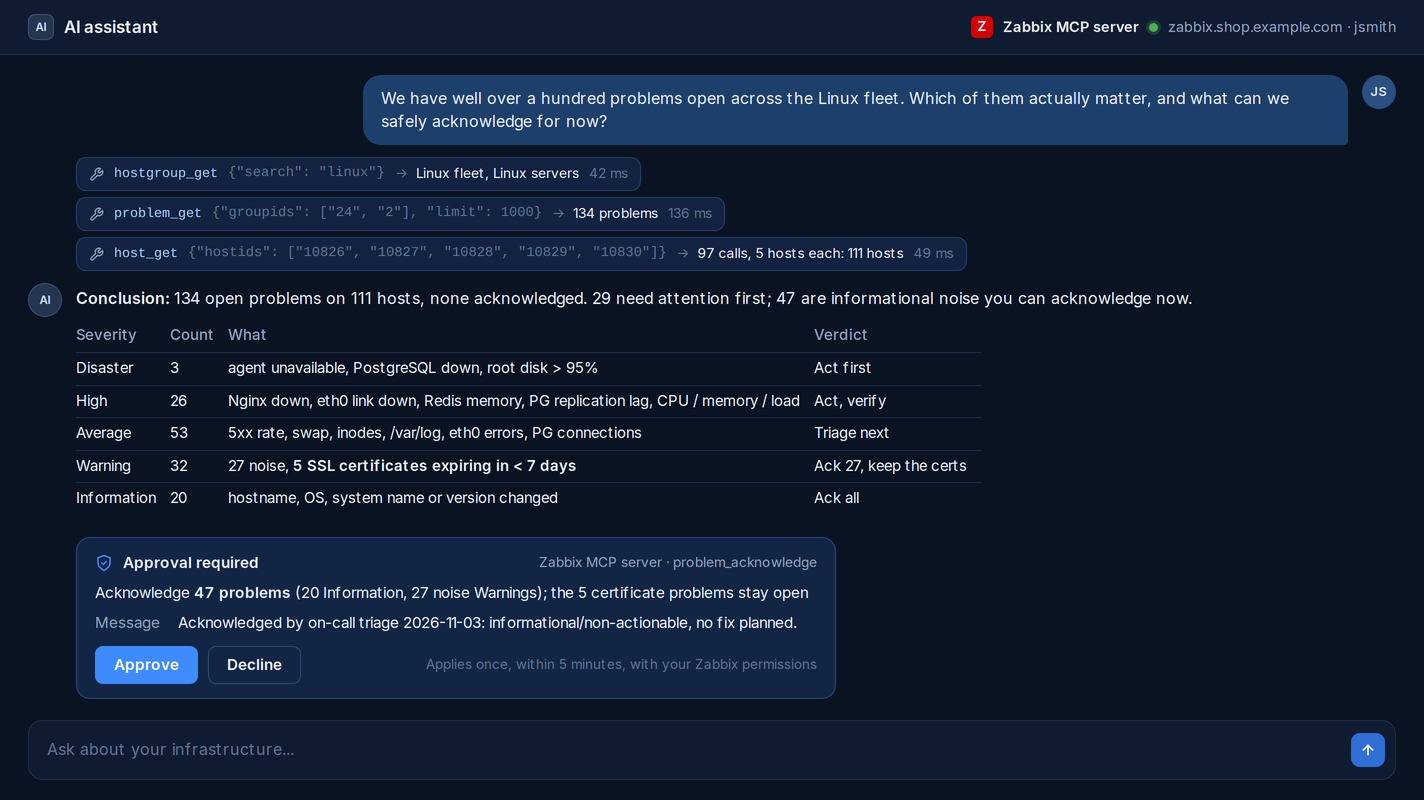
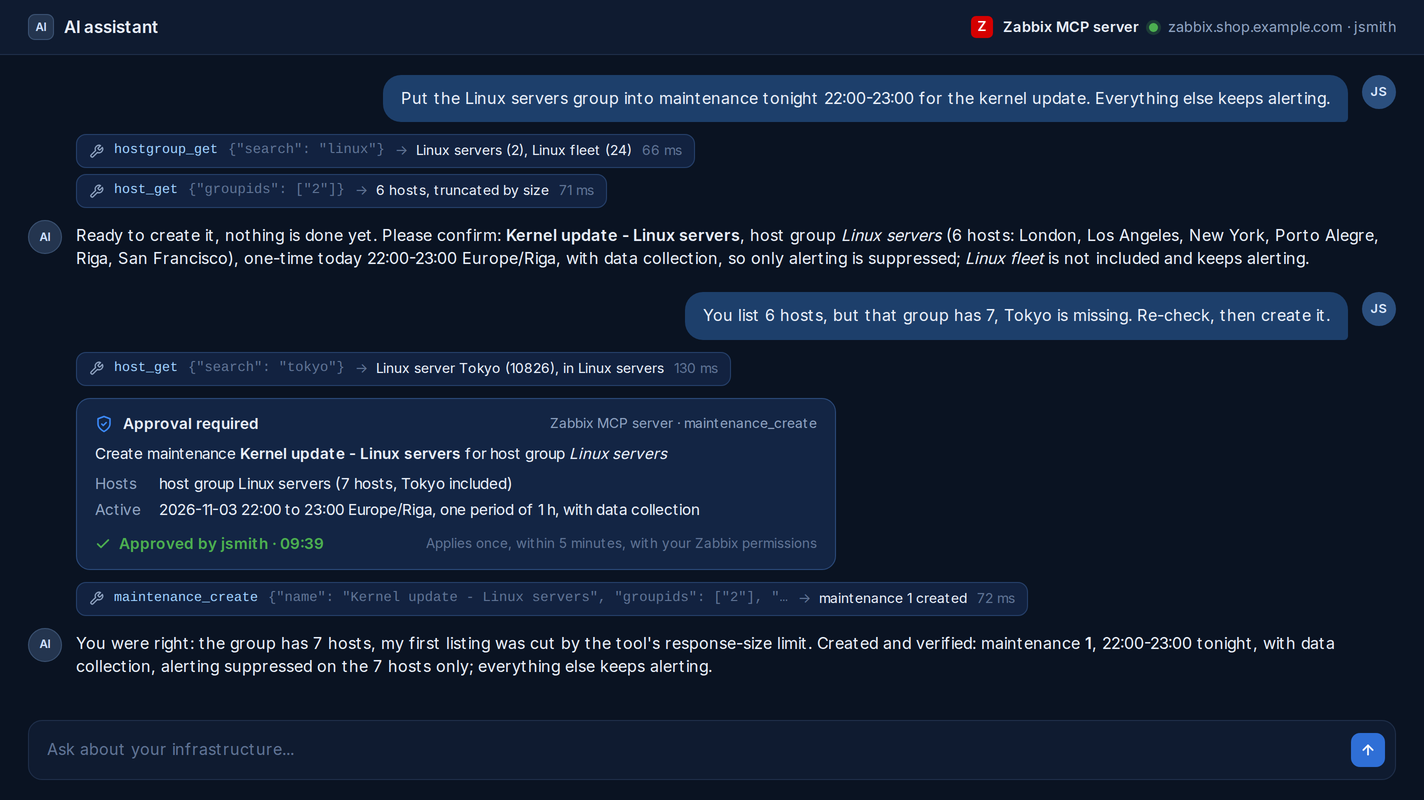
Connect a compatible AI assistant or automation platform through the Zabbix Model Context Protocol (MCP) server. Investigate your environment and automate monitoring workflows within your Zabbix permissions.
Run recurring workflows with scheduling in your AI assistant or automation platform.
Monitor your AI services too: ready-made monitoring for OpenAI Platform, Claude API, OpenRouter, GitHub Copilot and Microsoft 365 Copilot tracks AI usage alongside the rest of your stack.
Deploy in minutes from official packages or a Docker image.
Monitor large environments with efficient use of hardware resources, distributed data collection, high-volume data storage and automatic failover.
Add an extra layer of scalability by deploying Zabbix proxies. Scale up to collect millions of metrics from hundreds of thousands of devices, services, applications, and more. Zabbix proxies are easy to deploy and enable unlimited vertical scalability:
Collect metrics securely from remote locations and buffer data locally during network outages. With Zabbix proxies you can:
Retain detailed history and hourly trends for different periods to suit your storage capacity.
For example, keep detailed history for 6 months and hourly trends for 2 years:Monitor anything, without limits. If the data exists, Zabbix can collect it.
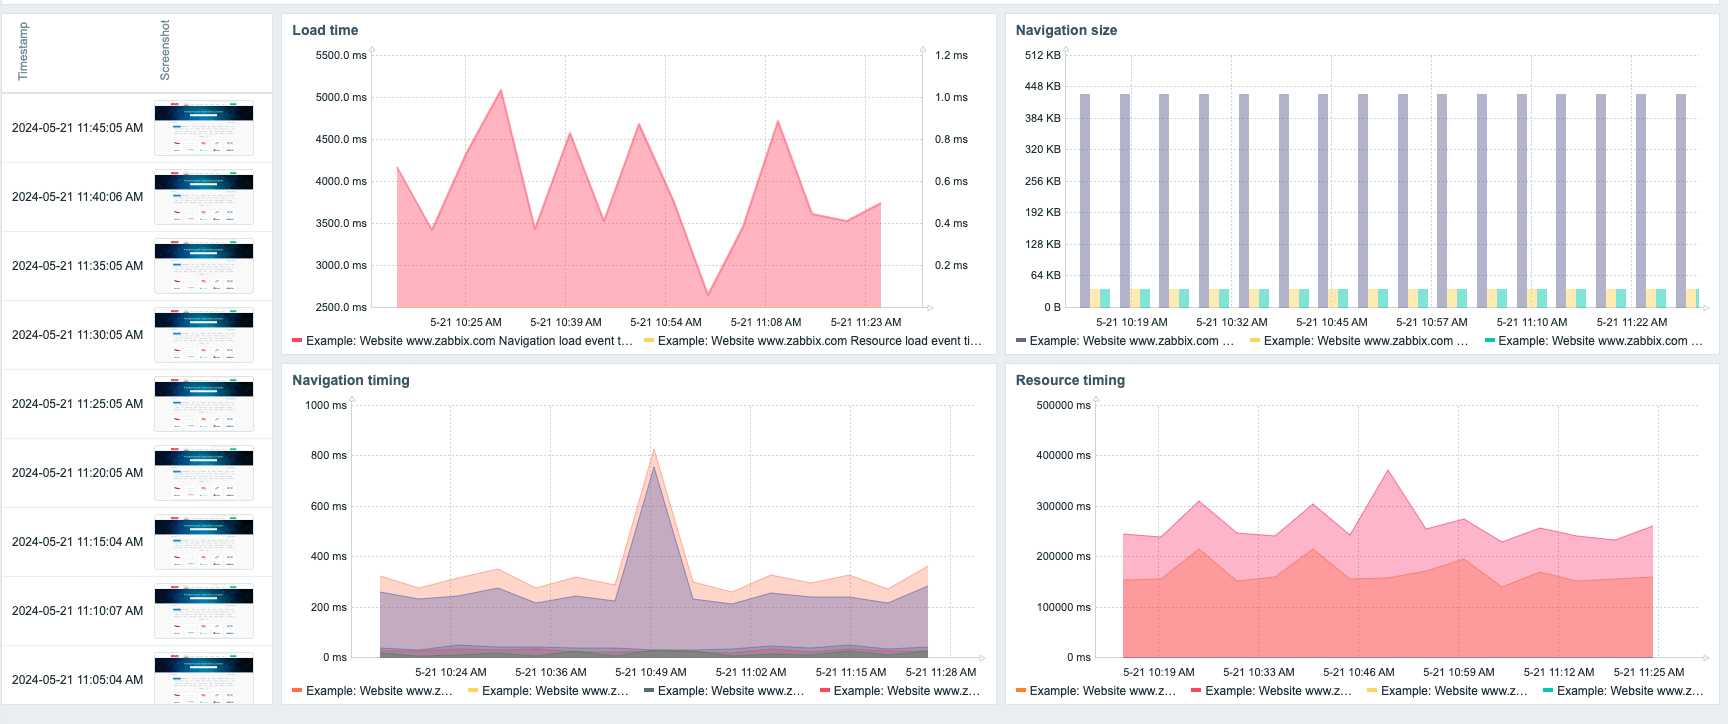
Test web applications and APIs with synthetic transactions:
Monitor websites and web applications by defining flexible multi-step browser based scenarios:
Receive notifications containing vital information through multiple messaging channels.
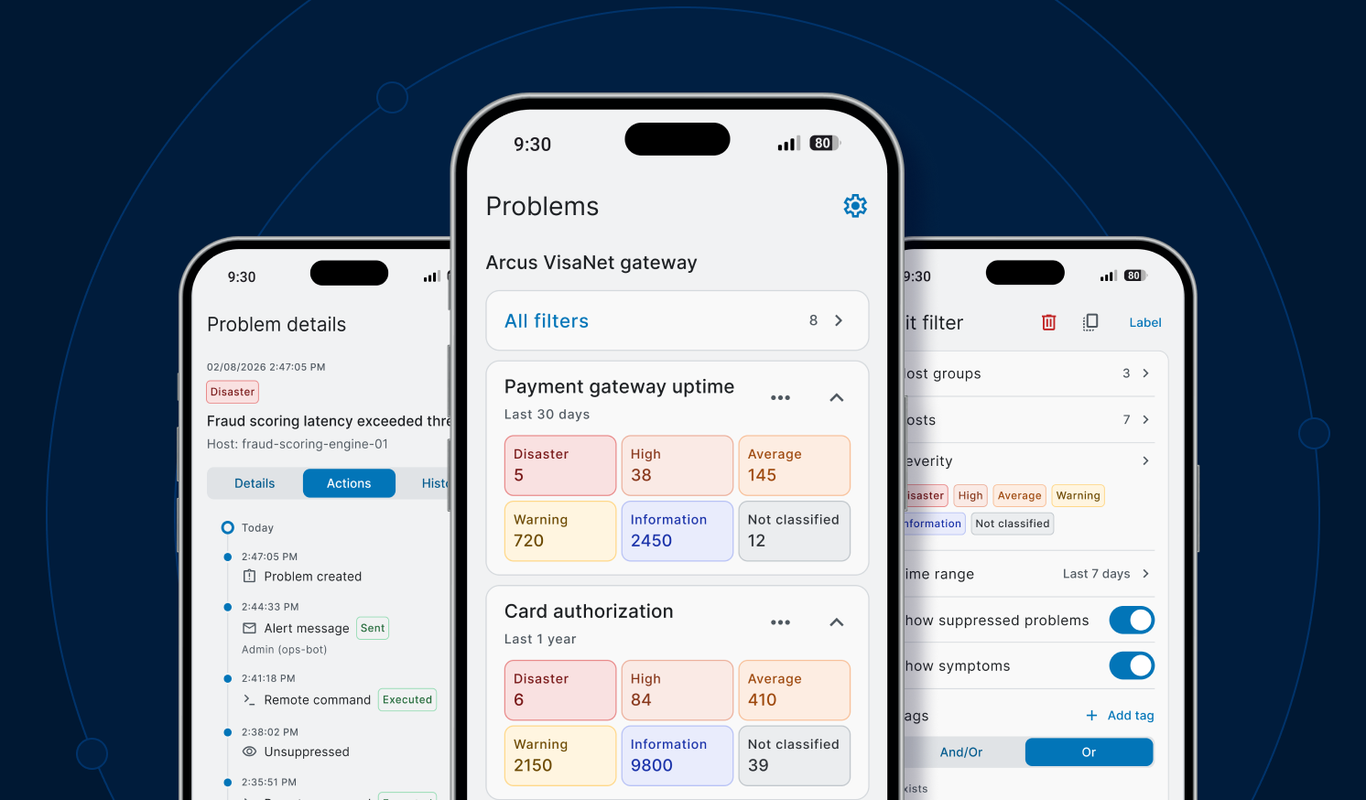
Access your Zabbix instances on the go. Receive push notifications and review problems from your phone.
Route alerts to responsible teams through their preferred channels:
Define different messages for different messaging channels. You can either utilize the default message templates or create and customize your own message template:
Define escalation workflows with notifications, delays and automated remediation:
Run configured scripts or commands in response to detected problems:
Execute a remediation script to:
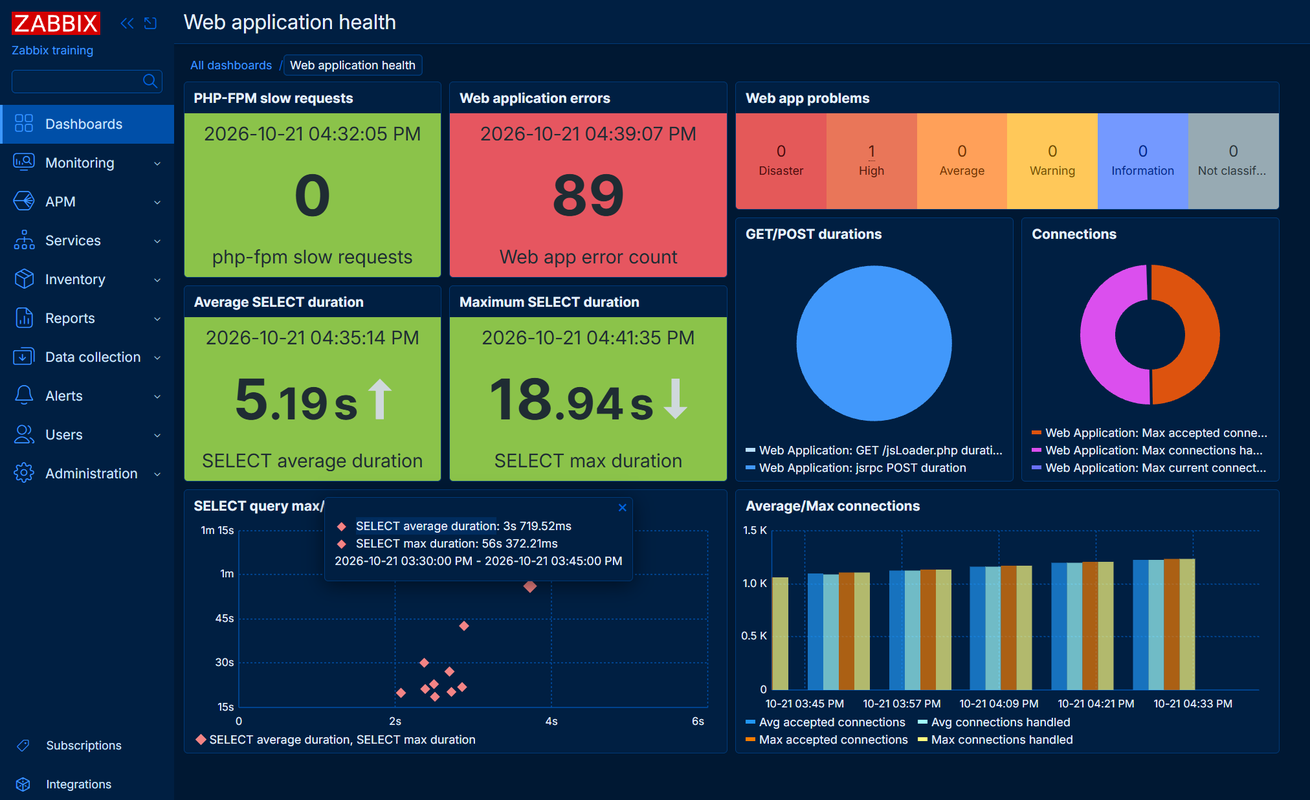
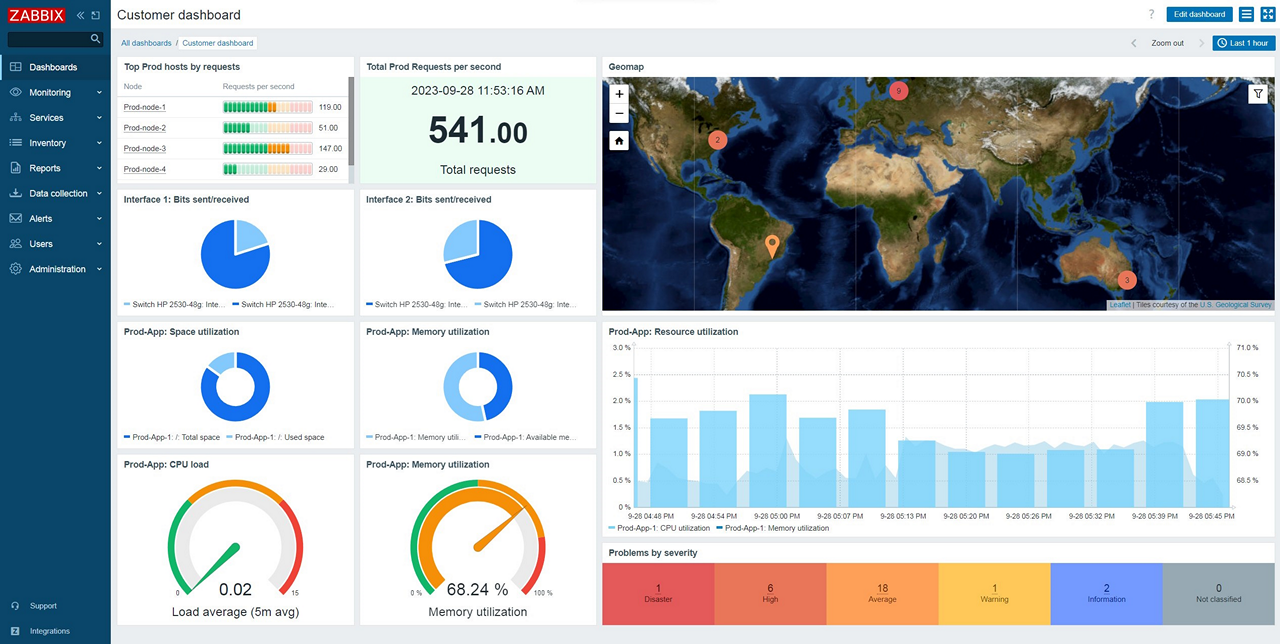
See your entire environment at a glance, with flexible dashboards that turn raw data into clear, actionable insight.
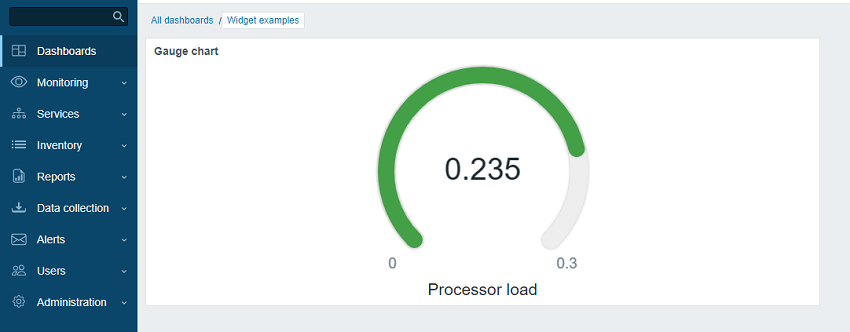
Define widget-based dashboards displaying relevant information:
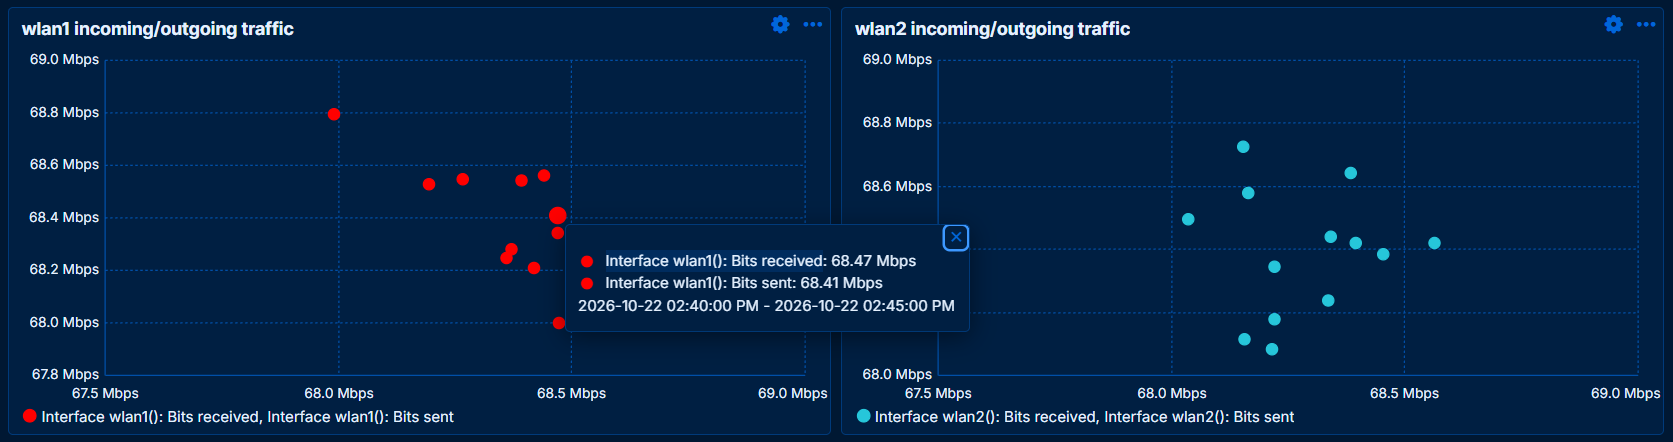
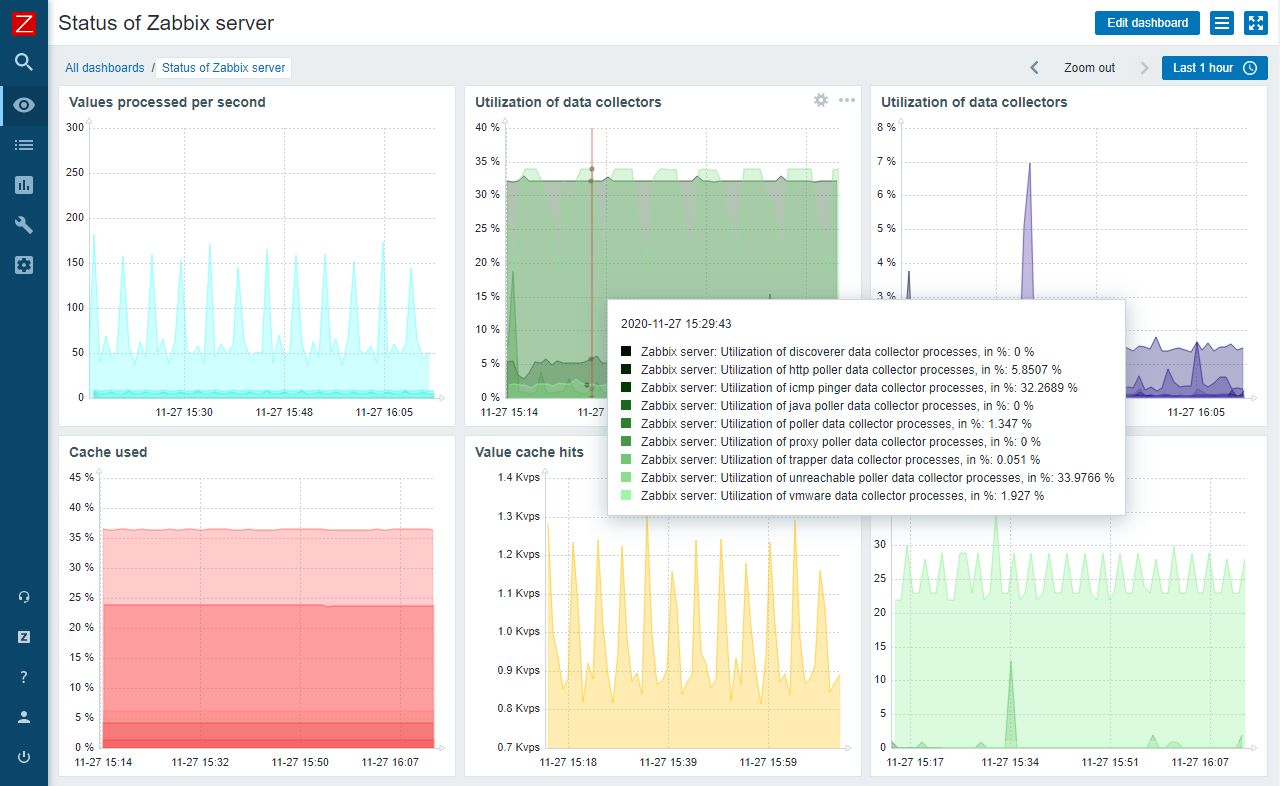
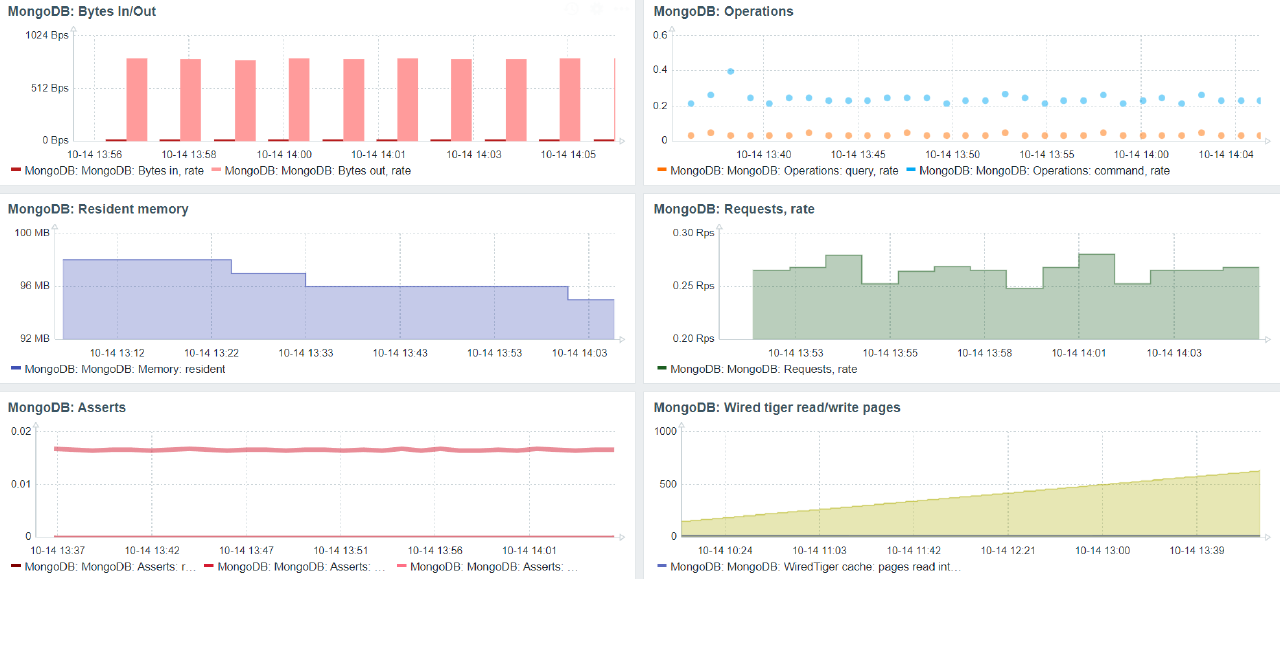
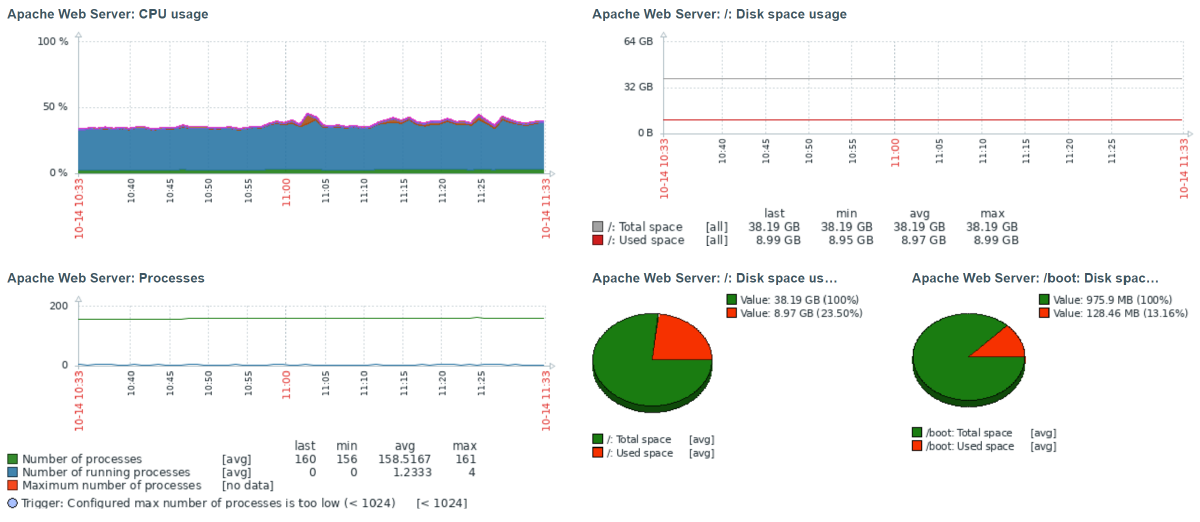
Define custom graphs or access ad-hoc graphs with a click of a button:
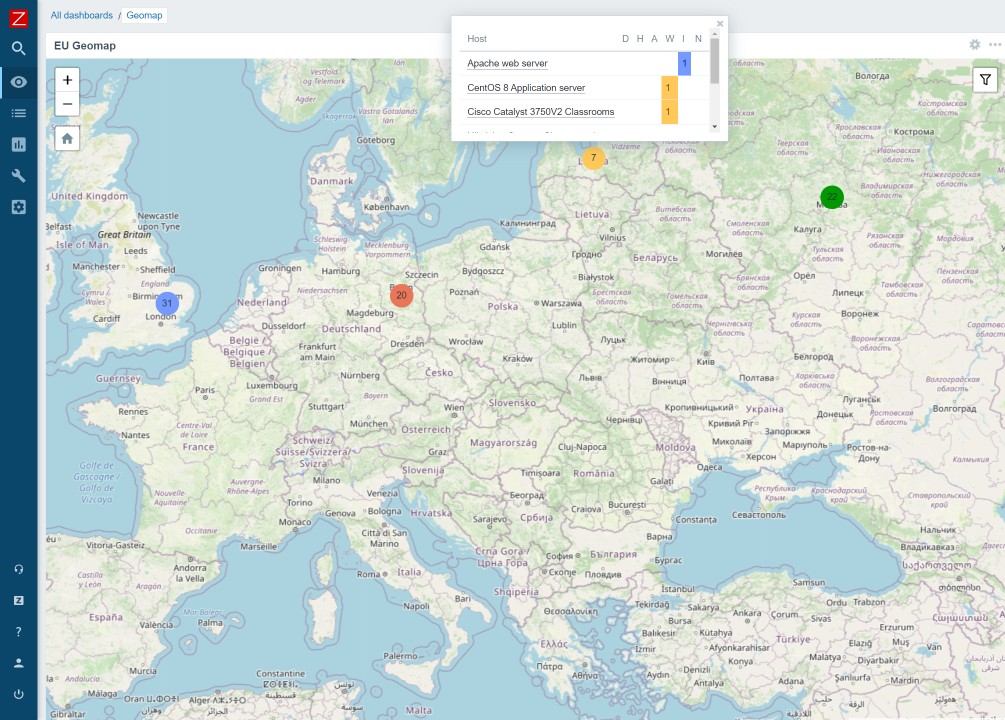
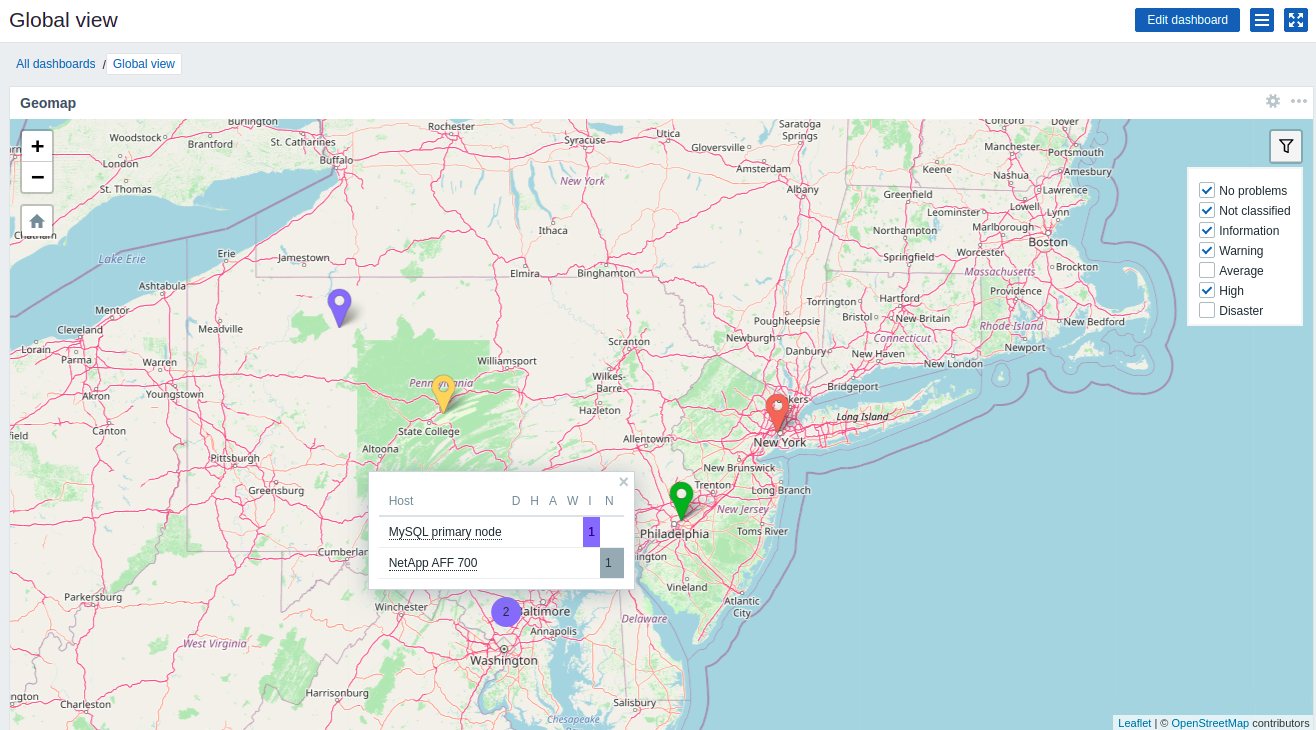
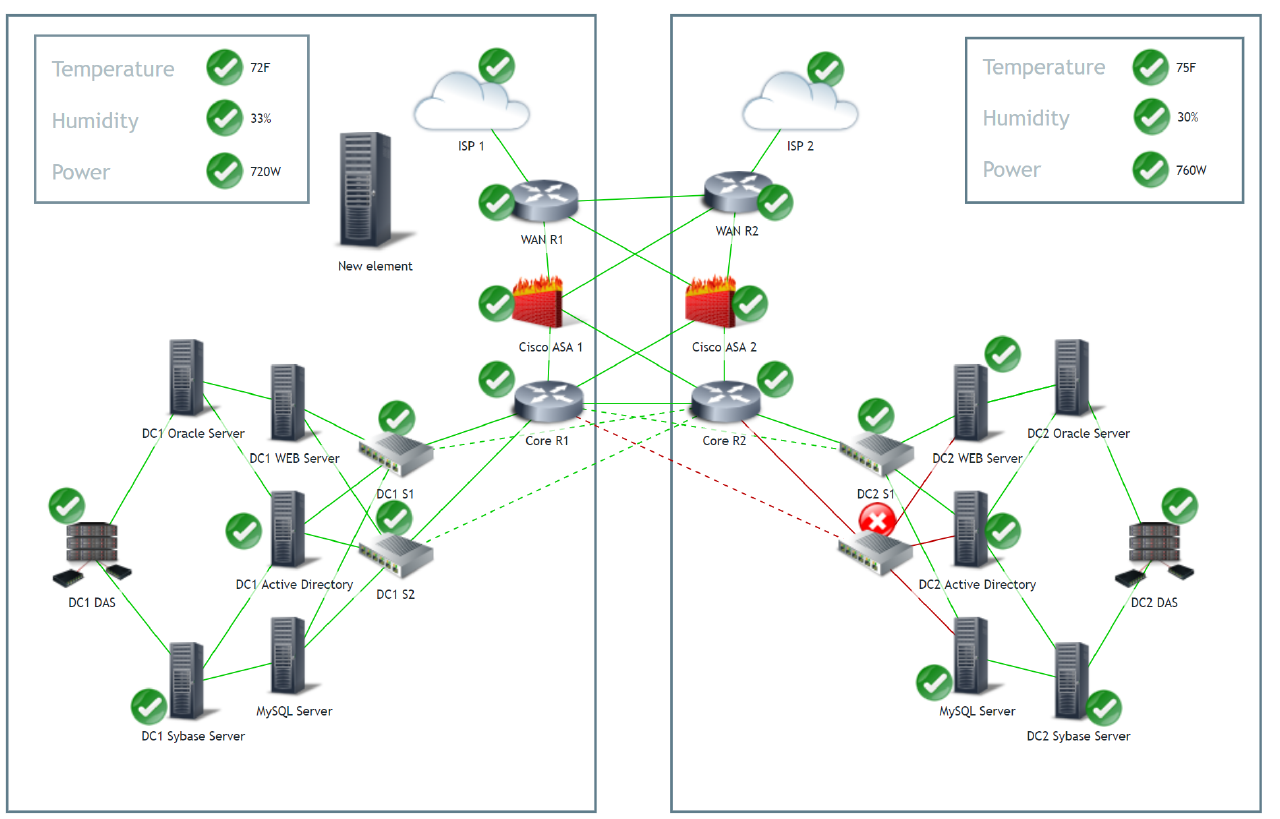
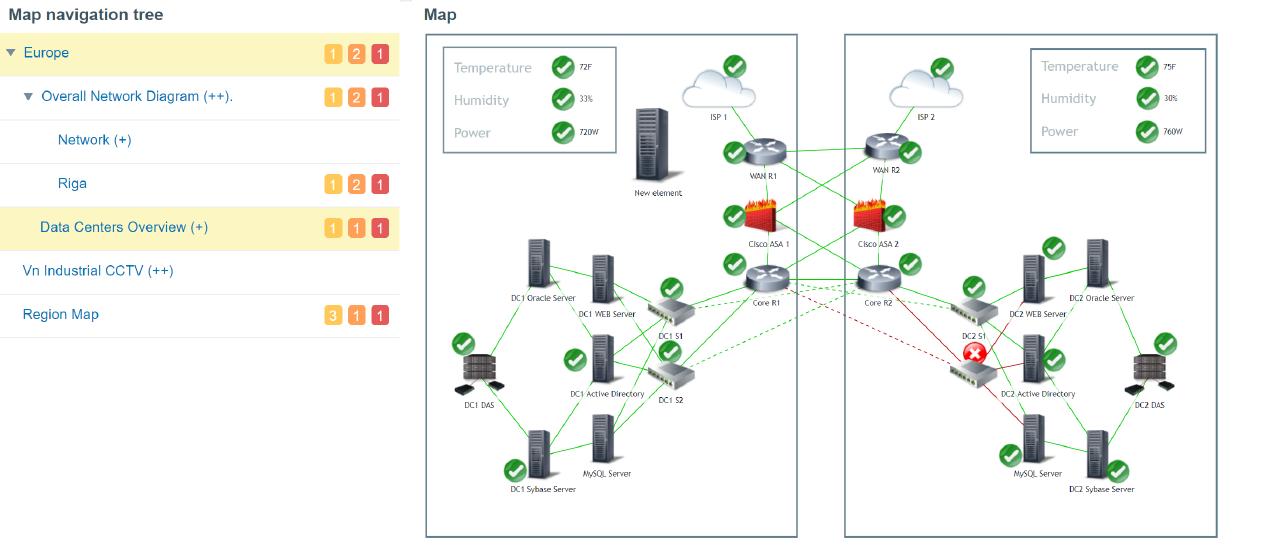
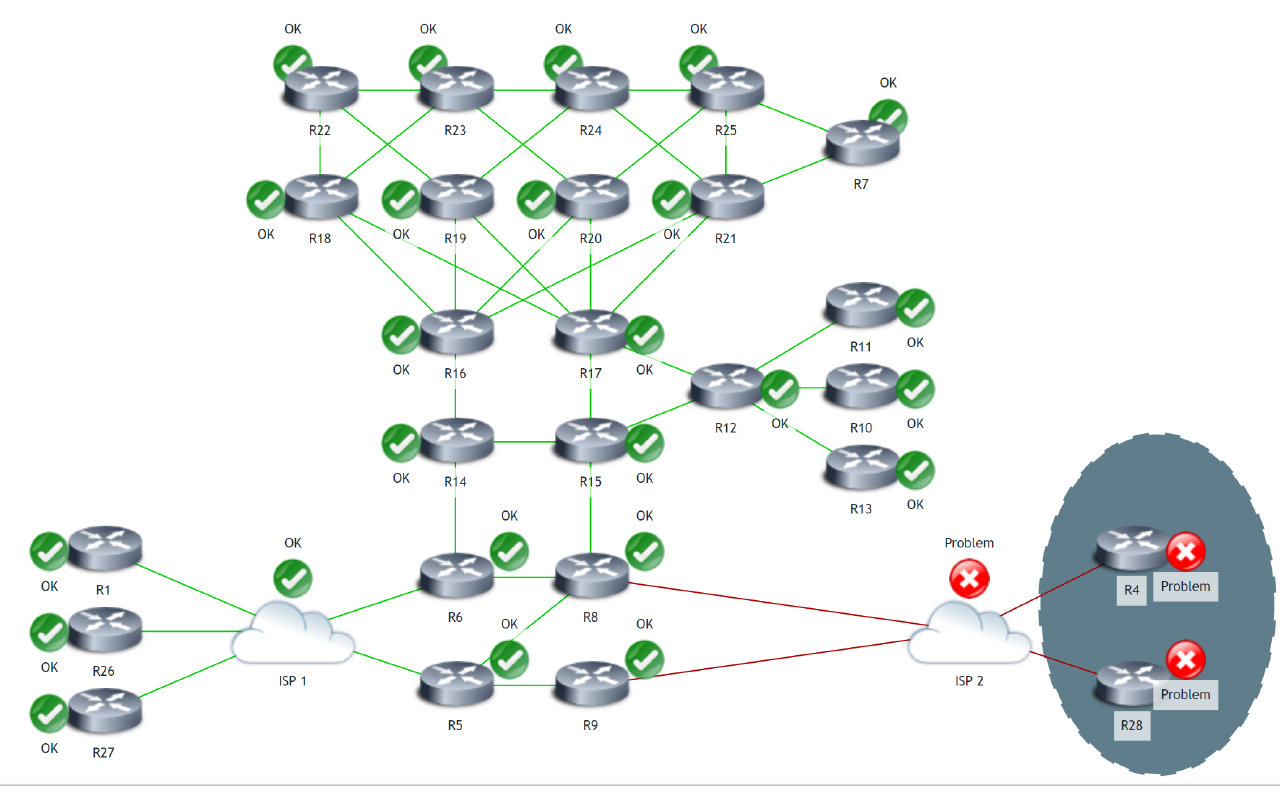
Display statuses of your elements together with real time data to get a detailed overview of your infrastructure on a Zabbix map:
Receive scheduled PDF reports providing useful statistics of your environment:
Any dashboard can be turned into a PDF report.
Automatically collect and store inventory information:
Secure by default, and ready for the strictest compliance requirements.
Restrict access to sensitive information by limiting which metrics can be collected in your environment:
Control access to monitored resources across teams and distributed environments.
You can define three levels of permissions:
User types are used to define access to administrative functions and to specify default permissions:
Restrict which proxies and proxy groups each team can use for monitoring and discovery.
Encrypt communication between Zabbix components:
Create your own custom user roles with a granular set of permissions for different types of users in your environment.
User roles also enable you to Hide or show Zabbix UI elements to fit the needs of your users and customers.
With user Roles you can:
Integrate Zabbix together with your existing authentication mechanisms. Zabbix supports a variety of authentication methods:
Supported multi-factor authentication methods:
Once entered, you have the option to hide your sensitive information from prying eyes:
Deploy an external vault to keep your secrets under tight control:
Track changes in your environment by utilizing the Audit log:
Integrate Zabbix with your existing tools - from legacy systems to cutting edge technologies.
Integrations are provided in a form of customizable JavaScript webhooks:
Kubernetes monitoring also enables you to monitor Kubernetes components, such as:
Gain additional insights from your metrics and events by streaming them to an external AI engine, or stream them to a data lake or data warehouse for long-term storage and analytics.
See how IT or OT issues affect your business, and track SLAs to prove you deliver on your commitments.
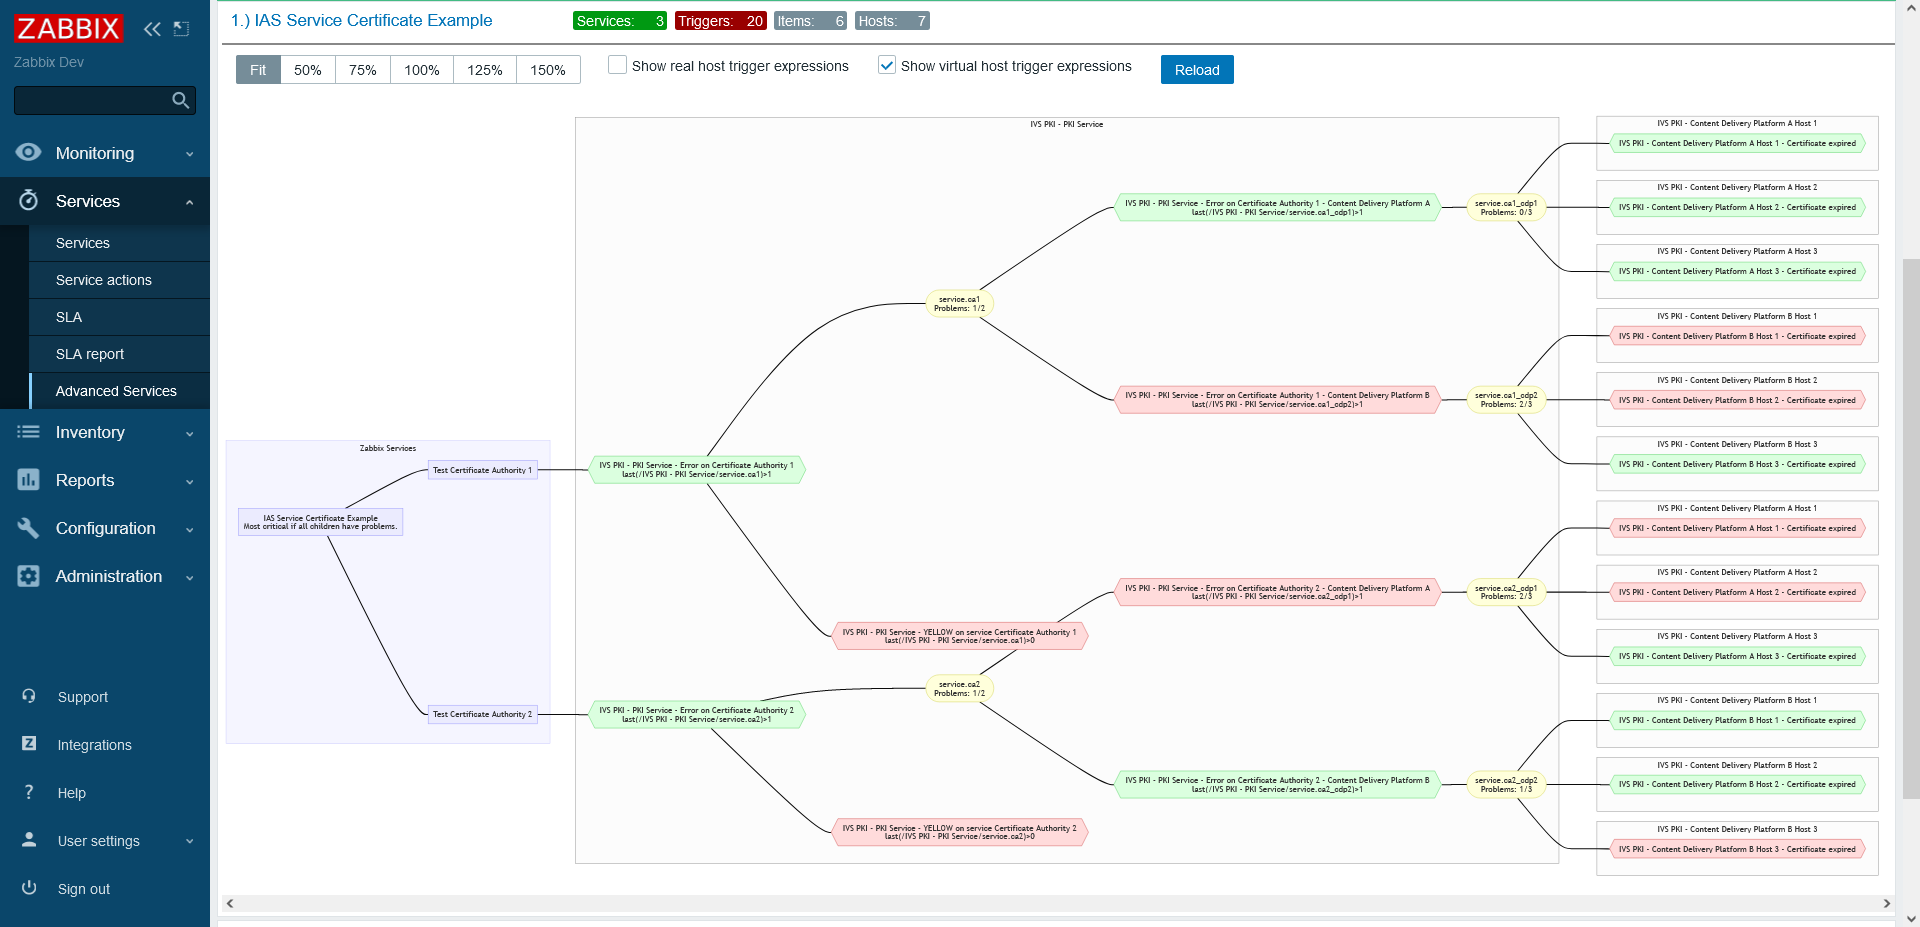
Define services and create service trees to perform impact analysis:
Control access to business service monitoring for different teams or tenants:
Measure service availability against SLA targets, with service schedules and excluded downtime:
Run Zabbix wherever your business needs it, from your own environment to any public cloud.
Zabbix provides many different ways how you can deploy individual Zabbix components:
Resource discovery enables Zabbix to automatically discover metrics on your monitoring endpoints:
Resource discovery is virtually limitless. Discover entities such as:
Vast selection of out-of-the-box templates provides the ability to immediately start monitoring your infrastructure:
Zabbix will automatically scan your network and add discovered devices for monitoring:
Scan your network hosts for availability by scanning for different services:
Automatically register deployed Zabbix agents and apply monitoring configuration:
Define custom device onboarding logic, depending on the agent metadata:
The Host Wizard will guide users through host creation and configuration:
You can use Zabbix for a lot more than just monitoring your own infrastructure! With Zabbix you can provide monitoring services for multiple customers in a multi-tenant environment
Zabbix positions itself as a universal monitoring solution for all possible use cases. Zabbix is 100% free and open-source, released under the GNU Affero General Public License version 3 (AGPLv3) the open source software license as set out at https://www.zabbix.com/license. This provides many unique benefits that you won’t find with proprietary software:
Zabbix frontend and documentation are available in many different languages. Our goal is to make Zabbix easy to use for people all over the globe. With Zabbix community localization tools you have the opportunity to help us translate Zabbix into your language.
You can read more about and take part in the Zabbix community translation effort here
Zabbix is a professionally developed open-source software with no limits or hidden costs