
1 System information
Overview
In Reports → System information, a summary of key Zabbix server and system data is displayed. System data is collected using internal items.
Note that in a high availability setup, it is possible to redirect the system information source (server instance). To do this, edit the zabbix.conf.php file - uncomment and set $ZBX_SERVER or both $ZBX_SERVER and $ZBX_SERVER_PORT to a server other than the one shown active. Note that when setting $ZBX_SERVER only, a default value (10051) for $ZBX_SERVER_PORT will be used.
With the high availability setup enabled, a separate block is displayed below the system stats with details of high availability nodes. This block is visible to Zabbix Super Admin users only.
System information is also available as a dashboard widget.
System stats
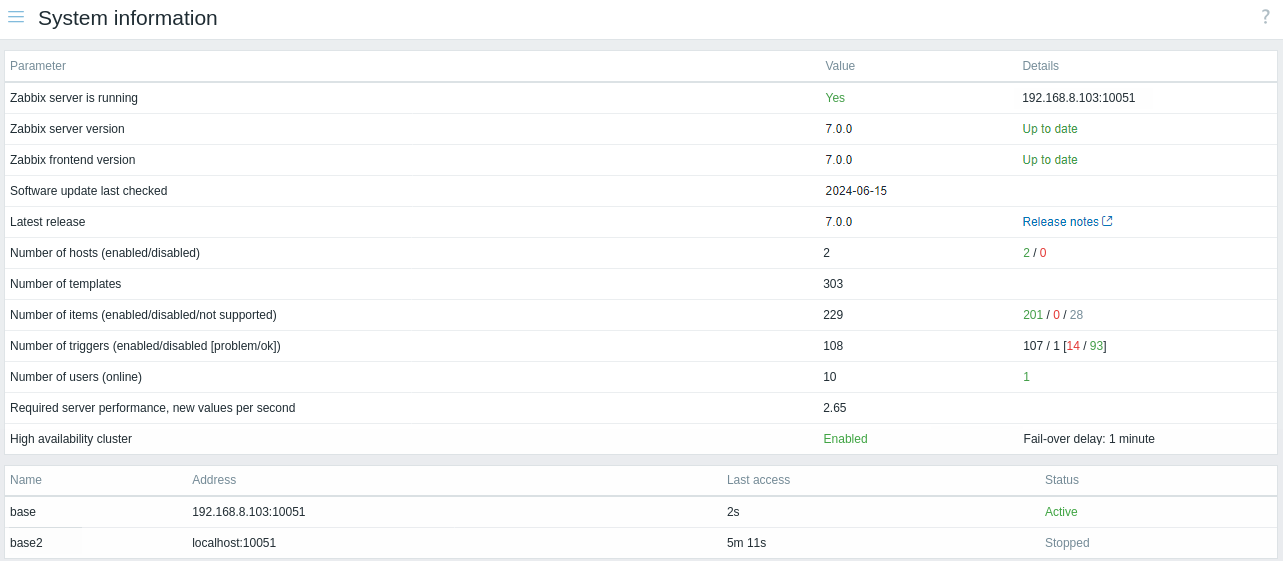
Displayed data:
| Parameter | Value | Details |
|---|---|---|
| Zabbix server is running | Status of Zabbix server: Yes - server is running No - server is not running Note: To display the rest of the information the web, frontend needs the server to be running and there must be at least one trapper process started on the server (StartTrappers parameter in zabbix_server.conf file > 0). |
Location and port of Zabbix server. |
| Zabbix server version | Current server version number is displayed. Note: It is only displayed when Zabbix server is running. |
Server version status is displayed: Up to date - using the latest version; New update available - a more up-to-date version is available; Outdated - the full support period for this version has expired. This information is only available if software update check is enabled in Zabbix server configuration. Nothing is displayed if the last software update check was performed more than a week ago or no data exist about the current version. |
| Zabbix frontend version | Zabbix frontend version number is displayed. | Zabbix frontend version status is displayed: Up to date - using the latest version; New update available - a more up-to-date version is available; Outdated - the full support period for this version has expired. This information is only available if software update check is enabled in Zabbix server configuration. Nothing is displayed if the last software update check was performed more than a week ago or no data exist about the current version. |
| Software update last checked | The date of the last Zabbix software update check is displayed. This information is only available if software update check is enabled in Zabbix server configuration. |
|
| Latest release | The number of a newer release (if available) for the current Zabbix version is displayed. This information is only available if software update check is enabled in Zabbix server configuration. Nothing is displayed if the last software update check was performed more than a week ago or no data exist about the current version. |
A link to the release notes of the latest available Zabbix release is displayed. |
| Number of hosts | Total number of hosts configured is displayed. | Number of monitored hosts/not monitored hosts. |
| Number of templates | Total number of templates is displayed. | |
| Number of items | Total number of items is displayed. | Number of monitored/disabled/unsupported host-level items. Items on disabled hosts are counted as disabled. |
| Number of triggers | Total number of triggers is displayed. | Number of enabled/disabled host-level triggers; split of the enabled triggers according to "Problem"/"OK" states. Triggers listed under the "OK" state include triggers with the status "Unknown". Triggers dependent on disabled items or assigned to disabled hosts are counted as disabled. |
| Number of users | Total number of users configured is displayed. | Number of users online. |
| Required server performance, new values per second | The expected number of new values processed by Zabbix server per second is displayed. | Required server performance is an estimate and can be useful as a guideline. For precise numbers of values processed, use the zabbix[wcache,values,all] internal item.Enabled items from monitored hosts are included in the calculation. Log items are counted as one value per item update interval. Regular interval values are counted; flexible and scheduling interval values are not. The calculation is not adjusted during a "nodata" maintenance period. Trapper items are not counted. |
| Global scripts on Zabbix server | Disabled will be displayed in this field if global scripts are disabled on Zabbix server by setting EnableGlobalScripts=0 in server configuration. | |
| High availability cluster | Status of high availability cluster for Zabbix server: Disabled - standalone server Enabled - at least one high availability node exists |
If enabled, the failover delay is displayed. |
System information will also display an error message in the following conditions:
- The database used does not have the required character set or collation (UTF-8).
- The version of the database is below or above the supported range (available only to users with the Super admin role type).
- Housekeeping for TimescaleDB is incorrectly configured (history or trend tables contain compressed chunks, but Override item history period or Override item trend period options are disabled).
High availability nodes
If high availability cluster is enabled, then another block of data is displayed with the status of each high availability node.
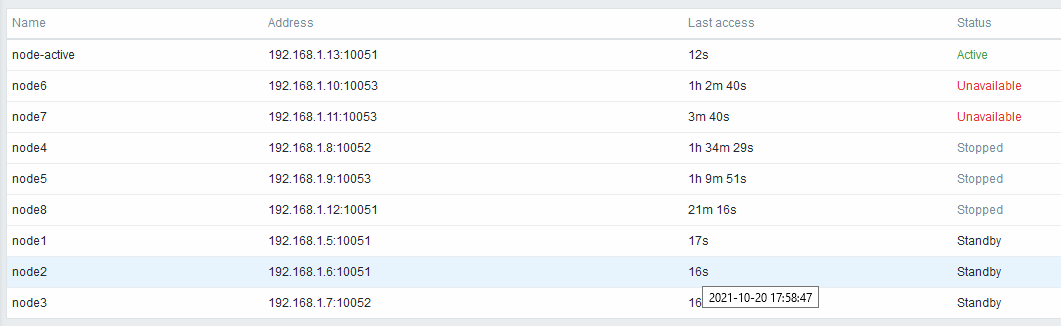
Displayed data:
| Column | Description |
|---|---|
| Name | Node name, as defined in server configuration. |
| Address | Node IP address and port. |
| Last access | Time of node last access. Hovering over the cell shows the timestamp of last access in long format. |
| Status | Node status. Table rows are sorted by these statuses in this priority order: Active - node is up and working Unavailable - node hasn't been seen for more than failover delay (you may want to find out why) Stopped - node has been stopped or couldn't start (you may want to start it or delete it) Standby - node is up and waiting |