
1 ダッシュボードウィジェット
概要
このセクションでは、ダッシュボードウィジェットに共通するパラメータの詳細を説明します。
共通パラメータ
以下のパラメータは、すべてのウィジェットに共通です。
| 名前 | ウィジェット名を入力します。 |
| 更新間隔 | デフォルトの更新間隔を設定します。 ウィジェットのデフォルト更新間隔は、ウィジェットの種類に応じて 更新なし から 15分 までです。例: - URL ウィジェットは 更新なし; - アクションログ ウィジェットは 1分; - 時計 ウィジェットは 15分。 更新間隔は、すべてのユーザーに対してデフォルト値として設定できます。ダッシュボードを編集モードに切り替え、ウィジェットを編集ボタンをクリックして、ドロップダウンリストから希望の更新間隔を選択します。 各ユーザーは、独自のウィジェット更新間隔を設定することもできます。ダッシュボードの表示モードで、ウィジェットの三点メニュー  ボタンをクリックし、ドロップダウンリストから希望の更新間隔を選択します。ユーザー固有の更新間隔はウィジェット設定より優先され、ウィジェット設定を変更しても保持される点に注意してください。 ボタンをクリックし、ドロップダウンリストから希望の更新間隔を選択します。ユーザー固有の更新間隔はウィジェット設定より優先され、ウィジェット設定を変更しても保持される点に注意してください。 |
| ヘッダーを表示 | チェックボックスをオンにすると、ウィジェットのヘッダーを常に表示します。 オフの場合、スペースを節約するためにヘッダーは非表示になり、ウィジェットにマウスオーバーしたときのみ表示されます(表示モード、編集モードの両方)。また、ウィジェットを新しい場所へドラッグしている間は、ヘッダーが半透明で表示されます。 |
個別パラメータ
各ウィジェットの個別パラメータを確認するには、各ウィジェットのページを参照してください。
- アクションログ
- 時計
- ディスカバリステータス
- お気に入りグラフ
- お気に入りマップ
- ゲージ
- ジオマップ
- グラフ
- グラフ(クラシック)
- グラフプロトタイプ
- ハニカム
- ホストの可用性
- ホストカード
- ホストナビゲーター
- アイテムカード
- アイテム履歴
- アイテムナビゲーター
- アイテム値
- マップ
- マップナビゲーションツリー
- 円グラフ
- 障害ホスト
- 障害
- 深刻度別障害
- SLAレポート
- システム情報
- 上位ホスト
- 上位アイテム
- 上位トリガー
- トリガー概要
- URL
- Web監視
動的パラメーター
複数のウィジェットには、他のウィジェットまたはダッシュボード間で設定データを共有できるようにするパラメーターがあります。
ホストグループ、ホスト、アイテム、アイテムリスト
ホストグループ、ホスト、アイテム、およびアイテムリストパラメータでは、対応するエンティティ、またはウィジェットがデータを表示できるホストグループ、ホスト、またはアイテムを含むデータソースのいずれかを選択できます。
ホストグループ、アイテム、およびアイテムリストパラメータでは、データソースとして同じダッシュボード内の互換性のあるウィジェットを指定できます。
ホストパラメータでは、データソースとして同じダッシュボード内の互換性のあるウィジェット、またはダッシュボード自体を指定できます。
マップウィジェットも、ホストグループおよびホストのデータを互換性のあるウィジェットにブロードキャストできます。 詳細については、ウィジェットの動作を参照してください。
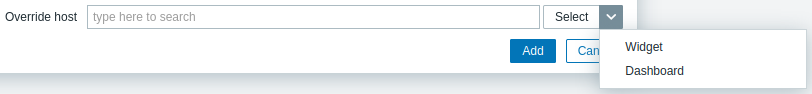
ホストの上書き
ホストの上書きパラメータでは、ウィジェットがデータを表示する対象のホストを含むデータソースを選択できます。 データソースには、同じダッシュボード上の互換性のあるウィジェット、またはダッシュボード自体を指定できます。
-
互換性のあるウィジェットを指定するには、その名前を入力して選択します。 または、選択ボタン(またはドロップダウンボタンをクリックしてから「ウィジェット」)をクリックすると、利用可能なウィジェットのポップアップが開きます。
-
ダッシュボードを指定するには、ドロップダウンボタンをクリックしてから「ダッシュボード」を選択します。 ダッシュボードを保存すると、ダッシュボードの上部にホストフィールド(ホストを選択するためのフィールド)が表示されます。

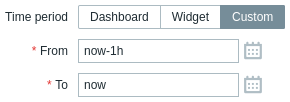
期間
期間パラメータでは、ウィジェットがデータを表示する期間を含むデータソースを選択できます。 データソースには、同じダッシュボード上の互換性のあるウィジェット、ダッシュボード自体、またはウィジェット自体に設定された期間を指定できます。
-
互換性のあるウィジェットを指定するには、期間を「ウィジェット」に設定し、その名前を入力して選択します。 または、選択ボタンをクリックして、利用可能なウィジェットのポップアップを開きます。
-
ダッシュボードを指定するには、期間を「ダッシュボード」に設定します。 ダッシュボードを保存すると、ダッシュボードの上部に期間セレクターが表示されます。
-
ウィジェット自体で期間を設定するには、期間を「カスタム」に設定し、期間の開始時刻と終了時刻を入力または選択します。
ウィジェットの期間設定に関係なく、互換性のあるウィジェットはそのウィジェットを期間のデータソースとして使用できます。
ウィジェットの動作
ウィジェットは、他のウィジェットにデータをブロードキャストする方法がそれぞれ異なります。
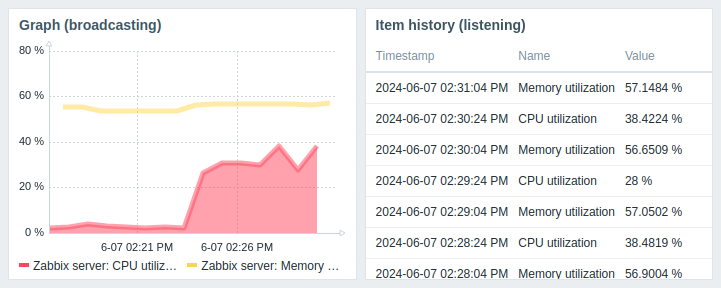
データをブロードキャストできるすべてのウィジェットは、作成時に自動的にブロードキャストを開始します。
たとえば、Graph ウィジェットは、時間範囲データをただちにリッスンしているウィジェットへブロードキャストします。
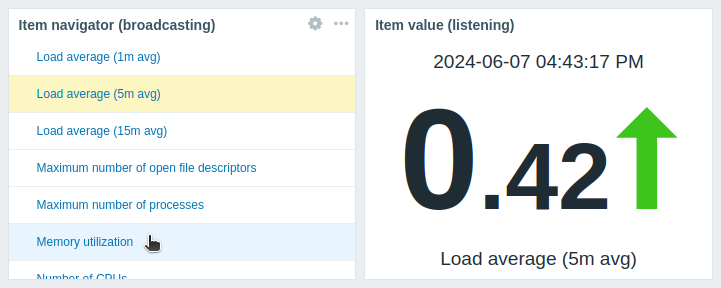
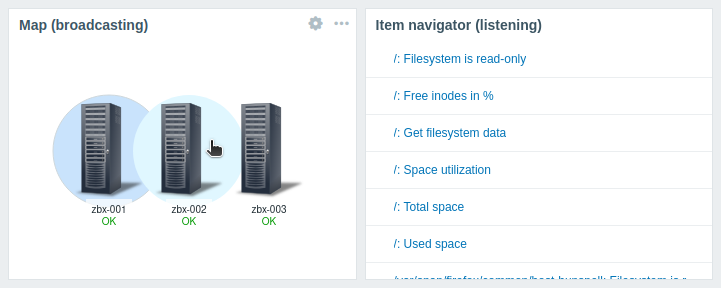
エンティティ選択をサポートするウィジェット(例: Item navigator)は、最初に利用可能なエンティティに対して自動的にデータをブロードキャストします。
たとえば、Item navigator ウィジェットは、アイテム一覧の最初のアイテムに対してデータをブロードキャストします。
別のアイテムが選択されると、そのアイテムに対してデータをブロードキャストします。
マウスオーバー時にはアイテムが薄い青色で強調表示され、選択時には黄色で強調表示されます。
Map ウィジェットも、利用可能な最初の要素(例: ホスト)に対して自動的にデータをブロードキャストします。この要素は、ウィジェットのビューポートの左上隅に最も近いものです(Geomap ウィジェットでは、ウィジェットのビューポートの中央に最も近いもの)。
別の要素が選択されると、その要素に対してデータをブロードキャストします。
マウスオーバー時には要素が薄い青色で強調表示され、選択時には濃い青色で強調表示されます。
ウィジェットには、他のウィジェットからデータをリッスンする際の特定の動作もあります。
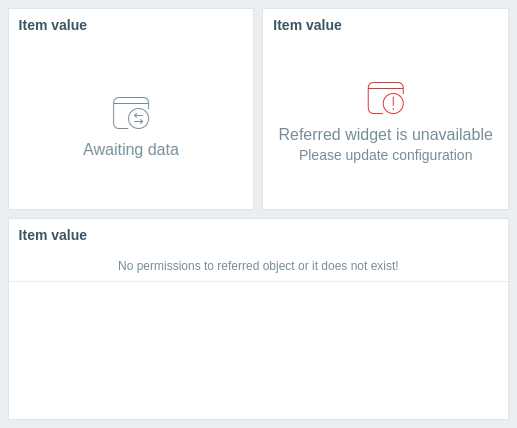
- データソースのウィジェットがデータをブロードキャストしていない場合、リッスン側のウィジェットは Awaiting data 状態になります。
- データソースのウィジェットが削除された、互換性のないウィジェットに置き換えられた、または別のダッシュボードページに移動された場合、リッスン側のウィジェットは Referred widget is unavailable 状態になります。
- データソース(ウィジェットまたはダッシュボード)で指定されたホストに、リッスン側のウィジェットで設定されたエンティティ(アイテム、グラフ、マップなど)が存在しない場合、またはユーザーにそのホストへアクセスする権限がない場合、リッスン側のウィジェットには次のメッセージが表示されます: "No permissions to referred object or it does not exist!"
各ウィジェットのブロードキャストおよびリッスン機能については、ウィジェットの互換性を参照してください。
ウィジェットの互換性
一部のウィジェットは設定データを他のウィジェットにブロードキャストでき、一部はデータを受信でき、さらに両方を行えるものもあります。たとえば、次のとおりです。
- Action log ウィジェットは、Graph、Graph (classic)、Graph prototype ウィジェットから期間データのみを取得できます。
- Geomap ウィジェットは、ホストデータをそれを受信するウィジェット(Honeycomb、Top items など)にブロードキャストでき、また、ホストグループおよびホストデータをそれをブロードキャストするウィジェット(Honeycomb、Problem hosts など)から受信することもできます。
- Clock ウィジェットは、いかなるデータもブロードキャストまたは受信できません。
次の表は、各ウィジェットのブロードキャストおよび受信の機能を示しています。
| Widget | Broadcasts | Listens |
|---|---|---|
| Action log | - | 期間 |
| Clock | - | - |
| Discovery status | - | - |
| Favorite graphs | - | - |
| Favorite maps | - | - |
| Gauge | - | ホスト, アイテム |
| Geomap | ホスト | ホストグループ, ホスト |
| Graph | 期間 | ホスト, アイテム, 期間 |
| Graph (classic) | 期間 | ホスト, アイテム, Graphs, 期間 |
| Graph prototype | 期間 | ホスト, 期間 |
| Honeycomb | ホスト, アイテム | ホストグループ, ホスト |
| Host availability | - | ホストグループ |
| Host card | - | ホスト |
| Host navigator | ホスト | ホストグループ |
| Item card | - | ホスト, アイテム, 期間 |
| Item history | アイテム | ホスト, 期間 |
| Item navigator | アイテム | ホストグループ, ホスト |
| Item value | - | ホスト, アイテム, 期間 |
| Map | ホストグループ, ホスト | Maps |
| Map navigation tree | Maps | - |
| Pie chart | - | アイテム, 期間 |
| Problem hosts | ホストグループ | ホストグループ, ホスト |
| Problems | Events | ホストグループ, ホスト |
| Problems by severity | ホストグループ | ホストグループ, ホスト |
| SLA report | - | - |
| System information | - | - |
| Top hosts | ホスト | ホストグループ, ホスト |
| Top items | - | ホストグループ, ホスト |
| Top triggers | - | 期間 |
| Trigger overview | - | ホストグループ, ホスト |
| URL | - | ホスト |
| Web monitoring | ホストグループ | ホストグループ, ホスト |