
创建小部件(教程)
这是一个分步教程,展示了如何创建一个简单的仪表板小部件。 您可以将此小部件的所有文件下载为 ZIP 存档:lesson_gauge_chart.zip。
您将构建的内容
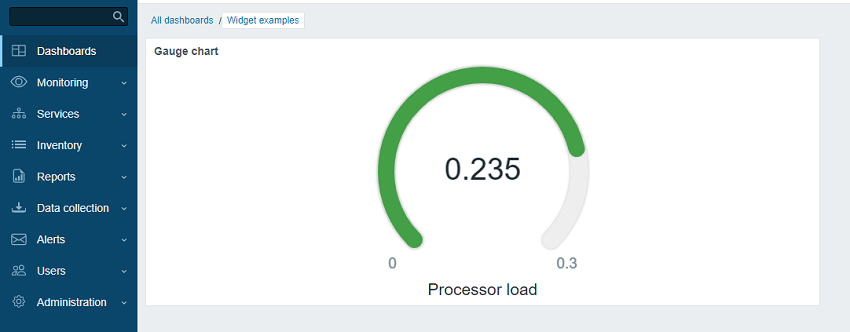
在本教程中,您将首先构建一个基础“Hello, world!”小部件,然后将其转换为一个更高级的小部件,以仪表图的形式显示监控项值。 完成后的小部件如下所示:
第一部分 - “Hello, world!”
在本部分中,您将学习如何创建所需的最小小部件元素并向 Zabbix 前端添加新小部件。
向 Zabbix 前端添加一个空白小部件
- 在 Zabbix 前端安装目录的 modules 目录中创建一个 lesson_gauge_chart 目录(例如,zabbix/ui/modules)。
所有自定义小部件都被视为外部模块,必须添加到 Zabbix 前端安装目录的 modules 目录中(例如,zabbix/ui/modules)。 目录 zabbix/ui/widgets 保留给 Zabbix 内置小部件,并会随 Zabbix UI 一起更新。
- 创建一个包含基本小部件元数据的 manifest.json 文件(请参见支持的 参数 说明)。
ui/modules/lesson_gauge_chart/manifest.json
{
    "manifest_version": 2.0,
    "id": "lesson_gauge_chart",
    "type": "widget",
    "name": "Gauge chart",
    "namespace": "LessonGaugeChart",
    "version": "1.1",
    "author": "Zabbix"
}- 在 Zabbix 前端中,转到 Administration > General > Modules 部分,然后点击 Scan directory 按钮。
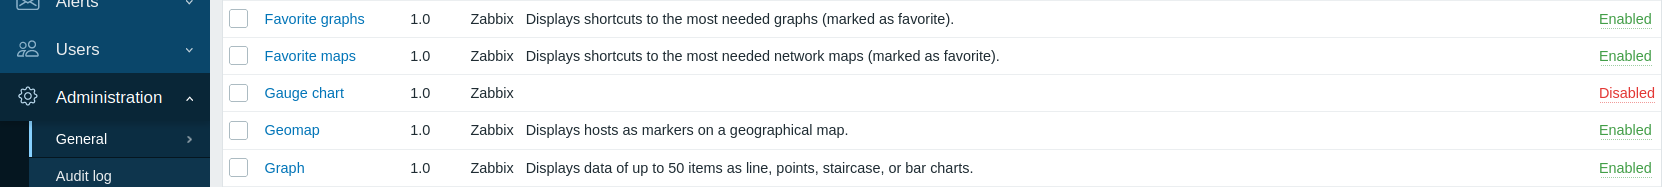
- 在列表中找到新模块 Gauge chart,然后点击 "Disabled" 超链接,将模块状态从 "Disabled" 更改为 "Enabled"(如果列表中未显示该模块,请参见 troubleshooting 部分)。
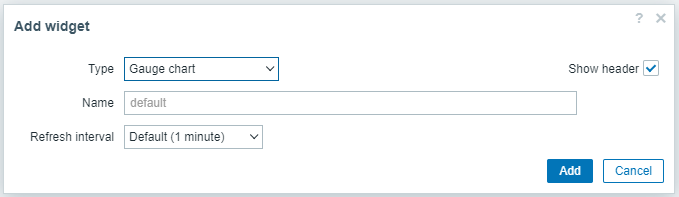
- 打开一个仪表板,将其切换到编辑模式并添加一个新小部件。 在 Type 字段中选择 "Gauge chart"。
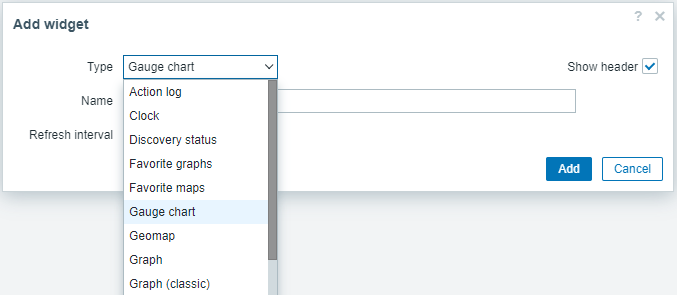
- 此时,Gauge chart 小部件配置中只包含通用小部件字段 Name 和 Refresh interval。 点击 Add 将小部件添加到仪表板。
- 仪表板上应显示一个空白小部件。 点击右上角的 Save changes 保存仪表板。
![]()
添加 widget 视图
widget 的 view 文件应位于 views 目录中(在本教程中为 ui/modules/lesson_gauge_chart/views/)。 如果文件使用默认名称 widget.view.php,则无需在 manifest.json 文件中注册它。 如果文件使用其他名称,请在 manifest.json 文件的 actions/widget.lesson_gauge_chart.view 部分中指定它。
-
在 lesson_gauge_chart 目录中创建一个 views 目录。
-
在 views 目录中创建一个 widget.view.php 文件。
ui/modules/lesson_gauge_chart/views/widget.view.php
<?php

/**
 * 仪表图 widget 视图。
 *
 * @var CView $this
 * @var array $data
 */

(new CWidgetView($data))
    ->addItem(
        new CTag('h1', true, 'Hello, world!')
    )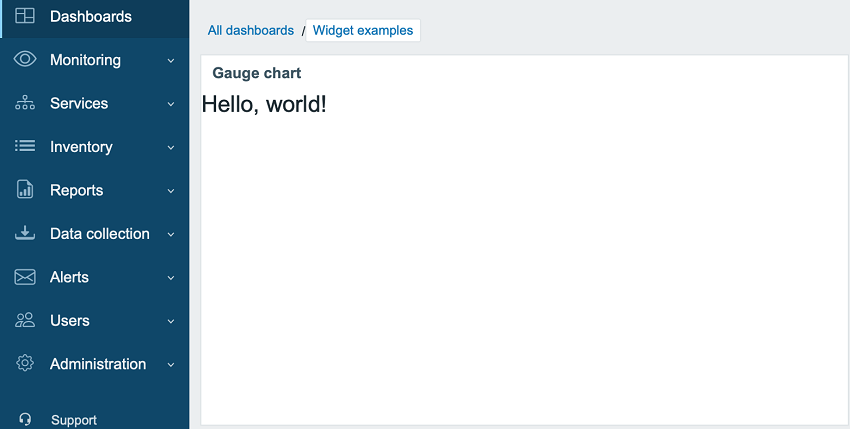
->show();- 刷新仪表板。 现在,Gauge chart widget 会显示“Hello, world!”。
第二部分 - 仪表图
向配置视图添加设置并在 widget 视图中使用它们
在本节中,你将学习如何添加 widget 配置字段,并将输入的值作为文本显示在 widget 视图中。
widget 配置由一个表单(Zabbix\Widgets\CWidgetForm)和一个 widget 表单视图(widget.edit.php)组成。
要添加字段(Zabbix\Widgets\CWidgetField),你需要创建一个 WidgetForm 类,该类将继承 Zabbix\Widgets\CWidgetForm。
表单包含一组不同类型的字段(Zabbix\Widgets\CWidgetField),用于验证用户输入的值。
每种输入元素对应的表单字段(Zabbix\Widgets\CWidgetField)会将值转换为统一格式,以便存储到数据库中。
widget 的 form 文件应位于 includes 目录中(本教程中为 ui/modules/lesson_gauge_chart/includes/)。
如果文件使用默认名称 WidgetForm.php,则无需在 manifest.json 文件中注册。
如果文件名称不同,请在 manifest.json 文件的 widget/form_class 部分中指定。
-
在 lesson_gauge_chart 目录中创建一个新的 includes 目录。
-
在 includes 目录中创建一个 WidgetForm.php 文件。
ui/modules/lesson_gauge_chart/includes/WidgetForm.php
<?php

namespace Modules\LessonGaugeChart\Includes;

use Zabbix\Widgets\CWidgetForm;

class WidgetForm extends CWidgetForm {
}- 向 widget 配置表单添加一个 Description 字段。
这是一个普通文本字段,用户可以输入任意字符集。
你可以为此使用 CWidgetFieldTextBox 类。
ui/modules/lesson_gauge_chart/includes/WidgetForm.php
<?php

namespace Modules\LessonGaugeChart\Includes;

use Zabbix\Widgets\CWidgetForm;

use Zabbix\Widgets\Fields\CWidgetFieldTextBox;

class WidgetForm extends CWidgetForm {

    public function addFields(): self {
        return $this
            ->addField(
               new CWidgetFieldTextBox('description', _('Description'))
            );
   }
}- 在 views 目录中,创建一个 widget 配置视图文件 widget.edit.php,并为新的 Description 字段添加一个视图。
对于 CWidgetFieldTextBox 字段类,其视图为 CWidgetFieldTextBoxView。
ui/modules/lesson_gauge_chart/views/widget.edit.php
<?php

/**
 * Gauge chart widget form view.
 *
 * @var CView $this
 * @var array $data
 */

(new CWidgetFormView($data))
    ->addField(
        new CWidgetFieldTextBoxView($data['fields']['description'])
    )
->show();-
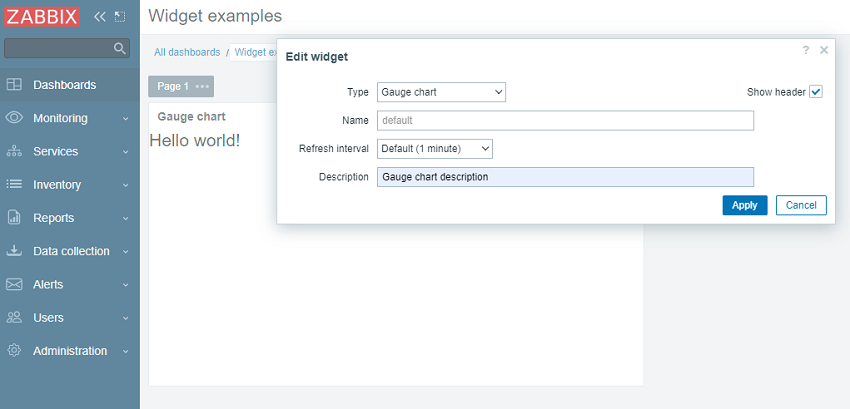
转到仪表板,并点击 widget 中的齿轮图标以打开 widget 配置表单。
-
widget 配置表单现在包含一个新的 Description 文本字段。
输入任意值,例如 Gauge chart description。
- 在 widget 配置表单中点击 Apply。
然后点击右上角的 Save changes 保存仪表板。
请注意,新的描述在任何地方都不可见,而 widget 仍然显示 "Hello, world!"。
要让新的描述显示在 widget 中,需要从数据库中获取 Description 字段的值并将其传递给 widget 视图。
为此,你需要创建一个 action 类。
-
在 lesson_gauge_chart 目录中创建一个新的 actions 目录。
-
在 actions 目录中创建一个 WidgetView.php 文件。
WidgetView action 类将继承 CControllerDashboardWidgetView 类。
widget 配置字段的值存储在 action 类的 $fields_values 属性中。
ui/modules/lesson_gauge_chart/actions/WidgetView.php
<?php

namespace Modules\LessonGaugeChart\Actions;

use CControllerDashboardWidgetView,
    CControllerResponseData;

class WidgetView extends CControllerDashboardWidgetView {

    protected function doAction(): void {
        $this->setResponse(new CControllerResponseData([
            'name' => $this->getInput('name', $this->widget->getName()),
            'description' => $this->fields_values['description'],
            'user' => [
                'debug_mode' => $this->getDebugMode()
            ]
        ]));
    }
}- 打开 manifest.json,并在 actions/widget.lesson_gauge_chart.view 部分将 WidgetView 注册为 action 类。
ui/modules/lesson_gauge_chart/manifest.json
{
    "manifest_version": 2.0,
    "id": "lesson_gauge_chart",
    "type": "widget",
    "name": "Gauge chart",
    "namespace": "LessonGaugeChart",
    "version": "1.0",
    "author": "Zabbix",
    "actions": {
        "widget.lesson_gauge_chart.view": {
            "class": "WidgetView"
        }
    }
}- 现在你可以在 widget 视图中使用 $data['description'] 中包含的 description 字段值。
打开 views/widget.view.php,并将静态文本 "Hello, world!" 替换为 $data['description']。
ui/modules/lesson_gauge_chart/views/widget.view.php
<?php

/**
 * Gauge chart widget view.
 *
 * @var CView $this
 * @var array $data
 */

(new CWidgetView($data))
    ->addItem(
        new CTag('h1', true, $data['description'])
    )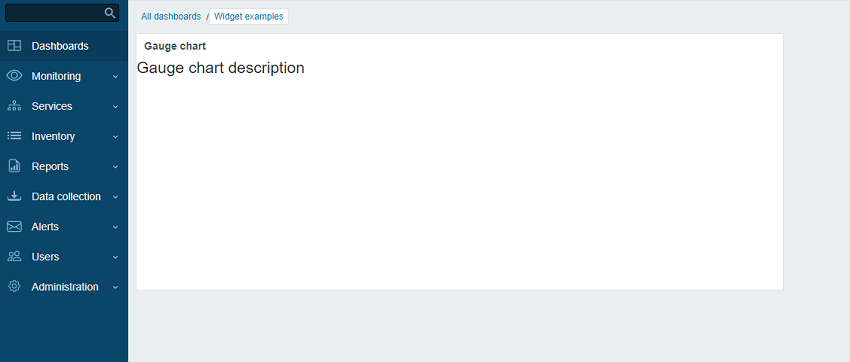
->show();- 刷新仪表板页面。
现在你应该会看到 widget 描述文本,而不是 "Hello, world!"。
通过 API 获取监控项值
该小部件应显示用户所选监控项的最新值。
为此,需要在小部件配置中增加选择监控项的能力。
在本节中,你将学习如何在小部件表单中添加监控项选择字段,以及如何在配置视图中添加该字段的可视化部分。
随后,小部件控制器将能够通过 API 请求获取监控项数据及其值。
收到值后,就可以在小部件视图中显示出来。
- 打开 includes/WidgetForm.php,并添加 CWidgetFieldMultiSelectItem 字段。
这将允许在配置表单中选择一个监控项。
ui/modules/lesson_gauge_chart/includes/WidgetForm.php
<?php

namespace Modules\LessonGaugeChart\Includes;

use Zabbix\Widgets\{
    CWidgetField,
    CWidgetForm
};

use Zabbix\Widgets\Fields\{
    CWidgetFieldMultiSelectItem,
    CWidgetFieldTextBox
};

/**
 * Gauge chart widget form.
 */
class WidgetForm extends CWidgetForm {

    public function addFields(): self {
        return $this
            ->addField(
                (new CWidgetFieldMultiSelectItem('itemid', _('Item')))
                    ->setFlags(CWidgetField::FLAG_NOT_EMPTY | CWidgetField::FLAG_LABEL_ASTERISK)
                    ->setMultiple(false)
            )
            ->addField(
                new CWidgetFieldTextBox('description', _('Description'))
            );
    }
}- 打开 views/widget.edit.php,并将该字段的可视化组件添加到配置视图中。
ui/modules/lesson_gauge_chart/views/widget.edit.php
<?php

/**
 * Gauge chart widget form view.
 *
 * @var CView $this
 * @var array $data
 */

(new CWidgetFormView($data))
    ->addField(
        new CWidgetFieldMultiSelectItemView($data['fields']['itemid'])
    )
    ->addField(
        new CWidgetFieldTextBoxView($data['fields']['description'])
    )
->show();-
返回仪表板,并单击小部件中的齿轮图标以打开小部件配置表单。
-
现在,小部件配置表单中包含一个新的输入字段 Item。
选择主机 "Zabbix server" 和监控项 "Load average (1m avg)"。
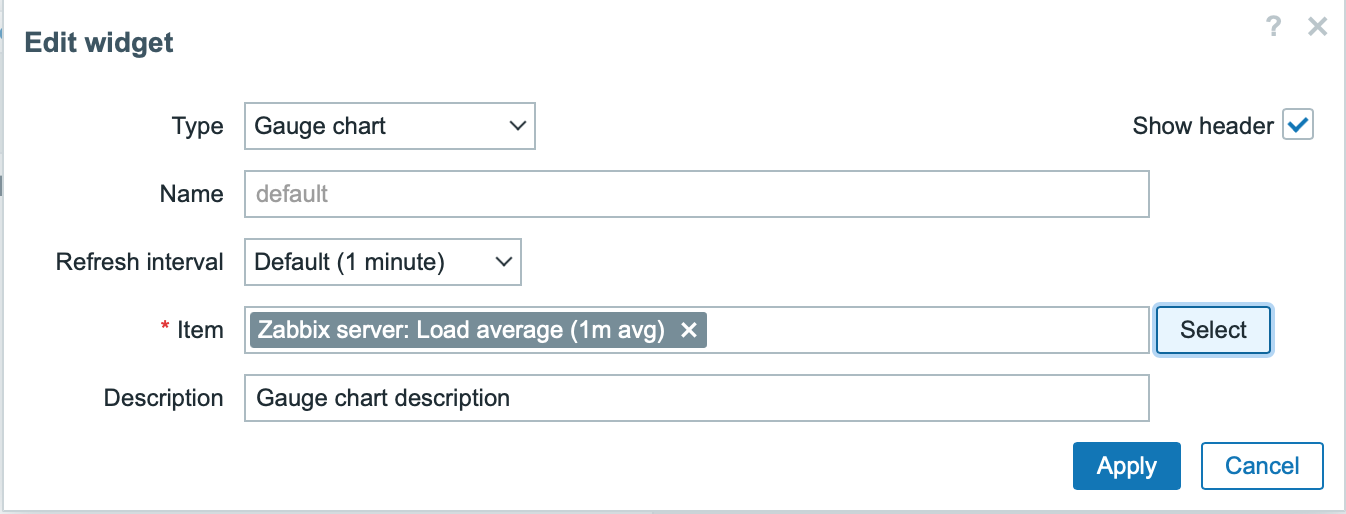
-
在小部件配置表单中单击 Apply。
然后单击右上角的 Save changes 以保存仪表板。 -
打开并修改 actions/WidgetView.php。
从现在开始,监控项 ID 将可在小部件控制器中的 $this->fields_values['itemid'] 中获取。
doAction() 控制器方法会使用 API 方法 item.get 收集监控项数据(名称、值类型、单位),并使用 API 方法 history.get 获取监控项的最新值。
ui/modules/lesson_gauge_chart/actions/WidgetView.php
<?php

namespace Modules\LessonGaugeChart\Actions;

use API,
    CControllerDashboardWidgetView,
    CControllerResponseData;

class WidgetView extends CControllerDashboardWidgetView {

    protected function doAction(): void {
        $db_items = API::Item()->get([
            'output' => ['itemid', 'value_type', 'name', 'units'],
            'itemids' => $this->fields_values['itemid'],
            'webitems' => true,
            'filter' => [
                'value_type' => [ITEM_VALUE_TYPE_UINT64, ITEM_VALUE_TYPE_FLOAT]
            ]
        ]);

        $value = null;

        if ($db_items) {
            $item = $db_items[0];

            $history = API::History()->get([
                'output' => API_OUTPUT_EXTEND,
                'itemids' => $item['itemid'],
                'history' => $item['value_type'],
                'sortfield' => 'clock',
                'sortorder' => ZBX_SORT_DOWN,
                'limit' => 1
            ]);

            if ($history) {
                $value = convertUnitsRaw([
                    'value' => $history[0]['value'],
                    'units' => $item['units']
                ]);
            }
        }

        $this->setResponse(new CControllerResponseData([
            'name' => $this->getInput('name', $this->widget->getName()),
            'value' => $value,
            'description' => $this->fields_values['description'],
            'user' => [
                'debug_mode' => $this->getDebugMode()
            ]
        ]));
    }
}- 打开 views/widget.view.php,并将监控项值添加到小部件视图中。
ui/modules/lesson_gauge_chart/views/widget.view.php
<?php

/**
 * Gauge chart widget view.
 *
 * @var CView $this
 * @var array $data
 */

(new CWidgetView($data))
    ->addItem([
        new CTag('h1', true, $data['description']),
        new CDiv($data['value'] !== null ? $data['value']['value'] : _('No data'))
    ])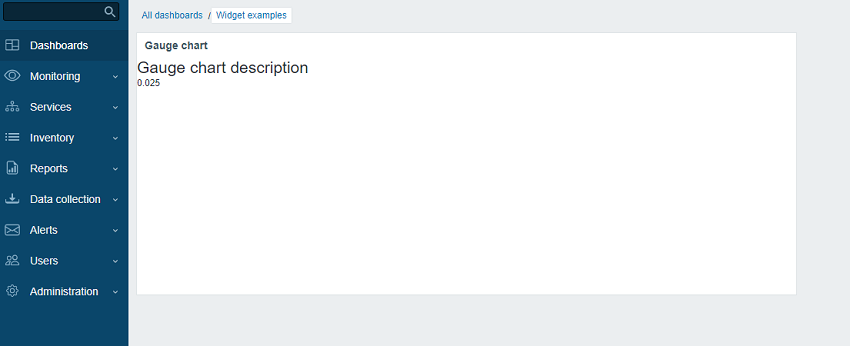
->show();- 刷新仪表板页面。
小部件将显示最新的监控项值。
将高级配置设置添加到配置视图
在本节中,你将学习如何添加一个可展开/折叠的 Advanced configuration 部分,其中包含可选参数,例如颜色、最小值和最大值、单位,以及前面创建的 Description 字段。
- 在主 widget 目录 lesson_gauge_chart 中创建一个 Widget.php 文件,以创建一个新的 Widget 类。
Widget 类将扩展 CWidget 基类,以添加/覆盖默认的 widget 设置(在本例中为翻译)。 下面提供的 JavaScript 会在缺少数据时显示字符串 "No data"。 字符串 "No data" 已存在于 Zabbix UI 翻译文件中。
如果存在任何 widget 常量,建议也在 Widget 类中将其定义出来。
ui/modules/lesson_gauge_chart/Widget.php
<?php

namespace Modules\LessonGaugeChart;

use Zabbix\Core\CWidget;

class Widget extends CWidget {

    public const UNIT_AUTO = 0;
    public const UNIT_STATIC = 1;

    public function getTranslationStrings(): array {
        return [
            'class.widget.js' => [
                'No data' => _('No data')
            ]
        ];
    }
}- 打开 includes/WidgetForm.php,添加新的字段 Color(颜色选择器)、Min(数值字段)、Max(数值字段)和 Units(下拉选择),并为颜色选择器定义默认调色板,以便在后续步骤中使用。
ui/modules/lesson_gauge_chart/includes/WidgetForm.php
<?php

namespace Modules\LessonGaugeChart\Includes;

use Modules\LessonGaugeChart\Widget;

use Zabbix\Widgets\{
    CWidgetField,
    CWidgetForm
};

use Zabbix\Widgets\Fields\{
    CWidgetFieldColor,
    CWidgetFieldMultiSelectItem,
    CWidgetFieldNumericBox,
    CWidgetFieldSelect,
    CWidgetFieldTextBox
};

/**
 * Gauge chart widget form.
 */
class WidgetForm extends CWidgetForm {

    public const DEFAULT_COLOR_PALETTE = [
        'FF465C', 'B0AF07', '0EC9AC', '524BBC', 'ED1248', 'D1E754', '2AB5FF', '385CC7', 'EC1594', 'BAE37D',
        '6AC8FF', 'EE2B29', '3CA20D', '6F4BBC', '00A1FF', 'F3601B', '1CAE59', '45CFDB', '894BBC', '6D6D6D'
    ];

    public function addFields(): self {
        return $this
            ->addField(
                (new CWidgetFieldMultiSelectItem('itemid', _('Item')))
                    ->setFlags(CWidgetField::FLAG_NOT_EMPTY | CWidgetField::FLAG_LABEL_ASTERISK)
                    ->setMultiple(false)
            )
            ->addField(
                (new CWidgetFieldColor('chart_color', _('Color')))->setDefault('FF0000')
            )
            ->addField(
                (new CWidgetFieldNumericBox('value_min', _('Min')))
                    ->setDefault(0)
                    ->setFlags(CWidgetField::FLAG_NOT_EMPTY | CWidgetField::FLAG_LABEL_ASTERISK)
            )
            ->addField(
                (new CWidgetFieldNumericBox('value_max', _('Max')))
                    ->setDefault(100)
                    ->setFlags(CWidgetField::FLAG_NOT_EMPTY | CWidgetField::FLAG_LABEL_ASTERISK)
            )
            ->addField(
                (new CWidgetFieldSelect('value_units', _('Units'), [
                    Widget::UNIT_AUTO => _x('Auto', 'history source selection method'),
                    Widget::UNIT_STATIC => _x('Static', 'history source selection method')
                ]))->setDefault(Widget::UNIT_AUTO)
            )
            ->addField(
                (new CWidgetFieldTextBox('value_static_units'))
            )
            ->addField(
                new CWidgetFieldTextBox('description', _('Description'))
            );
    }
}- 打开 views/widget.edit.php,并将字段的可视化组件添加到配置视图中。
ui/modules/lesson_gauge_chart/views/widget.edit.php
<?php

/**
 * Gauge chart widget form view.
 *
 * @var CView $this
 * @var array $data
 */

$lefty_units = new CWidgetFieldSelectView($data['fields']['value_units']);
$lefty_static_units = (new CWidgetFieldTextBoxView($data['fields']['value_static_units']))
    ->setPlaceholder(_('value'))
    ->setWidth(ZBX_TEXTAREA_TINY_WIDTH);

(new CWidgetFormView($data))
    ->addField(
        (new CWidgetFieldMultiSelectItemView($data['fields']['itemid']))
            ->setPopupParameter('numeric', true)
    )
    ->addFieldset(
        (new CWidgetFormFieldsetCollapsibleView(_('Advanced configuration')))
            ->addField(
                new CWidgetFieldColorView($data['fields']['chart_color'])
            )
            ->addField(
                new CWidgetFieldNumericBoxView($data['fields']['value_min'])
            )
            ->addField(
                new CWidgetFieldNumericBoxView($data['fields']['value_max'])
            )
            ->addItem([
                $lefty_units->getLabel(),
                (new CFormField([
                    $lefty_units->getView()->addClass(ZBX_STYLE_FORM_INPUT_MARGIN),
                    $lefty_static_units->getView()
                ]))
            ])
            ->addField(
                new CWidgetFieldTextBoxView($data['fields']['description'])
            )
    )
    ->show();
CWidgetFormView 类的 addField() 方法将 CSS 类字符串作为第二个参数。
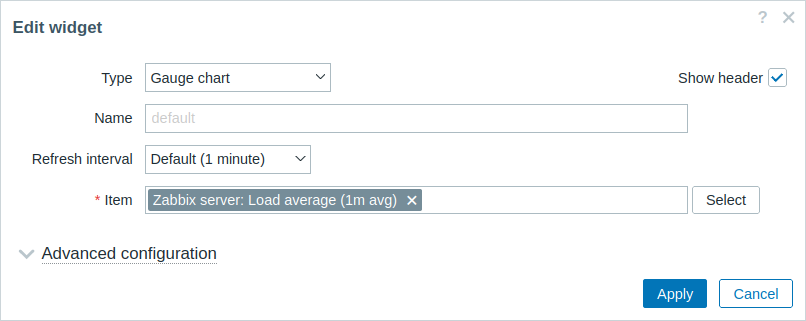
- 返回仪表板,切换到编辑模式,然后点击 widget 中的齿轮图标以打开 widget 配置表单。 现在,widget 配置表单包含一个新的可展开/折叠部分 Advanced configuration。
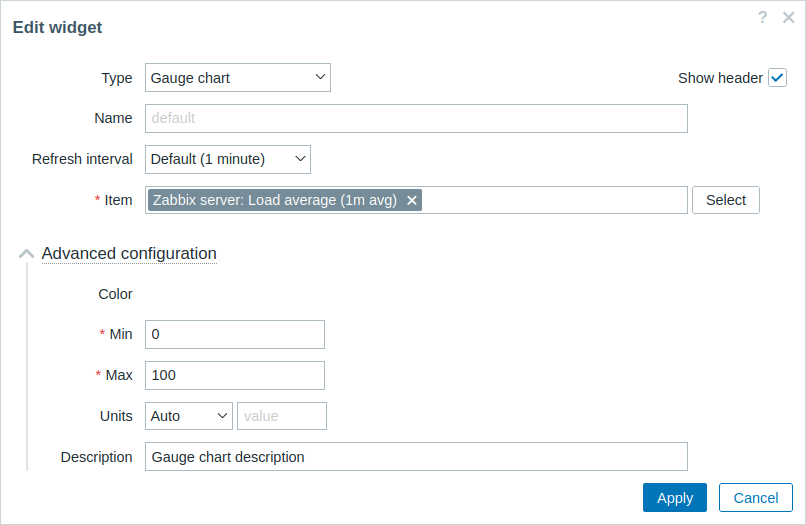
- 展开 Advanced configuration 部分以查看其他 widget 配置字段。 请注意,字段 Color 目前还没有颜色选择器。 这是因为颜色选择器必须通过 JavaScript 初始化,这部分内容将在下一节中添加 - Add JavaScript to the widget。
将 JavaScript 添加到 widget
在本节中,你将学习如何添加一个使用 JavaScript 制作的仪表图,用于显示最新值是正常、过高还是过低。
- 在 views 目录中创建 widget.edit.js.php 文件。
JavaScript 将负责在配置视图中初始化颜色选择器。
ui/modules/lesson_gauge_chart/views/widget.edit.js.php
<?php

use Modules\LessonGaugeChart\Widget;

?>

window.widget_lesson_gauge_chart_form = new class {

    init({color_palette}) {
        this._unit_select = document.getElementById('value_units');
        this._unit_value = document.getElementById('value_static_units');

        this._unit_select.addEventListener('change', () => this.updateForm());

        colorPalette.setThemeColors(color_palette);

        for (const colorpicker of jQuery('.<?= ZBX_STYLE_COLOR_PICKER ?> input')) {
            jQuery(colorpicker).colorpicker();
        }

        const overlay = overlays_stack.getById('widget_properties');

        for (const event of ['overlay.reload', 'overlay.close']) {
            overlay.$dialogue[0].addEventListener(event, () => { jQuery.colorpicker('hide'); });
        }

        this.updateForm();
    }

    updateForm() {
        this._unit_value.disabled = this._unit_select.value == <?= Widget::UNIT_AUTO ?>;
    }
};- 打开 views/widget.edit.php,并将 widget.edit.js.php 文件中的 JavaScript 添加到配置视图中。
为此,请使用 includeJsFile() 方法。
若要添加内联 JavaScript,请使用 addJavaScript() 方法。
ui/modules/lesson_gauge_chart/views/widget.edit.php
<?php

/**
 * Gauge chart widget form view.
 *
 * @var CView $this
 * @var array $data
 */

use Modules\LessonGaugeChart\Includes\WidgetForm;

$lefty_units = new CWidgetFieldSelectView($data['fields']['value_units']);
$lefty_static_units = (new CWidgetFieldTextBoxView($data['fields']['value_static_units']))
    ->setPlaceholder(_('value'))
    ->setWidth(ZBX_TEXTAREA_TINY_WIDTH);

(new CWidgetFormView($data))
    ->addField(
        (new CWidgetFieldMultiSelectItemView($data['fields']['itemid']))
            ->setPopupParameter('numeric', true)
    )
    ->addFieldset(
        (new CWidgetFormFieldsetCollapsibleView(_('Advanced configuration')))
            ->addField(
                new CWidgetFieldColorView($data['fields']['chart_color'])
            )
            ->addField(
                new CWidgetFieldNumericBoxView($data['fields']['value_min'])
            )
            ->addField(
                new CWidgetFieldNumericBoxView($data['fields']['value_max'])
            )
            ->addItem([
                $lefty_units->getLabel(),
                (new CFormField([
                    $lefty_units->getView()->addClass(ZBX_STYLE_FORM_INPUT_MARGIN),
                    $lefty_static_units->getView()
                ]))
            ])
            ->addField(
                new CWidgetFieldTextBoxView($data['fields']['description'])
            )
    )
    ->includeJsFile('widget.edit.js.php')
    ->addJavaScript('widget_lesson_gauge_chart_form.init('.json_encode([
        'color_palette' => WidgetForm::DEFAULT_COLOR_PALETTE
    ], JSON_THROW_ON_ERROR).');')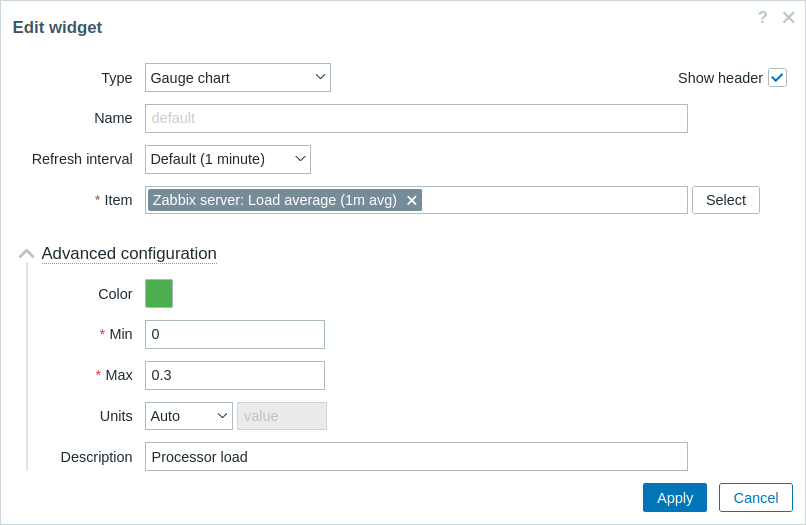
->show();- 返回仪表板,点击 widget 中的齿轮图标以打开 widget 配置表单。
然后展开 Advanced configuration 部分,查看已初始化的颜色选择器。
填写各字段的值,并为仪表图选择一种颜色。
-
在 widget 配置表单中点击 Apply。
然后点击右上角的 Save changes 保存仪表板。 -
打开 actions/WidgetView.php 并更新控制器。
现在,$this->fields_values 属性包含所有 Advanced configuration 字段的值。
完成控制器,以便将配置和所选监控项值传递给 widget 视图。
ui/modules/lesson_gauge_chart/actions/WidgetView.php
<?php

namespace Modules\LessonGaugeChart\Actions;

use API,
    CControllerDashboardWidgetView,
    CControllerResponseData;

class WidgetView extends CControllerDashboardWidgetView {

    protected function doAction(): void {
        $db_items = API::Item()->get([
            'output' => ['itemid', 'value_type', 'name', 'units'],
            'itemids' => $this->fields_values['itemid'],
            'webitems' => true,
            'filter' => [
                'value_type' => [ITEM_VALUE_TYPE_UINT64, ITEM_VALUE_TYPE_FLOAT]
            ]
        ]);

        $history_value = null;

        if ($db_items) {
            $item = $db_items[0];

            $history = API::History()->get([
                'output' => API_OUTPUT_EXTEND,
                'itemids' => $item['itemid'],
                'history' => $item['value_type'],
                'sortfield' => 'clock',
                'sortorder' => ZBX_SORT_DOWN,
                'limit' => 1
            ]);

            if ($history) {
                $history_value = convertUnitsRaw([
                    'value' => $history[0]['value'],
                    'units' => $item['units']
                ]);
            }
        }

        $this->setResponse(new CControllerResponseData([
            'name' => $this->getInput('name', $this->widget->getName()),
            'history' => $history_value,
            'fields_values' => $this->fields_values,
            'user' => [
                'debug_mode' => $this->getDebugMode()
            ]
        ]));
    }
}- 打开并修改 views/widget.view.php。
你需要为仪表图创建一个容器,后续步骤中将在其中绘制图表,并为描述创建一个容器。
要将值作为 JSON 对象传递给 JavaScript,请使用 setVar() 方法。
ui/modules/lesson_gauge_chart/views/widget.view.php
<?php

/**
 * Gauge chart widget view.
 *
 * @var CView $this
 * @var array $data
 */

(new CWidgetView($data))
    ->addItem([
        (new CDiv())->addClass('chart'),
        $data['fields_values']['description']
            ? (new CDiv($data['fields_values']['description']))->addClass('description')
            : null
    ])
    ->setVar('history', $data['history'])
    ->setVar('fields_values', $data['fields_values'])
->show();-
在 lesson_gauge_chart 目录中创建一个新的 assets 目录。
该目录将用于存放 JavaScript、CSS,以及其他可能的资源,例如字体或图片。 -
对于 widget 视图的 JavaScript,请在 assets 目录中创建一个 js 目录。
-
在 assets/js 目录中创建 class.widget.js 文件。
这个 JavaScript widget 类将扩展所有仪表板 widget 的基础 JavaScript 类 - CWidget。
仪表板依赖 widget 的正确实现,并通过调用相应的 JavaScript 方法向 widget 传递任何相关信息。
仪表板还期望 widget 在发生某些交互时生成事件。
因此,CWidget 类包含一组 widget 行为的默认实现方法,这些方法可以通过继承该类进行自定义。
在这种情况下,需要进行一些自定义,因此将为以下 widget 行为实现自定义逻辑:
- widget 初始化,负责定义 widget 的初始状态(参见 onInitialize() 方法);
- 在 widget 更新过程成功且无错误时显示 widget 内容(即绘制仪表图)(参见 processUpdateResponse(response) 方法以及相关的 _resizeChart() 和 _updatedChart() 方法);
- 调整 widget 大小(参见 onResize() 方法以及相关的 _resizeChart() 方法)
对于仪表图 widget 的其他方面,将使用 widget 行为的默认实现。
要了解更多关于 CWidget 类的 JavaScript 方法,请参见:JavaScript。
由于这个 JavaScript 是 widget 视图所必需的,因此应随仪表板页面一起加载。
要启用 JavaScript 加载,你需要按第 10 步所示更新 manifest.json 文件中的 assets/js 和 js_class 参数。
ui/modules/lesson_gauge_chart/assets/js/class.widget.js
class WidgetLessonGaugeChart extends CWidget {

    static UNIT_AUTO = 0;
    static UNIT_STATIC = 1;

    onInitialize() {
        super.onInitialize();

        this._refresh_frame = null;
        this._chart_container = null;
        this._canvas = null;
        this._chart_color = null;
        this._min = null;
        this._max = null;
        this._value = null;
        this._last_value = null;
        this._units = '';
    }

    processUpdateResponse(response) {
        if (response.history === null) {
            this._value = null;
            this._units = '';
        }
        else {
            this._value = Number(response.history.value);
            this._units = response.fields_values.value_units == WidgetLessonGaugeChart.UNIT_AUTO
                ? response.history.units
                : response.fields_values.value_static_units;
        }

        this._chart_color = response.fields_values.chart_color;
        this._min = Number(response.fields_values.value_min);
        this._max = Number(response.fields_values.value_max);

        super.processUpdateResponse(response);
    }

    setContents(response) {
        if (this._canvas === null) {
            super.setContents(response);

            this._chart_container = this._body.querySelector('.chart');
            this._chart_container.style.height =
                `${this._getContentsSize().height - this._body.querySelector('.description').clientHeight}px`;
            this._canvas = document.createElement('canvas');

            this._chart_container.appendChild(this._canvas);

            this._resizeChart();
        }

        this._updatedChart();
    }

    onResize() {
        super.onResize();

        if (this._state === WIDGET_STATE_ACTIVE) {
            this._resizeChart();
        }
    }

    _resizeChart() {
        const ctx = this._canvas.getContext('2d');
        const dpr = window.devicePixelRatio;

        this._canvas.style.display = 'none';
        const size = Math.min(this._chart_container.offsetWidth, this._chart_container.offsetHeight);
        this._canvas.style.display = '';

        this._canvas.width = size * dpr;
        this._canvas.height = size * dpr;

        ctx.scale(dpr, dpr);

        this._canvas.style.width = `${size}px`;
        this._canvas.style.height = `${size}px`;

        this._refresh_frame = null;

        this._updatedChart();
    }

    _updatedChart() {
        if (this._last_value === null) {
            this._last_value = this._min;
        }

        const start_time = Date.now();
        const end_time = start_time + 400;

        const animate = () => {
            const time = Date.now();

            if (time <= end_time) {
                const progress = (time - start_time) / (end_time - start_time);
                const smooth_progress = 0.5 + Math.sin(Math.PI * (progress - 0.5)) / 2;
                let value = this._value !== null ? this._value : this._min;
                value = (this._last_value + (value - this._last_value) * smooth_progress - this._min) / (this._max - this._min);

                const ctx = this._canvas.getContext('2d');
                const size = this._canvas.width;
                const char_weight = size / 12;
                const char_shadow = 3;
                const char_x = size / 2;
                const char_y = size / 2;
                const char_radius = (size - char_weight) / 2 - char_shadow;

                const font_ratio = 32 / 100;

                ctx.clearRect(0, 0, size, size);

                ctx.beginPath();
                ctx.shadowBlur = char_shadow;
                ctx.shadowColor = '#bbb';
                ctx.strokeStyle = '#eee';
                ctx.lineWidth = char_weight;
                ctx.lineCap = 'round';
                ctx.arc(char_x, char_y, char_radius, Math.PI * 0.749, Math.PI * 2.251, false);
                ctx.stroke();

                ctx.beginPath();
                ctx.strokeStyle = `#${this._chart_color}`;
                ctx.lineWidth = char_weight - 2;
                ctx.lineCap = 'round';
                ctx.arc(char_x, char_y, char_radius, Math.PI * 0.75,
                    Math.PI * (0.75 + (1.5 * Math.min(1, Math.max(0, value)))), false
                    );
                ctx.stroke();

                ctx.shadowBlur = 2;
                ctx.fillStyle = '#1f2c33';
                ctx.font = `${(char_radius * font_ratio)|0}px Arial`;
                ctx.textAlign = 'center';
                ctx.textBaseline = 'middle';
                ctx.fillText(`${this._value !== null ? this._value : t('No data')}${this._units}`,
                    char_x, char_y, size - char_shadow * 4 - char_weight * 2
                );

                ctx.fillStyle = '#768d99';
                ctx.font = `${(char_radius * font_ratio * .5)|0}px Arial`;
                ctx.textBaseline = 'top';

                ctx.textAlign = 'left';
                ctx.fillText(`${this._min}${this._min != '' ? this._units : ''}`,
                    char_weight * .75, size - char_weight * 1.25, size / 2 - char_weight
                );

                ctx.textAlign = 'right';
                ctx.fillText(`${this._max}${this._max != '' ? this._units : ''}`,
                    size - char_weight * .75, size - char_weight * 1.25, size / 2 - char_weight
                );

                requestAnimationFrame(animate);
            }
            else {
                this._last_value = this._value;
            }
        };

        requestAnimationFrame(animate);
    }
}- 打开 manifest.json 并添加:
- 将文件名(class.widget.js)添加到 assets/js 部分的数组中;
- 将类名(WidgetLessonGaugeChart)添加到 widget 部分的 js_class 参数中。
现在,WidgetLessonGaugeChart 类将随仪表板自动加载。
ui/modules/lesson_gauge_chart/manifest.json
{
    "manifest_version": 2.0,
    "id": "lesson_gauge_chart",
    "type": "widget",
    "name": "Gauge chart",
    "namespace": "LessonGaugeChart",
    "version": "1.0",
    "author": "Zabbix",
    "actions": {
        "widget.lesson_gauge_chart.view": {
            "class": "WidgetView"
        }
    },
    "widget": {
        "js_class": "WidgetLessonGaugeChart"
    },
    "assets": {
        "js": ["class.widget.js"]
    }
}
向小部件添加 CSS 样式
在本节中,您将学习如何添加自定义 CSS 样式以使小部件看起来更具吸引力。
-
对于小部件样式,请在 assets 目录中创建一个新目录 css。
-
在 assets/css 目录中创建一个 widget.css 文件。 要设置小部件元素的样式,请使用选择器 div.dashboard-widget-{widget id}。 要为整个小部件配置 CSS,请使用选择器 form.dashboard-widget-{widget id}
ui/modules/lesson_gauge_chart/assets/css/widget.css
div.dashboard-widget-lesson_gauge_chart {
display: grid;
grid-template-rows: 1fr;
padding: 0;
}

div.dashboard-widget-lesson_gauge_chart .chart {
display: grid;
align-items: center;
justify-items: center;
}

div.dashboard-widget-lesson_gauge_chart .chart canvas {
background: white;
}

div.dashboard-widget-lesson_gauge_chart .description {
padding-bottom: 8px;
font-size: 1.750em;
line-height: 1.2;
text-align: center;
}

.dashboard-grid-widget-hidden-header div.dashboard-widget-lesson_gauge_chart .chart {
margin-top: 8px;
}- 打开 manifest.json 并将 CSS 文件名 (widget.css) 添加到 assets/css 部分中的数组。 这将允许 widget.css 中定义的 CSS 样式随仪表板页面一起加载。
ui/modules/lesson_gauge_chart/manifest.json
{
"manifest_version": 2.0,
"id": "lesson_gauge_chart",
"type": "widget",
"name": "Gauge chart",
"namespace": "LessonGaugeChart",
"version": "1.0",
"author": "Zabbix",
"actions": {
"widget.lesson_gauge_chart.view": {
"class": "WidgetView"
}
},
"widget": {
"js_class": "WidgetLessonGaugeChart"
},
"assets": {
"css": ["widget.css"],
"js": ["class.widget.js"]
}
}- 刷新仪表板页面以查看小部件的完成版本。