
4 Triggers top 100
Overview
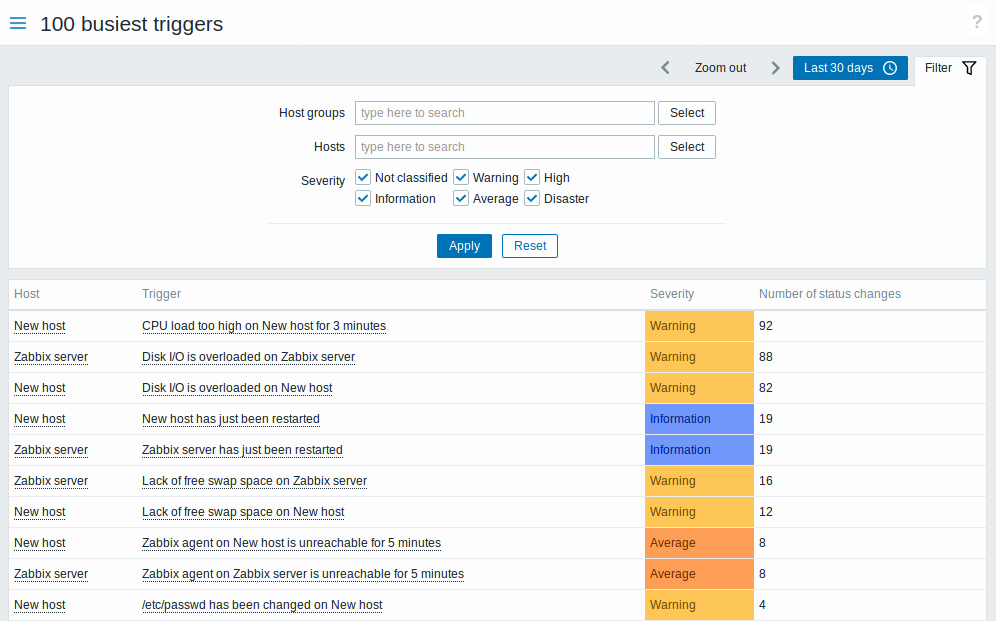
In Reports → Triggers top 100 you can see the triggers that have changed their state most often within the period of evaluation, sorted by the number of status changes.
Both host and trigger column entries are links that offer some useful options:
- for host - links to user-defined scripts, latest data, inventory, graphs, and dashboards for the host
- for trigger - links to latest events, the trigger configuration form, and a simple graph
Using filter
You may use the filter to display triggers by host group, host, or trigger severity. Specifying a parent host group implicitly selects all nested host groups. For better search performance, data is searched with macros unresolved.
The filter is located below the 100 busiest triggers bar. It can be opened and collapsed by clicking on the Filter tab on the left.
Time period selector
The time period selector allows to select often required periods with one mouse click. The time period selector can be opened by clicking on the time period tab next to the filter.