
17 Prometheus チェック
概要
ZabbixはPrometheusのラインフォーマットで公開されているメトリクスを問合せすることができます。
Prometheusのデータ収集を開始するには、2つのステップが必要です。
- 適切なデータエンドポイントを指すHTTP master item (例:
https://<prometheus host>/metrics) - Prometheusのプリプロセッシングオプションを使用して、マスター item によって収集されたメトリクスから必要なデータを問合せする従属 item
Prometheusのデータ前処理オプションは2つあります。
- Prometheus pattern - Prometheusのデータを問い合わせるために通常の item で使用されます。
- Prometheus to JSON - 通常の item とローレベルディスカバリーに使用されます。 この場合、照会されたPrometheusデータはJSONフォーマットで返されます。
バルクプロセッシング
依存 item はバルクプロセッシングに対応しています。
キャッシュとインデックスを有効にするには、Prometheus pattern のプリプロセスを 最初の プリプロセスステップにする必要があります。
Prometheus pattern が最初のプリプロセスステップである場合、パースされた Prometheus データは、
Prometheus pattern プリプロセスステップの最初の <label>==<value> 条件によってキャッシュされ、インデックスが作成されます。
このキャッシュは、このバッチ内の他の依存 item を処理する際に再利用されます。
最適なパフォーマンスを得るために、最初のラベルは最も異なる値を持つものにすべきです。
最初のステップの前に他のプリプロセスがある場合は、マスター item か、従属 item のマスター item として使用される
新しい従属 item のどちらかに移動させる必要があります。
設定
HTTPマスター item が設定されていることを前提に、Prometheusのプリプロセスステップを使用する
dependent itemを作成する必要があります。
- 設定フォームに一般的な従属項目パラメータを入力する
- Preprocessing タブに移動します
- Prometheus の Preprocessing オプション(Prometheus pattern or Prometheus to JSON)を選択します。
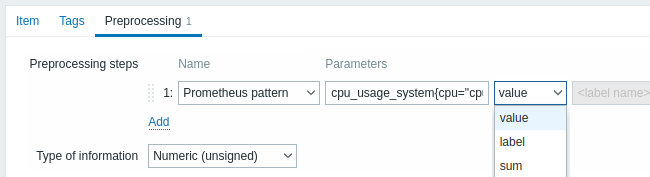
以下のパラメータは、Prometheus pattern Preprocessing オプションに固有のものです:
| パラメータ | 説明 | 例 |
|---|---|---|
| Pattern | To define the required data pattern you may use a query language that is similar to Prometheus query language (see comparison table), e.g.: <metric name> - select by metric name {__name__="<metric name>"} - select by metric name {__name__=\~"<regex>"} - select by metric name matching a regular expression {<label name>="<label value>",...} - select by label name {<label name>=\~"<regex>",...} - select by label name matching a regular expression {__name__=\~".*"}==<value> - select by metric value Or a combination of the above: <metric name>{<label1 name>="<label1 value>",<label2 name>=\~"<regex>",...}==<value> Label value can be any sequence of UTF-8 characters, but the backslash, double-quote and line feed characters have to be escaped as \\, \" and \n respectively; other characters shall not be escaped. |
wmi_os_physical_memory_free_bytes cpu_usage_system{cpu="cpu-total"} cpu_usage_system{cpu=\~".*"} cpu_usage_system{cpu="cpu-total",host=\~".*"} wmi_service_state{name="dhcp"}==1 wmi_os_timezone{timezone=\~".*"}==1 |
| Result processing | Specify whether to return the value, the label or apply the appropriate function (if the pattern matches several lines and the result needs to be aggregated): value - return metric value (error if multiple lines matched) label - return value of the label specified in the Label field (error if multiple metrics are matched) sum - return the sum of values min - return the minimum value max - return the maximum value avg - return the average value count - return the count of values This field is only available for the Prometheus pattern option. |
See also examples of using parameters below. |
| Output | Define label name (optional). In this case the value corresponding to the label name is returned. This field is only available for the Prometheus pattern option, if 'Label' is selected in the Result processing field. |
|
パラメータ使用の例
- 最も一般的な使用例は、値 を返すことです。
/var/dbからの値を返すには、次のようにします。
node_disk_usage_bytes{path="/var/cache"} 2.1766144e+09
node_disk_usage_bytes{path="/var/db"} 20480
node_disk_usage_bytes{path="/var/dpkg"} 8192
node_disk_usage_bytes{path="/var/empty"} 4096
以下のパラメータを使用します:
- Pattern -
node_disk_usage_bytes{path="/var/db"} - Result processing - select 'value'
- また、すべての
node_disk_usage_bytesパラメータの 平均 値に興味があるかもしれません:
- Pattern -
node_disk_usage_bytes - Result processing - select 'avg'
- Prometheusは数値データのみをサポートしていますが、関連するテキストの説明も返すことができるワークアラウンドを
使用することが一般的です。これは、フィルタとラベルを指定することで実現できます。つまり、'color' ラベルの値を返すには、
以下のようにします。
elasticsearch_cluster_health_status{cluster="elasticsearch",color="green"} 1
elasticsearch_cluster_health_status{cluster="elasticsearch",color="red"} 0
elasticsearch_cluster_health_status{cluster="elasticsearch",color="yellow"} 0
以下のパラメータを使用します:
- Pattern -
elasticsearch_cluster_health_status {cluster="elasticsearch"} == 1 - Result processing - select 'label'
- Label - specify 'color'
フィルター(数値'1'に基づく)は適切な行にマッチし、ラベルはヘルスステータスの説明を返す(現在は'緑'だが、'赤'や'黄'の可能性もある)。
PrometheusからJSONへ
Prometheusからのデータローレベルディスカバリーに使用することができます。この場合、JSON形式のデータが必要で、
Prometheus to JSON プリプロセッシングオプションはまさにそのデータを返します。
詳しくは、Discovery using Prometheus dataを参照してください。
クエリ言語の比較
以下の表は、PromQLとZabbix Prometheusプリプロセッシングクエリ言語の相違点と類似点をリストアップしたものです。
| PromQL instant vector selector | Zabbix Prometheus preprocessing | |
|---|---|---|
| 差異 | ||
| Query target | Prometheus server | Plain text in Prometheus exposition format |
| Returns | Instant vector | Metric or label value (Prometheus pattern) Array of metrics for single value in JSON (Prometheus to JSON) |
| Label matching operators | =, !=, =\~, !\~ | =, !=, =\~, !\~ |
| Regular expression used in label or metric name matching | RE2 | PCRE |
| Comparison operators | See list | Only == (equal) is supported for value filtering |
| Similarities | ||
| Selecting by metric name that equals string | <metric name> or {__name__="<metric name>"} | <metric name> or {__name__="<metric name>"} |
| Selecting by metric name that matches regular expression | {__name__=\~"<regex>"} | {__name__=\~"<regex>"} |
| Selecting by <label name> value that equals string | {<label name>="<label value>",...} | {<label name>="<label value>",...} |
| Selecting by <label name> value that matches regular expression | {<label name>=\~"<regex>",...} | {<label name>=\~"<regex>",...} |
| Selecting by value that equals string | {__name__=\~".*"} == <value> | {__name__=\~".*"} == <value> |