2 Overview
Overview
The Monitoring → Overview section allows you to overview trigger states and also compare data for various hosts at once.
The following display options are available:
- you can select horizontal or vertical display of information in the Hosts location dropdown
- you can select all hosts or specific groups in the Group dropdown
- you can choose what information to display (triggers or data) in the Type dropdown
In the screenshot below information is displayed horizontally and trigger states are displayed, as colored blocks (the color depending on the state of the trigger):
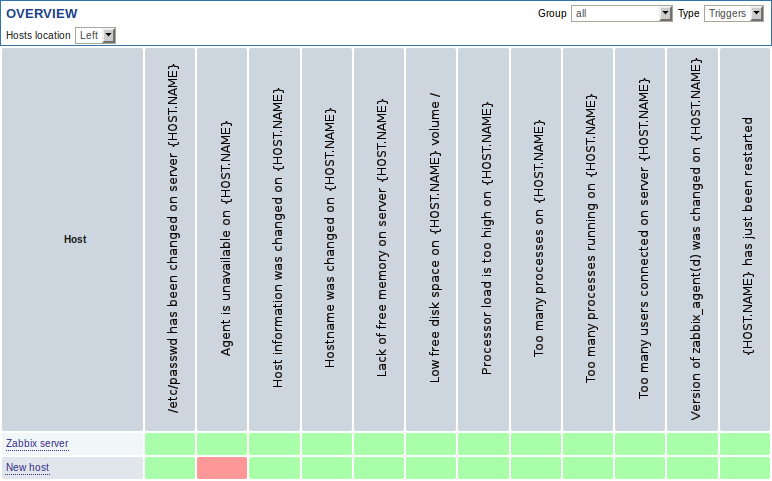
Note that recent trigger changes (within the last 30 minutes) will be displayed as blinking blocks.
Trigger names, displayed vertically, is vertical text since Zabbix 2.0.4. Before that, it used to be vertical images.
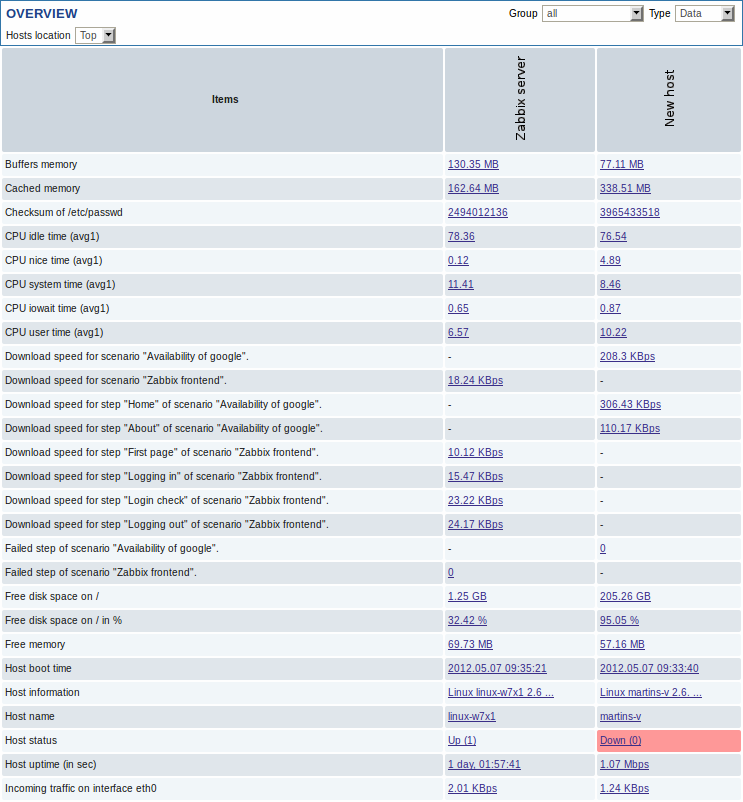
In the next screenshot information is displayed vertically and data is displayed:
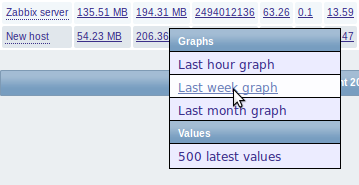
Both trigger blocks and data items are displayed as links. If you click on a trigger block you can access trigger events and a simple graph/latest values list. If you click on a piece of data you can access some graphs for predefined periods or 500 latest values: