
9 Discovery
Overview
In the Monitoring → Discovery section results of network discovery are shown. Discovered devices are sorted by the discovery rule.
With nothing selected in the filter, all enabled discovery rules are displayed. To select a specific discovery rule for display, start typing its name in the filter. All matching enabled discovery rules will be listed for selection. More than one discovery rule can be selected.
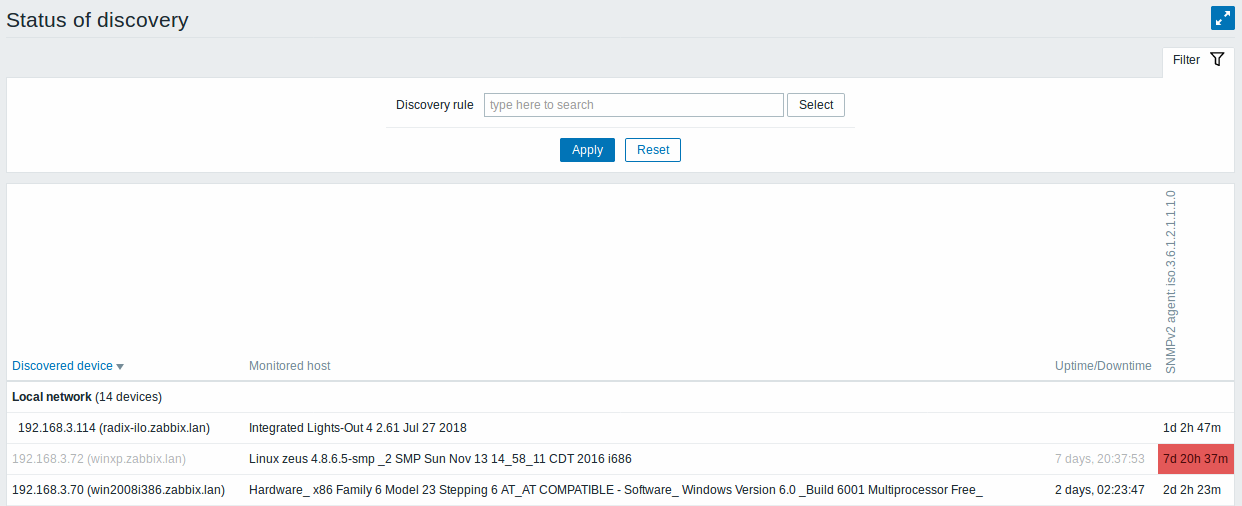
If a device is already monitored, the host name will be listed in the Monitored host column, and the duration of the device being discovered or lost after previous discovery is shown in the Uptime/Downtime column.
After that follow the columns showing the state of individual services for each discovered device (red cells show services that are down). Service uptime or downtime is included within the cell.
Only those services that have been found on at least one device will have a column showing their state.
Buttons
Buttons to the right offer the following options:
 |
Display page in fullscreen mode. |
 |
Display page in kiosk mode. In this mode only page content displayed. The kiosk mode button appears when the fullscreen mode is activated. To exit kiosk mode, move the mouse cursor until the  exit button appears and click on it. Note that you will be taken back to normal mode (not fullscreen mode). exit button appears and click on it. Note that you will be taken back to normal mode (not fullscreen mode). |