
Table of Contents
11. 维护期
概述
在Zabbix中,你可以为主机组,主机以及指定的触发器/服务定义维护期。有两种维护类型可选:一种是有数据收集;另一种是无数据收集。
在“有数据收集”的维护期里,触发器像往常一样正常处理,事件也会在需要的时候被创建。然而,对于正处在维护期的主机来说,如果在动作配置里勾选了 维护期暂停操作(Pause operations while in maintenance) 选项,那么问题升级会被暂停。在这种情况下,只要维护期间持续,可能包含的发送通知或者远程命令的升级步骤会被忽略。
比如,有三个升级步骤原计划是在问题发生后的第0分钟、30分钟和60分钟分别执行。现在定义一个半小时的维护期,持续时间刚好是从问题发生后的第10分钟到第40分钟。那么受维护期的影响,原计划在第30 分钟和60分钟执行的步骤会被推迟半个小时。也就是说,步骤二会在问题发生后的第60分钟执行,步骤三会在问题发生后的第90分钟执行(假设问题仍然存在)。类似的,如果在维护期发生问题,那么问题升级会在维护期结束后开始。
如果需要在维护期间正常接收问题通知(没有延迟),你必须在动作配置里取消勾选 维护期暂停操作(Pause operations while in maintenance) 选项。
只要有一个主机(触发器表达式中使用到的主机)不在维护模式里,Zabbix就可能会发送问题通知。
在维护期间,Zabbix服务必须处于运行状态。计时器进程负责在每分钟的第0秒进行主机是否处于维护状态的切换。注意,当主机进入维护时,Zabbix服务器计时器进程将读取所有打开的问题,以检查是否需要关闭这些问题。如果存在许多开放问题,这可能会对性能产生影响。Zabbix服务器也会在启动时读取所有打开的问题,即使当时没有维护配置。Zabbix代理服务器不论在什么维护类型(包括“无数据收集”维护)下都会收集数据。只不过如果是“无数据收集”类型,这些数据后来会被Zabbix服务器忽略。
当“无数据收集”维护期间刚结束的时候,使用了nodata()函数的触发器不会被触发。这些触发器在下一次检查以后才可能会被触发。
如果在主机处于维护状态的时候添加了一个日志相关的监控项,那么当维护结束时,只会收集自维护结束以来的新日志文件内容。
如果主机处于“无数据收集”维护类型期间,此时给它发送一个带时间戳的值(例如,使用 Zabbix sender),那么这个值会被丢弃。然而,如果主机的维护期过期了,此时给它发送一个带有时间戳的值, 是会被接收的。
<note important>为确保重复性维护期(每天,每周,每月)的行为在预期之中,Zabbix的所有部件都应该使用相同的时区。 :::
如果用户在维护期内更改了主机、主机组或标记,则更改仅在配置缓存同步之后生效。
配置
配置维护期:
- 点击: 配置 → 维护
- 单击 创建维护期间(Create maintenance period) (或者单击已有维护期的名称)
维护选项卡包含了常见的维护期属性:
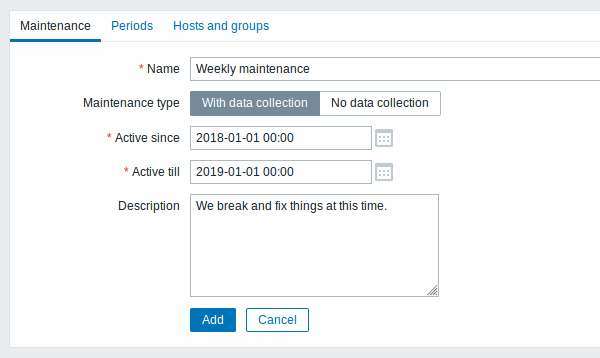
所有必填输入字段都标有红色星号。
| 参数 说 | |
|---|---|
| 名称 维 | 期间的名称。 |
| 维护类型 有两种 | 护类型可以设置: 有数据收集 - 在维护期间数据会被服务器收集,触发器也会被处理 无数据收集 - 在维护期间数据不会被收集 |
| 开始激活(Active since) 当执行维护 | 变为激活状态时的日期和时间。 注意: 单独设置这个时间并不能激活维护期间,还需要切换到 期间(Periods) 选项卡进行操作。 |
| 结束激活(Active till) 当执行维护 | 变为停止激活状态时的日期和时间。 |
| 描述 维 | 期的描述。 |
周期选项卡允许您定义维护发生的确切天数和小时数。单击 新建 会打开一个 维护期 表单,可灵活配置维护期间的时间段 - 每天、每周、每月或者仅一次。
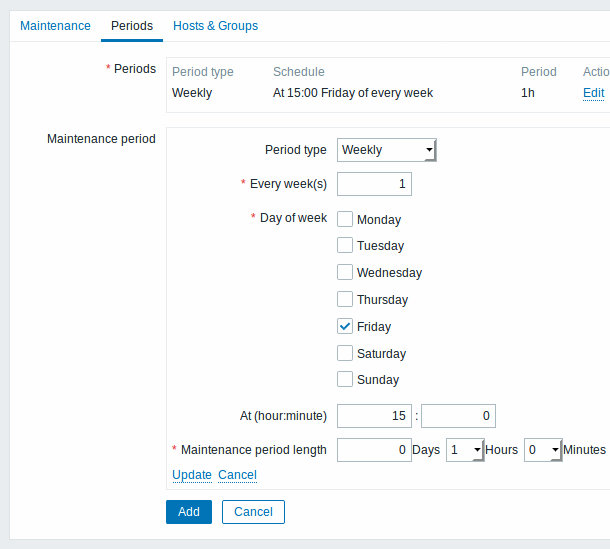
每天和每周周期都有一个 每天/每周 参数,默认值是1。如果设置为2,那么维护期就是每两天或者每两周执行一次,以此类推。起始日期或星期是开始激活(Active since) 时间起作用时的日期或星期。
比如,开始激活(Active since) 设置为2013-09-06 12:00,如果有一个在23:00开始的为期一个小时的维护期,每两天执行一次,那么第一次维护期将会开始于2013-09-06 23:00,第二次维护期开始于2013-09-08 23:00。或者,再举个例子,如果还是那个相同的 开始激活(Active since),每两天执行一次,每次一小时,开始时间设定为01:00,那么,第一次维护期将开始于2013-09-08 01:00,第二次开始于2013-09-10 01:00。
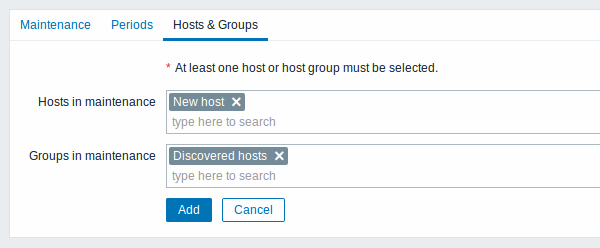
主机&主机组选项卡允许选择需要维护的主机和主机组。
| Parameter | Description |
|---|---|
| Host groups | Select host groups that the maintenance will be activated for. The maintenance will be activated for all hosts from the specified host group(s). This field is auto-complete, so starting to type in it will display a dropdown of all available host groups. Specifying a parent host group implicitly selects all nested host groups. Thus the maintenance will also be activated on hosts from nested groups. |
| Hosts | Select hosts that the maintenance will be activated for. This field is auto-complete, so starting to type in it will display a dropdown of all available hosts. |
| Tags | If maintenance tags are specified, maintenance for the selected hosts will still be activated, but problems will only be suppressed (i.e. no actions will be taken) if their tags are a match. In case of multiple tags, they are calculated as follows: And/Or - all tags must correspond; however tags with the same tag name are calculated by the Or condition Or - enough if one tag corresponds There are two ways of matching the tag value: Contains - case-sensitive substring match (tag value contains the entered string) Equals - case-sensitive string match (tag value equals the entered string) |
显示
显示维护内的主机
主机名称旁边的橙色扳手图标表示该主机正处于维护状态。在 监测中 → 仪表板 ,监控中 → 故障以及资产记录 → 主机 → 主机资产记录 页面,都可以看到这个维护标志。
![]()
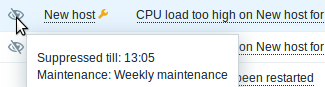
当鼠标指针停留在扳手图标上面的时候会显示维护期的详细信息。
此外,维护中的主机在监测中 → 拓扑图中以橙色背景显示,在配置 → 主机中其状态显示为“维护中”。
Displaying suppressed problems
Normally problems for hosts in maintenance are suppressed, i.e. not displayed in the frontend. However, it is also possible to configure that suppressed problems are shown, by selecting the Show suppressed problems option in these locations:
- Monitoring → Dashboard (in Problem hosts, Problems, Problems by severity, Trigger overview widget configuration)
- Monitoring → Problems (in the filter)
- Monitoring → Overview (in the filter; with 'Triggers' as Type)
- Monitoring → Maps (in map configuration)
- Global notifications (in user profile configuration)
When suppressed problems are displayed, the following icon is displayed: ![]() . Rolling a mouse over the icon displays more details:
. Rolling a mouse over the icon displays more details: